
Table 1
Summary statistics by destination country: countries sorted alphabetically
| Country | 1 | 2 | 3 | 4 | 5 | 6 | 7 | 8 | 9 | 10 |
|---|---|---|---|---|---|---|---|---|---|---|
| Age, years | Males | Secondary education completed | College or more | Married | Employed | Official/most common language | Unemployment rate, % | Continent | Observations, n | |
| Argentina | 51.97 | 0.49 | 0.31 | 0.17 | 0.73 | 0.58 | Spanish | 18.3 | America | 3,372 |
| Austria | 38.80 | 0.37 | 0.28 | 0.34 | 0.37 | 0.73 | German | 3.6 | Europe | 132 |
| Bolivia | 41.06 | 0.56 | 0.32 | 0.64 | 0.47 | 0.64 | Spanish | 5.4 | America | 77 |
| Brazil | 50.44 | 0.58 | 0.27 | 0.36 | 0.80 | 0.65 | Portuguese | 9.5 | America | 737 |
| Chile | 41.65 | 0.57 | 0.24 | 0.69 | 0.69 | 0.70 | Spanish | 8.9 | America | 379 |
| Colombia | 42.15 | 0.60 | 0.12 | 0.85 | 0.62 | 0.76 | Spanish | 12.0 | America | 96 |
| Costa Rica | 42.55 | 0.57 | 0.21 | 0.67 | 0.64 | 0.70 | Spanish | 5.1 | America | 86 |
| Cuba | 50.36 | 0.45 | 0.40 | 0.33 | 0.67 | 0.55 | Spanish | 3.3 | America | 55 |
| El Salvador | 42.24 | 0.52 | 0.16 | 0.72 | 0.84 | 0.80 | Spanish | 6.3 | America | 25 |
| France | 47.01 | 0.47 | 0.12 | 0.21 | 0.66 | 0.74 | French | 8.8 | Europe | 41,193 |
| Greece | 39.87 | 0.22 | 0.31 | 0.50 | 0.72 | 0.54 | Greek | 10.2 | Europe | 68 |
| Ireland | 30.43 | 0.36 | 0.30 | 0.66 | 0.18 | 0.79 | English | 4.2 | Europe | 343 |
| Mexico | 43.65 | 0.59 | 0.30 | 0.51 | 0.82 | 0.70 | Spanish | 2.6 | America | 850 |
| Nicaragua | 41.56 | 0.44 | 0.26 | 0.70 | 0.67 | 0.78 | Spanish | 5.6 | America | 27 |
| Panama | 43.52 | 0.58 | 0.26 | 0.49 | 0.76 | 0.79 | Spanish | 13.5 | America | 96 |
| Peru | 42.42 | 0.61 | 0.22 | 0.74 | 0.57 | 0.57 | Spanish | 4.5 | America | 195 |
| The Philippines | 38.68 | 0.40 | 0.10 | 0.41 | 0.66 | 0.00 | Filipino | 11.2 | Asia | 19 |
| Portugal | 39.56 | 0.44 | 0.20 | 0.34 | 0.75 | 0.69 | Portuguese | 4.0 | Europe | 259 |
| South Africa | 47.07 | 0.57 | 0.60 | 0.21 | 0.79 | 0.65 | English | 25.4 | Africa | 23 |
| The United States | 38.80 | 0.48 | 0.23 | 0.66 | 0.66 | 0.73 | English | 4.0 | America | 3,248 |
| Venezuela | 48.53 | 0.53 | 0.34 | 0.29 | 0.76 | 0.66 | Spanish | 12.8 | America | 3,037 |
| Mean | 45.34 | 0.49 | 0.21 | 0.36 | 0.68 | 0.70 | 8.75 | |||
| Standard deviation | 9.69 | 0.50 | 0.41 | 0.48 | 0.47 | 0.46 | 4.47 |
[i] Note: Data come from the Integrated Public Use Microdata Series–International microdata for the period 2000–2007.
Table 2
Location choice: destination countries classified by language (dependent variable: English, Spanish, and Others)
| Variables | 1 | 2 | 3 | 4 | 5 | 6 | 7 | 8 |
|---|---|---|---|---|---|---|---|---|
| Secondary education completed | ||||||||
| English–Others | 8.797*** | 2.328 *** | 2.862*** | 2.328*** | 2.881*** | 2.328*** | 2.117*** | 2.328*** |
| English–Spanish | 2.027*** | 1.396** | 2.047*** | 1.396** | 2.100*** | 1.396** | 1.509*** | 1.396** |
| Others–Spanish | 0.230*** | 0.600*** | 0.715*** | 0.600*** | 0.729*** | 0.600*** | 0.713*** | 0.600*** |
| Some college/university completed | ||||||||
| English–Others | 11.937*** | 2.752*** | 4.127*** | 2.752*** | 4.159*** | 2.752*** | 2.628*** | 2.752*** |
| English–Spanish | 3.680*** | 1.548 *** | 3.720*** | 1.548*** | 4.152*** | 1.548*** | 1.606*** | 1.548*** |
| Others–Spanish | 0.308*** | 0.563*** | 0.901 | 0.563*** | 0.998 | 0.563*** | 0.611*** | 0.563*** |
| Year dummies | No | Yes | No | Yes | No | Yes | Yes | Yes |
| McFadden's adjusted R2 | 0.161 | 0.713 | 0.144 | 0.471 | 0.154 | 0.460 | 0.517 | 0.735 |
| Observations | 54,317 | 54,317 | 13,124 | 13,124 | 12,781 | 12,781 | 12,865 | 54,518 |
Notes: Sample consists of Spanish emigrants in Argentina 2001, Austria 2001, Bolivia 2001, Brazil 2000, Chile 2002, Colombia 2005, Costa Rica 2000, Cuba 2002, El Salvador 2007, France 2006, Greece 2001, Ireland 2002, Mexico 2000, Nicaragua 2005, Panama 2000, Peru 2007, Philippines 2000, Portugal 2001, South Africa 2001, United States 2000, and Venezuela 2001. The dependent variable is the official or the most common language of the destination countries. Languages are classified into the following categories: English, Spanish, and Others. This table shows the factor change in the odds ratios, exp(βi,m|n)δ, with δ = 1. Columns 1–8 include the following as controls: age, age square/100, gender (male), being married, and being employed. Columns 3 and 4 exclude France. Columns 5 and 6 include information on those countries collecting their censuses from 2000 to 2002. Column 7 excludes France and Portugal. Column 8 includes UK 1991. Estimates are weighted. Standard errors are robust.
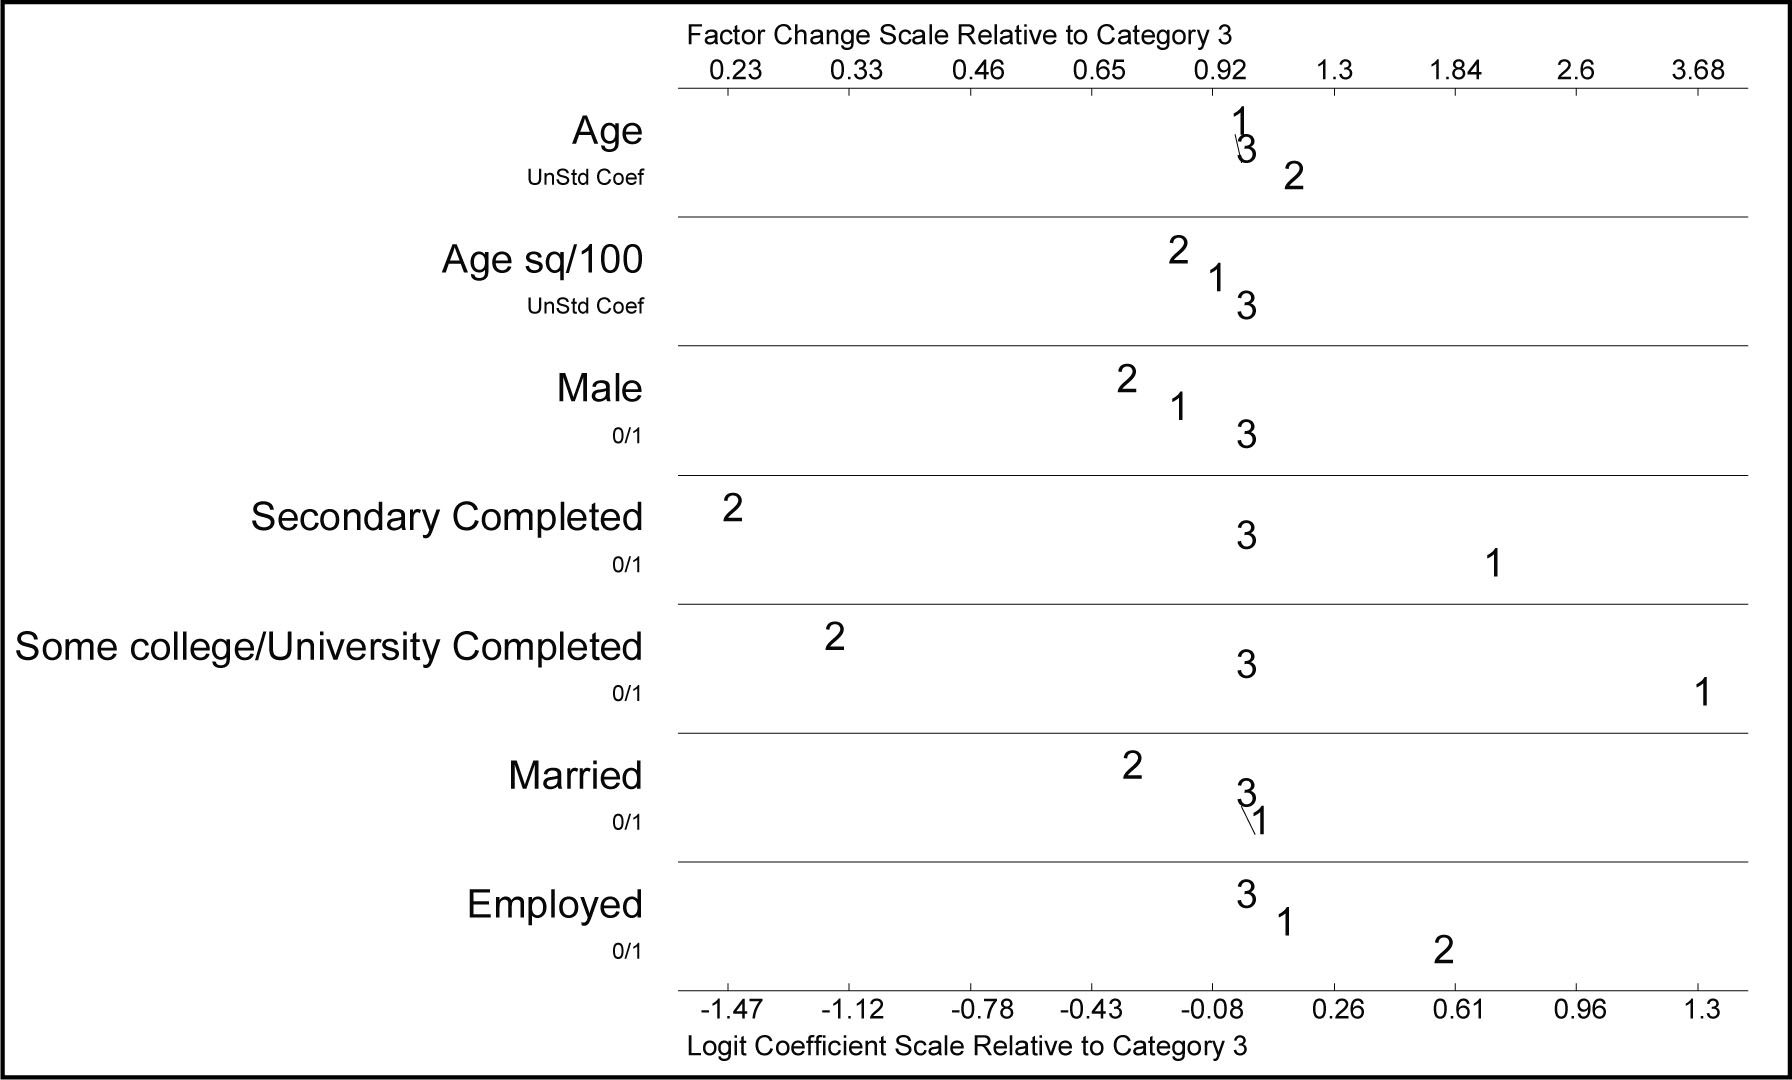
Figure 1
Notes: Dependent variable: languages (English, Spanish, and Others). Standard errors are robust. With respect to the sample, see the notes in Table 2. Countries are classified using the official or the most common language. The numbers correspond to the outcome categories: “1” indicates English, “2” indicates Others, and “3” indicates Spanish. The additive scale on the bottom axis measures the value of βi,m|n δ. The multiplicative scale on the top axis measures exp(βi,m|n)δ. The statistical significance is shown by drawing a line between categories for which there is no significant coefficient at the 5% level. UnStd Coef means Unstandardized Coefficient and 0/1 means a dummy variable.
Table 3
Location choice: destination countries classified by continent (dependent variable: Europe, America, and Others)
| Variables | 1 | 2 | 3 |
|---|---|---|---|
| Secondary education completed | |||
| Europe–America | 0.168*** | 0.413*** | 0.413*** |
| Europe–Others | 0.139*** | 0.333** | 0.333** |
| America–Others | 0.828 | 0.806 | 0.806 |
| Some college/university completed | |||
| Europe–America | 0.151*** | 0.252*** | 0.252*** |
| Europe–Others | 0.288** | 0.457 | 0.457 |
| America–Others | 1.908 | 1.810 | 1.811 |
| Year dummies | No | Yes | Yes |
| McFadden's adjusted R2 | 0.134 | 0.823 | 0.834 |
| Observations | 54,317 | 54,317 | 54,518 |
Notes: The dependent variable is the location of the destination countries. This location is classified into the following categories: Europe, America, and Others (Philippines and South Africa). This table shows the factor change in the odds ratios, exp(βi,m|n)δ, with δ = 1. With respect to the sample, see notes in Table 2. Columns 1–3 include the following as controls: age, age square/100, gender (male), being married, and being employed. Column 3 includes UK 1991. Estimates are weighted. Standard errors are robust.
Table 4
Location choice: destination countries classified by economic situation (dependent variables: high UR [HU], medium UR [MU], and low UR [LU])
| Variables | 1 | 2 | 3 |
|---|---|---|---|
| Secondary education completed | |||
| LU–MU | 3.783*** | 1.014 | 1.014 |
| LU–HU | 1.505*** | 1.571*** | 1.571*** |
| MU–HU | 0.3978*** | 1.549*** | 1.549*** |
| Some college/university completed | |||
| LU–MU | 2.898*** | 0.712** | 0.712** |
| LU–HU | 2.347*** | 2.622*** | 2.622*** |
| MU–HU | 0.810*** | 3.683*** | 3.683*** |
| Year dummies | No | Yes | Yes |
| McFadden's adjusted R2 | 0.078 | 0.373 | 0.389 |
| Observations | 54,317 | 54,317 | 54,518 |
Notes: The dependent variable is the UR of the destination country (source: World Bank). This UR is classified into the following categories: low unemployment (LU: UR <4%), medium unemployment (MU: UR between 4% and 9.9%), and high unemployment (HU, UR ≥10%). This table shows the factor change in the odds ratios, exp(βi,m|n)δ, with δ = 1. With respect to the sample, see notes in Table 2. Columns 1–3 include the following as controls: age, age square/100, gender (male), being married, and being employed. Column 3 includes UK 1991. Estimates are weighted. Standard errors are robust.
UR = unemployment rate.
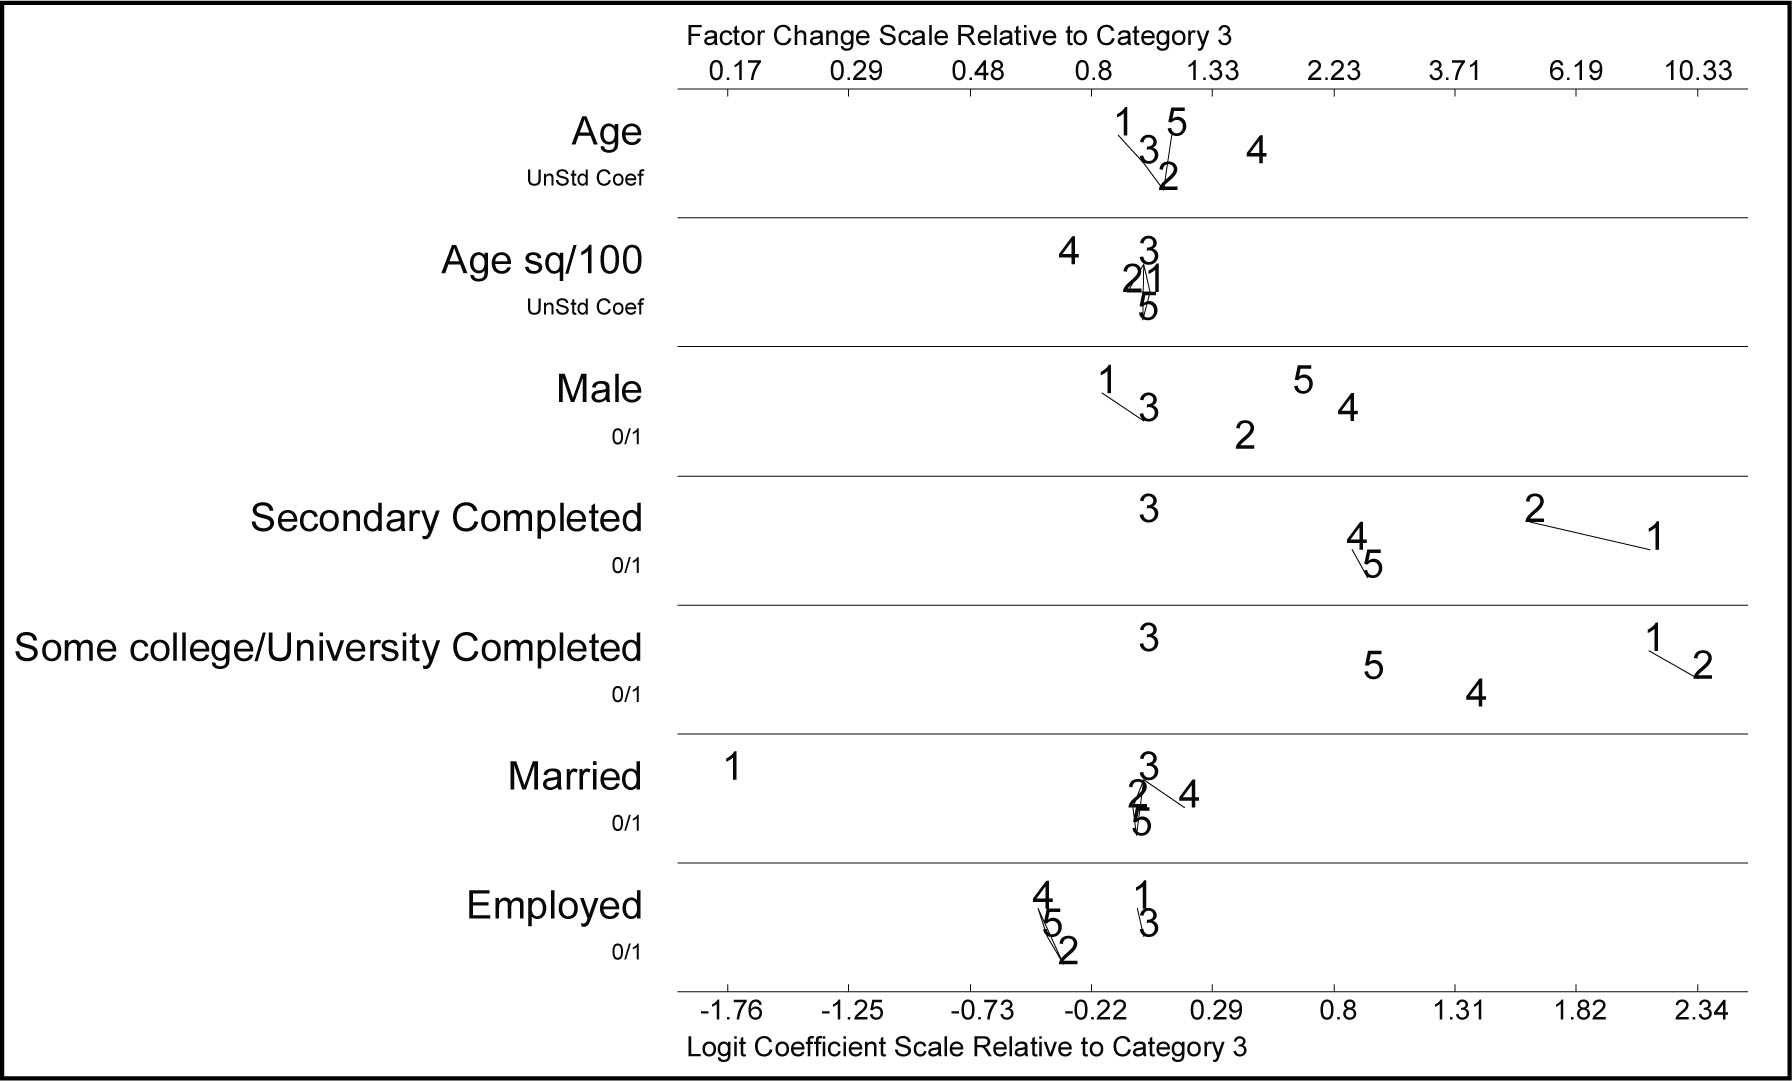
Figure 2
Notes: Dependent variables: languages and continent. This corresponds to Column 3 of Table A2. The numbers correspond to the following outcome categories: “1” indicates Europe (English), “2” is for America (English), “3” represents Europe (Others), “4” corresponds to America (Others), and “5” means America (Spanish). UnStd Coef means Unstandardized Coefficient and 0/1 means a dummy variable.
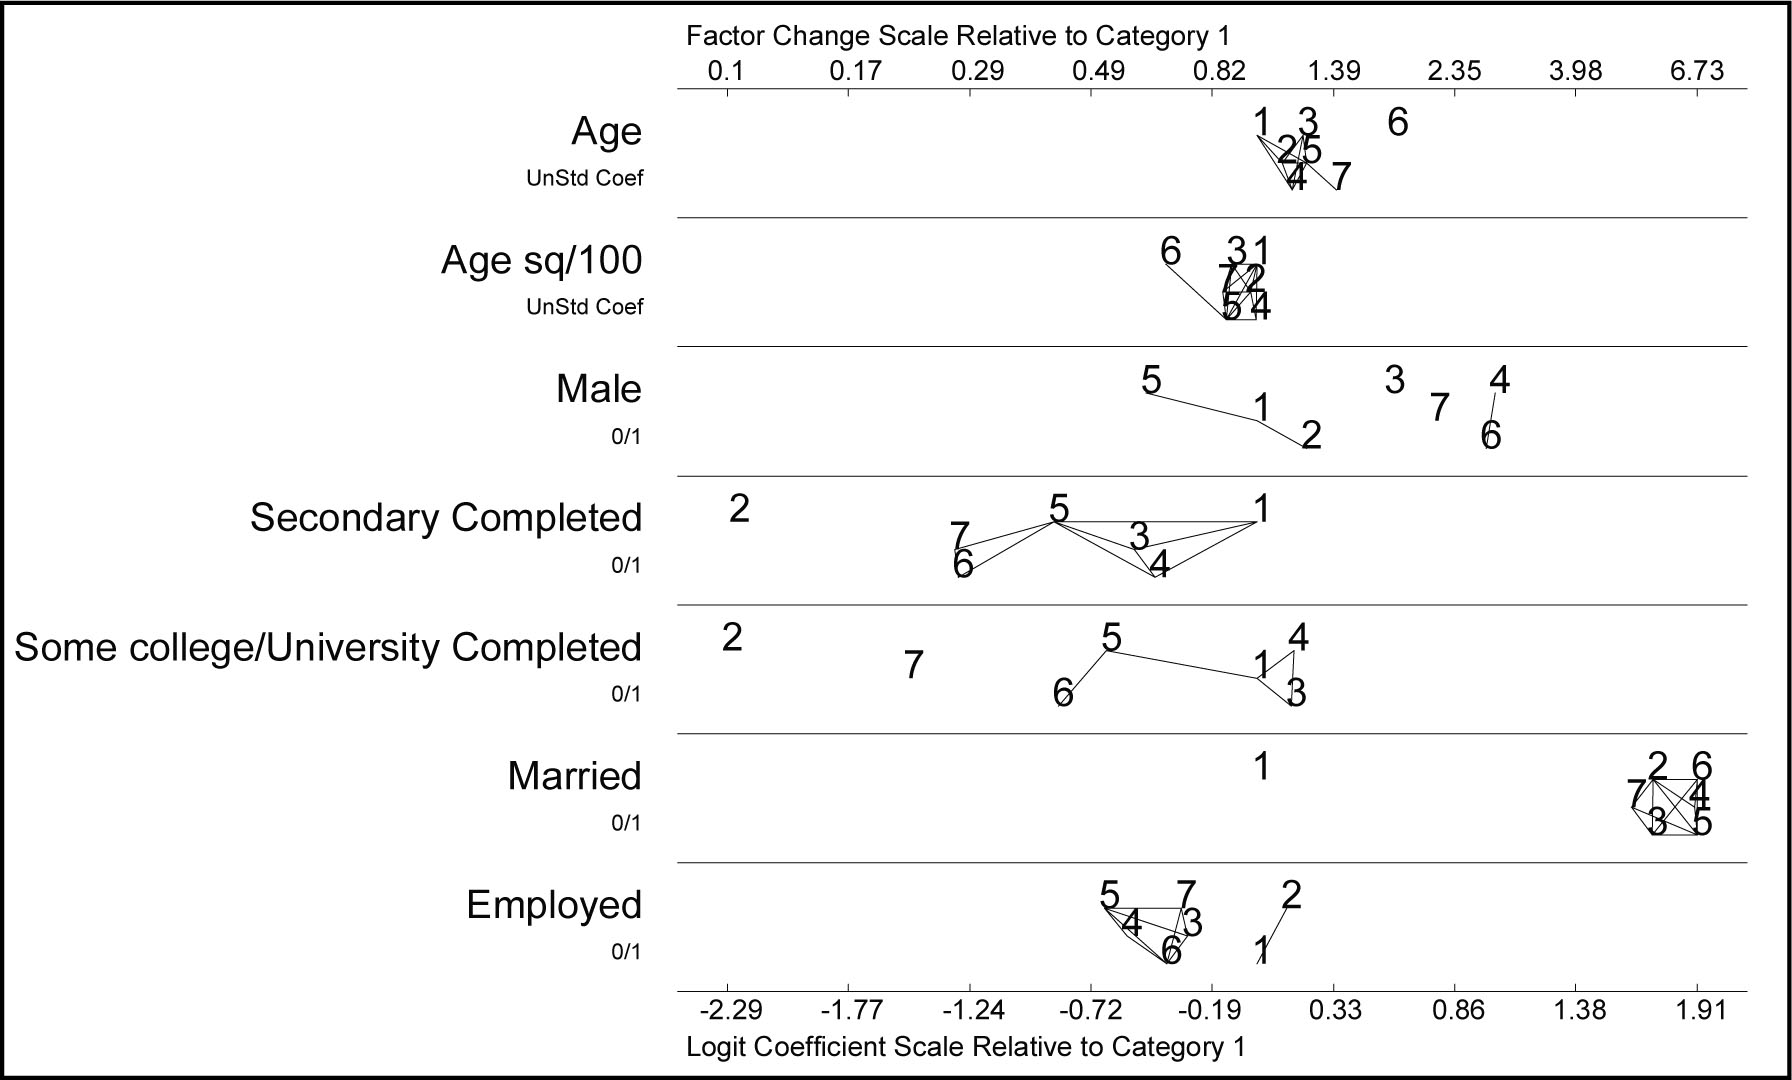
Figure 3
Notes: Dependent variables: languages, unemployment level, and continent. This corresponds to Column 3 of Table A4. The numbers correspond to the outcome categories: “1” indicates Europe, unemployment rate (UR) below the average, and English as the most common language; “2” indicates Europe, UR below the average, and Others as the most common language; “3” stands for America, UR below the average, and English as the most common language; “4” corresponds to America, UR below the average, and Spanish as the most common language; “5” means Europe, UR above the average, and Others as the most common language; “6” indicates America, UR above the average, and Others as the most common language; and “7” represents America, UR above the average, and Spanish as the most common language. UnStd Coef means Unstandardized Coefficient and 0/1 means a dummy variable.
Table 5
Analysis over time: decades 1960–2000 (dependent variable: languages – English, Spanish, and Others)
| Decade 1960 | 1 | 2 | Decade 1970 | 3 | 4 |
|---|---|---|---|---|---|
| Secondary education completed | |||||
| English–Others | 16.073*** | 17.345*** | 10.797*** | 10.744*** | |
| English–Spanish | 4.734*** | 3.257** | 9.623*** | 10.847*** | |
| Others–Spanish | 0.295*** | 0.188*** | 0.891 | 1.010 | |
| Some college/university education completed | |||||
| English–Others | 14.586*** | 15.379*** | 10.240*** | 10.180*** | |
| English–Spanish | 4.752*** | 1.626 | 10.505*** | 10.406*** | |
| Others–Spanish | 0.326*** | 0.106*** | 1.026 | 1.022 | |
| Year dummies | No | Yes | No | Yes | |
| McFadden's adjusted R2 | 0.078 | 0.546 | 0.052 | 0.178 | |
| Observations | 8,803 | 8,803 | 24,226 | 24,226 | |
| Decade 1980 | Decade 1990 | ||||
| Secondary education completed | |||||
| English–Others | 3.701*** | 3.879*** | 1.071 | 1.056 | |
| English–Spanish | 5.469*** | 6.050*** | 1.473*** | 1.533*** | |
| Others–Spanish | 1.478*** | 1.560*** | 1.376*** | 1.451*** | |
| Some college/university education completed | |||||
| English–Others | 4.175 *** | 4.411*** | 1.069 | 1.062 | |
| English–Spanish | 7.312*** | 7.992*** | 1.598*** | 1.816*** | |
| Others–Spanish | 1.752*** | 1.812*** | 1.495*** | 1.710 *** | |
| Year dummies | No | Yes | No | Yes | |
| McFadden's adjusted R2 | 0.053 | 0.084 | 0.078 | 0.094 | |
| Observations | 27,499 | 27,499 | 17,368 | 17,368 | |
| Decade 2000 | |||||
| Secondary education completed | |||||
| English–Others | 4.130*** | 4.130*** | |||
| English–Spanish | 3.879*** | 3.879*** | |||
| Others–Spanish | 0.939 | 0.939 | |||
| Some college/university education completed | |||||
| English–Others | 4.599 *** | 4.599 *** | |||
| English–Spanish | 8.628*** | 8.628*** | |||
| Others–Spanish | 1.876** | 1.876** | |||
| Year dummies | No | Yes | |||
| McFadden's adjusted R2 | 0.120 | 0.120 | |||
| Observations | 2,718 | 2,718 | |||
Notes: Decade 1960: Sample consists of emigrants in Brazil 1960, Colombia 1964, Costa Rica 1963, Ecuador 1962, Mexico 1960, United States 1960, and Uruguay 1963. Decade 1970: Argentina 1970, Bolivia 1976 Brazil 1970, Chile 1970, Colombia 1973, Costa Rica 1973, Mexico 1970, Romania 1977, United States 1970, Uruguay 1975, and Venezuela 1971. Decade 1980: Argentina 1980, Brazil 1980, Chile 1982, Costa Rica 1984, Ireland 1986, Panama 1980, Portugal 1981, United States 1980, Uruguay 1985, and Venezuela 1981. Decade 1990: Argentina 1991, Brazil 1991, Chile 1992, Colombia 1993, Ireland 1996, Mexico 1990, Nicaragua 1995, Peru 1993, Portugal 1991, Romania 1992, United Kingdom 1991, United States 1990, and Venezuela 1990. Decade 2000: Argentina 2010, Brazil 2010, Ecuador 2010, Mexico 2010, Panama 2010, United States 2010. The dependent variable is the official (or the most common) language of the destination countries. Languages are classified into the following categories: English, Spanish, and Others. This table shows the odds ratios, exp(βi,m|n)δ, with δ = 1. All columns include the following as controls: age, age square/100, gender (male), being married, and being employed. Estimates are weighted. Standard errors are robust.
Table A1
Robustness check: considering different subsamples varying the age of Spanish emigrants (dependent variable: English, Spanish, and Others)
| Variables | 1 | 2 | 3 | 4 | 5 | 6 | 7 | 8 | 9 | 10 |
|---|---|---|---|---|---|---|---|---|---|---|
| Secondary education completed | ||||||||||
| English–Others | 8.797*** | 2.328 *** | 9.407*** | 2.704*** | 9.028*** | 2.2033*** | 9.930*** | 2.089*** | 1.444*** | 3.174*** |
| English–Spanish | 2.027*** | 1.396** | 2.352*** | 1.587*** | 1.747*** | 1.204 | 1.955*** | 1.262 | 0.732*** | 1.244 |
| Others–Spanish | 0.230*** | 0.600*** | 0.250*** | 0.587*** | 0.194*** | 0.5463*** | 0.197*** | 0.604*** | 0.507*** | 0.392*** |
| Some college/university education completed | ||||||||||
| English–Others | 11.937*** | 2.752*** | 12.257*** | 3.268*** | 12.73*** | 2.4242*** | 14.727*** | 2.276*** | 8.223*** | 4.229*** |
| English–Spanish | 3.680*** | 1.548 *** | 4.148*** | 1.630*** | 2.940*** | 1.4963*** | 3.404*** | 1.705*** | 1.509** | 1.568** |
| Others–Spanish | 0.308*** | 0.563*** | 0.338*** | 0.499*** | 0.231*** | 0.6172*** | 0.231*** | 0.749** | 0.184*** | 0.371*** |
| Year dummies | No | Yes | No | Yes | No | Yes | No | Yes | No | Yes |
| McFadden's adjusted R2 | 0.161 | 0.713 | 0.152 | 0.713 | 0.161 | 0.698 | 0.160 | 0.696 | 0.084 | 0.674 |
| Observations | 54,317 | 54,317 | 65,045 | 65,045 | 30,743 | 30,743 | 27,235 | 27,235 | 12,259 | 12,259 |
Notes: With respect to the sample, see notes in Table 2. The dependent variable is the official language or the most common language of the destination countries. Languages are classified into the following categories: English, Spanish, and Others. This table shows the factor change in the odds ratios, exp(βi,m|n)δ, with δ = 1. Columns 1–10 include the following as controls: age, age square/100, gender (male), being married, and being employed. Columns 3 and 4 include individuals aged 25–64 years. Columns 5 and 6 include individuals aged 25–49 years. Columns 7 and 8 include individuals aged 30–49 years. Columns 9 and 10 include individuals aged 25–39 years. Standard errors are robust.
Table A2
Location choice: destination countries classified by languages and continents
| Variables | 1 | 2 | 3 |
|---|---|---|---|
| Secondary education completed | |||
| Europe (English)–America (English) | 1.491 | 1.660* | 1.660* |
| Europe (English)–Europe (Others) | 15.209*** | 8.468*** | 8.468*** |
| Europe (English)–America (Others) | 3.076*** | 3.516*** | 3.516*** |
| Europe (English)–America (Spanish) | 2.854*** | 3.297*** | 3.297*** |
| America (English)–Europe (Others) | 10.199*** | 5.101*** | 5.101*** |
| America (English)–America (Others) | 2.063*** | 2.118*** | 2.118*** |
| America (English) –America (Spanish) | 1.914*** | 1.986*** | 1.986*** |
| Europe (Others)–America (Others) | 0.202*** | 0.415*** | 0.415*** |
| Europe (Others)–America (Spanish) | 0.188*** | 0.389*** | 0.389*** |
| America (Others)–America (Spanish) | 0.928 | 0.938* | 0.938 |
| Some college/university education completed | |||
| Europe (English)–America (English) | 0.700 | 0.815 | 0.815 |
| Europe (English)–Europe (Others) | 10.150*** | 8.417*** | 8.417*** |
| Europe (English)–America (Others) | 1.800** | 2.118** | 2.118** |
| Europe (English)–America (Spanish) | 2.521*** | 3.265*** | 3.265*** |
| America (English)–Europe (Others) | 14.503*** | 10.331*** | 10.332*** |
| America (English)–America (Others) | 2.572*** | 2.600*** | 2.600*** |
| America (English)–America (Spanish) | 3.602*** | 4.007*** | 4.008*** |
| Europe (Others)–America (Others) | 0.177*** | 0.252*** | 0.252*** |
| Europe (Others)–America (Spanish) | 0.248*** | 0.388*** | 0.388*** |
| America (Others)–America (Spanish) | 1.401*** | 1.541*** | 1.541*** |
| Year dummies | No | Yes | Yes |
| McFadden's adjusted R2 | 0.161 | 0.570 | 0.632 |
| Observations | 54,275 | 54,275 | 54,476 |
Notes: With respect to the sample, see notes in Table 2. The dependent variable is a combination of the location of the destination countries and the official or the most common language. This location is classified into the following categories: Europe and America. The language classification is as follows: English, Spanish, and Others. The languages of the destination countries are in parentheses. This table shows the factor change in the odds ratios, exp(βi,m|n)δ, with δ = 1. Columns 1–3 include the following as controls: age, age square/100, gender (male), being married, and being employed. Column 3 includes UK 1991. Estimates are weighted. Standard errors are robust.
Table A3
Location choice: destination countries classified by URs and continents
| Variables | 1 | 2 | 3 |
|---|---|---|---|
| Secondary education completed | |||
| Europe/LU–America/LU | 0.099*** | 0.255*** | 0.255*** |
| Europe/LU–Europe/HU | 0.148*** | 0.363*** | 0.363*** |
| Europe/LU–America/HU | 0.209*** | 0.548*** | 0.548*** |
| America/LU–Europe/HU | 1.498 | 1.424 | 1.424 |
| America/LU–America/HU | 2.109*** | 2.148*** | 2.148*** |
| Europe/HU–America/HU | 1.407 | 1.508 | 1.508 |
| Some college/university education completed | |||
| Europe/LU–America/LU | 0.069*** | 0.133*** | 0.133*** |
| Europe/LU–Europe/HU | 0.161*** | 0.292*** | 0.292*** |
| Europe/LU–America/HU | 0.307 *** | 0.590*** | 0.590*** |
| America/LU–Europe/HU | 2.344** | 2.189 ** | 2.189** |
| America/LU–America/HU | 4.479*** | 4.425*** | 4.425*** |
| Europe/HU–America/HU | 1.911* | 2.022** | 2.022** |
| Year dummies | No | Yes | Yes |
| McFadden's adjusted R2 | 0.178 | 0.630 | 0.646 |
| Observations | 54,275 | 54,275 | 54,476 |
Notes: With respect to the sample, see notes in Table 2. The dependent variable is a combination of the location of the destination country and the UR. This location is classified into the following categories: Europe and America. The UR is divided into two categories: above-average UR (HU); and below-average UR (LU). This table shows the factor change in the odds ratios, exp(βi,m|n)δ, with δ = 1. Columns 1–3 include the following as controls: age, age square/100, gender (male), being married, and being employed. Column 3 includes UK 1991. Estimates are weighted. Standard errors are robust.
HU = high UR; LU = low UR; UR = unemployment rate.
Table A4
Location choice: destination countries classified by languages, URs, and continents
| Variables | 1 | 2 | 3 |
|---|---|---|---|
| Secondary education completed | |||
| EU/LU/English–EU/LU/Others | 15.571*** | 9.662*** | 9.595*** |
| EU/LU/English–AM/LU/English | 1.510 | 1.712* | 1.701* |
| EU/LU/English–AM/LU/Spanish | 1.364 | 1.667 | 1.555 |
| EU/LU/English–EU/HU/Others | 2.203* | 2.431* | 2.411 * |
| EU/LU/English–AM/HU/Others | 3.130*** | 3.689*** | 3.647*** |
| EU/LU/English–AM/HU/Spanish | 3.189*** | 3.741*** | 3.700*** |
| EU/LU/Others–AM/LU/English | 0.097*** | 0.177*** | 0.177*** |
| EU/LU/Others–AM/LU/Spanish | 0.088*** | 0.173*** | 0.162*** |
| EU/LU/Others–EU/HU/Others | 0.142*** | 0.252*** | 0.251*** |
| EU/LU/Others–AM/HU/Others | 0.201*** | 0.382*** | 0.380*** |
| EU/LU/Others–AM/HU/Spanish | 0.205*** | 0.387*** | 0.386*** |
| AM/LU/English–AM/LU/Spanish | 0.903 | 0.974 | 0.914 |
| AM/LU/English–EU/HU/Others | 1.459 | 1.419 | 1.418 |
| AM/LU/English–AM/HU/Others | 2.073*** | 2.155*** | 2.144 *** |
| AM/LU/English–AM/HU/Spanish | 2.112*** | 2.185*** | 2.175*** |
| AM/LU/Spanish–EU/HU/Others | 1.615 | 1.458 | 1.550 |
| AM/LU/Spanish–AM/HU/Others | 2.295*** | 2.213*** | 2.345*** |
| AM/LU/Spanish–AM/HU/Spanish | 2.338*** | 2.244*** | 2.379*** |
| EU/HU/Others–AM/HU/Others | 1.421 | 1.518 | 1.513 |
| EU/HU/Others–AM/HU/Spanish | 1.447 | 1.539 | 1.535 |
| AM/HU/Others–AM/HU/Spanish | 1.019 | 1.014 | 1.015 |
| Some college/university education completed | |||
| EU/LU/English-EU/LU/Others | 10.706*** | 9.888 *** | 9.912*** |
| EU/LU/English–AM/LU/English | 0.723 | 0.854 | 0.861 |
| EU/LU/English–AM/LU/Spanish | 0.712 | 0.967 | 0.853 |
| EU/LU/English–EU/HU/Others | 1.677 | 1.911 | 1.923 |
| EU/LU/English–AM/HU/Others | 1.926** | 2.325** | 2.361** |
| EU/LU/English–AM/HU/Spanish | 3.700*** | 4.460*** | 4.522*** |
| EU/LU/Others–AM/LU/English | 0.068*** | 0.086*** | 0.087*** |
| EU/LU/Others–AM/LU/Spanish | 0.067*** | 0.098*** | 0.086*** |
| EU/LU/Others–EU/HU/Others | 0.157*** | 0.193*** | 0.194*** |
| EU/LU/Others–AM/HU/Others | 0.180*** | 0.235*** | 0.238*** |
| EU/LU/Others–AM/HU/Spanish | 0.346*** | 0.451*** | 0.456*** |
| AM/LU/English–AM/LU/Spanish | 0.985 | 1.131 | 0.991 |
| AM/LU/English–EU/HU/Others | 2.320** | 2.236** | 2.235** |
| AM/LU/English–AM/HU/Others | 2.665*** | 2.721*** | 2.744*** |
| AM/LU/English–AM/HU/Spanish | 5.119 *** | 5.219*** | 5.254*** |
| AM/LU/Spanish–EU/HU/Others | 2.357 ** | 1.976* | 2.256** |
| AM/LU/Spanish–AM/HU/Others | 2.707*** | 2.405*** | 2.770*** |
| AM/LU/Spanish–AM/HU/Spanish | 5.199*** | 4.613*** | 5.304*** |
| EU/HU/Others–AM/HU/Others | 1.148 | 1.217 | 1.228 |
| EU/HU/Others–AM/HU/Spanish | 2.206** | 2.334** | 2.351** |
| AM/HU/Others–AM/HU/Spanish | 1.921*** | 1.918*** | 1.915*** |
| Year dummies | No | Yes | Yes |
| McFadden's adjusted R2 | 0.159 | 0.529 | 0.581 |
| Observations | 54,275 | 54,275 | 54,476 |
Notes: With respect to the sample, see notes in Table 2. The dependent variable is a combination of the location of the destination country, the official (or the most common) language, and the UR. This location is classified into the following categories: Europe (EU) and America (AM). The language classification is as follows: English, Spanish, and Others. The UR is divided into two categories: above-average UR (HU) and below-average UR (LU). This table shows the factor change in the odds ratios, exp(βi,m|n)δ, with δ = 1. Columns 1–3 include the following as controls: age, age square/100, gender (male), being married, and being employed. Column 3 includes UK 1991. Standard errors are robust.
HU = high UR; LU = low UR; UR = unemployment rate.
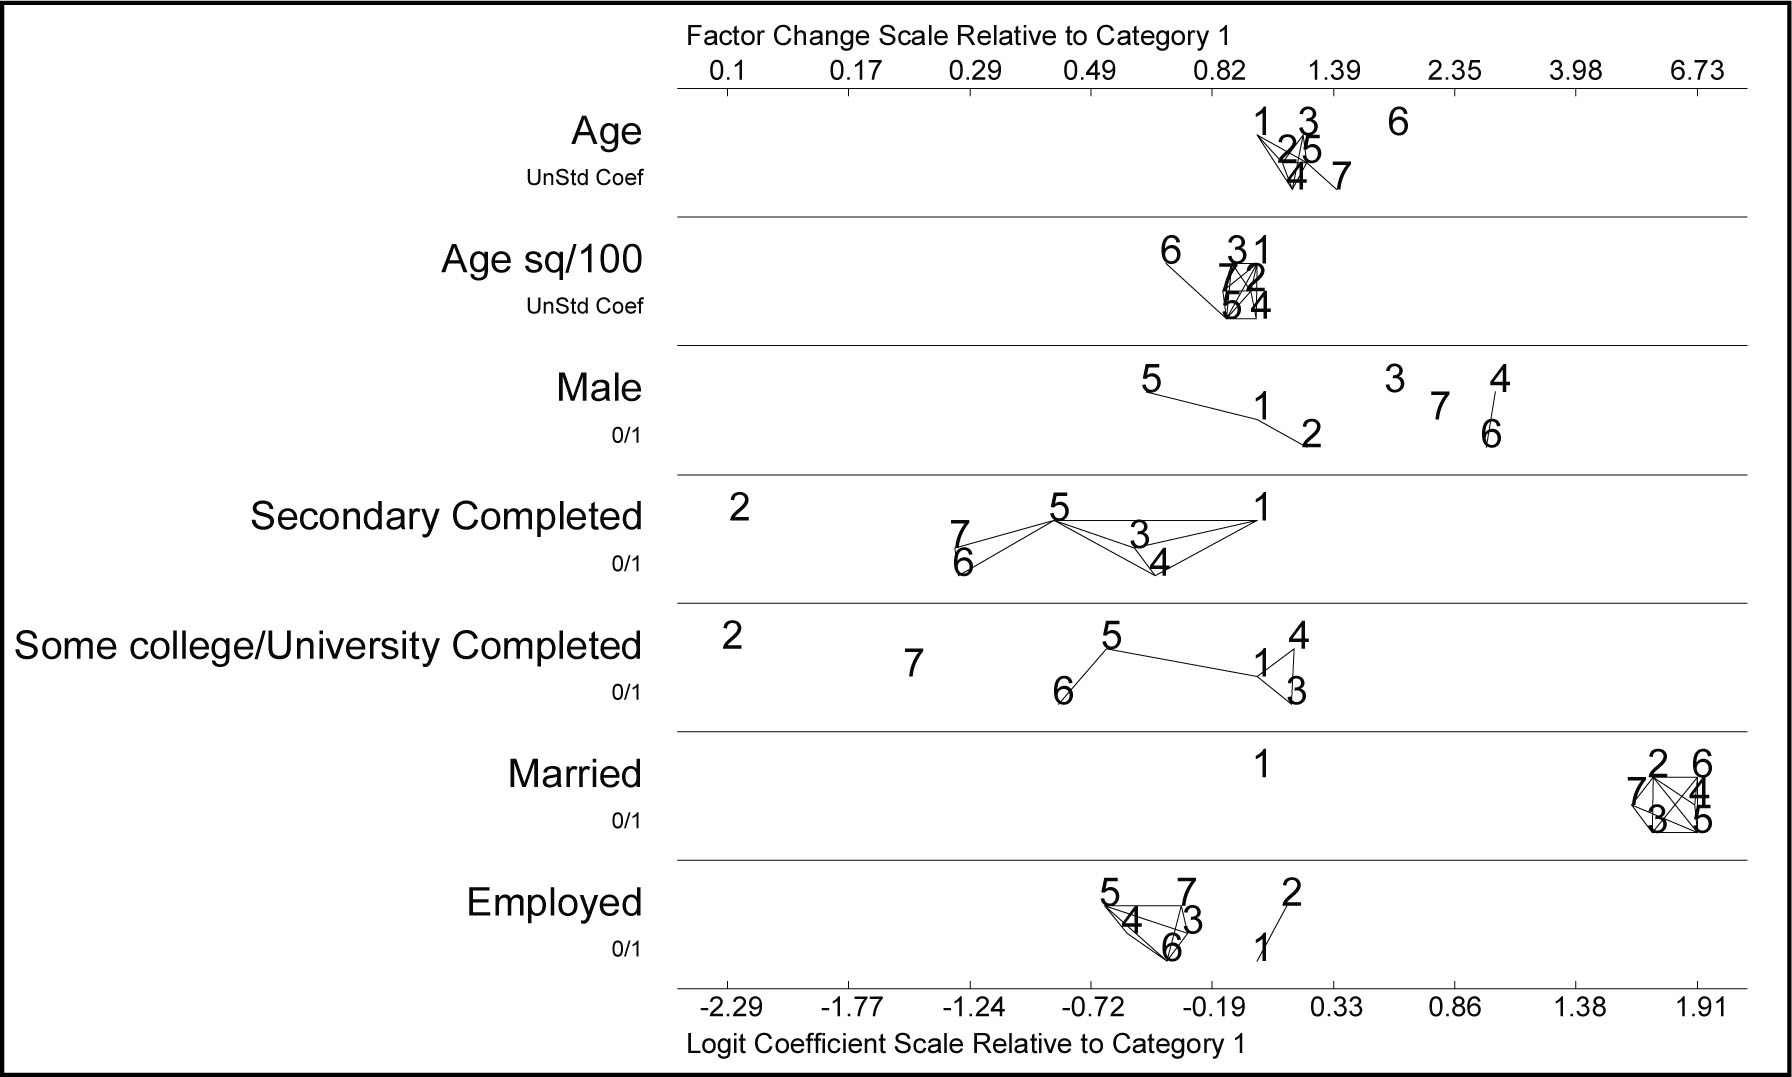
Figure A1
Notes: Dependent variables: languages, unemployment level, and continent. This corresponds to Column 3 of Table A4. The sample consists of Spanish emigrants in Argentina 2001, Austria 2001, Bolivia 2001, Brazil 2000, Chile 2002, Colombia 2005, Costa Rica 2000, Cuba 2002, El Salvador 2007, Greece 2001, Ireland 2002, Mexico 2000, Nicaragua 2005, Panama 2000, Peru 2007, Portugal 2001, United States 2000, UK 1991, and Venezuela 2001. The dependent variable is a combination of the location of the destination countries, the official language (or the most common language), and the UR. This location is classified into the following categories: Europe and America. The language classification is as follows: English, Spanish, and Others. The UR is divided into two categories: above-average UR and below-average UR. The numbers correspond to the following outcome categories: “1” indicates Europe, UR below the average, and English as the most common language; “2” indicates Europe, UR below the average, and Others as the most common language; “3” indicates America, UR below the average, and English as the most common language; “4” corresponds to America, UR below the average, and Spanish as the most common language; “5” means Europe, UR above the average, and Others as the most common language; “6” indicates America, UR above the average, and Others as the most common language; and “7” represents America, UR above the average, and Spanish as the most common language. The additive scale on the bottom axis measures the value of βi,m|n δ. The multiplicative scale on the top axis measures exp(βi,m|n)δ. Estimates are weighted. Standard errors are robust. The statistical significance is shown by drawing a line between the categories for which there is no significant coefficient at the 5% level. UR = unemployment rate. UnStd Coef means Unstandardized Coefficient and 0/1 means a dummy variable.