
Figure 1
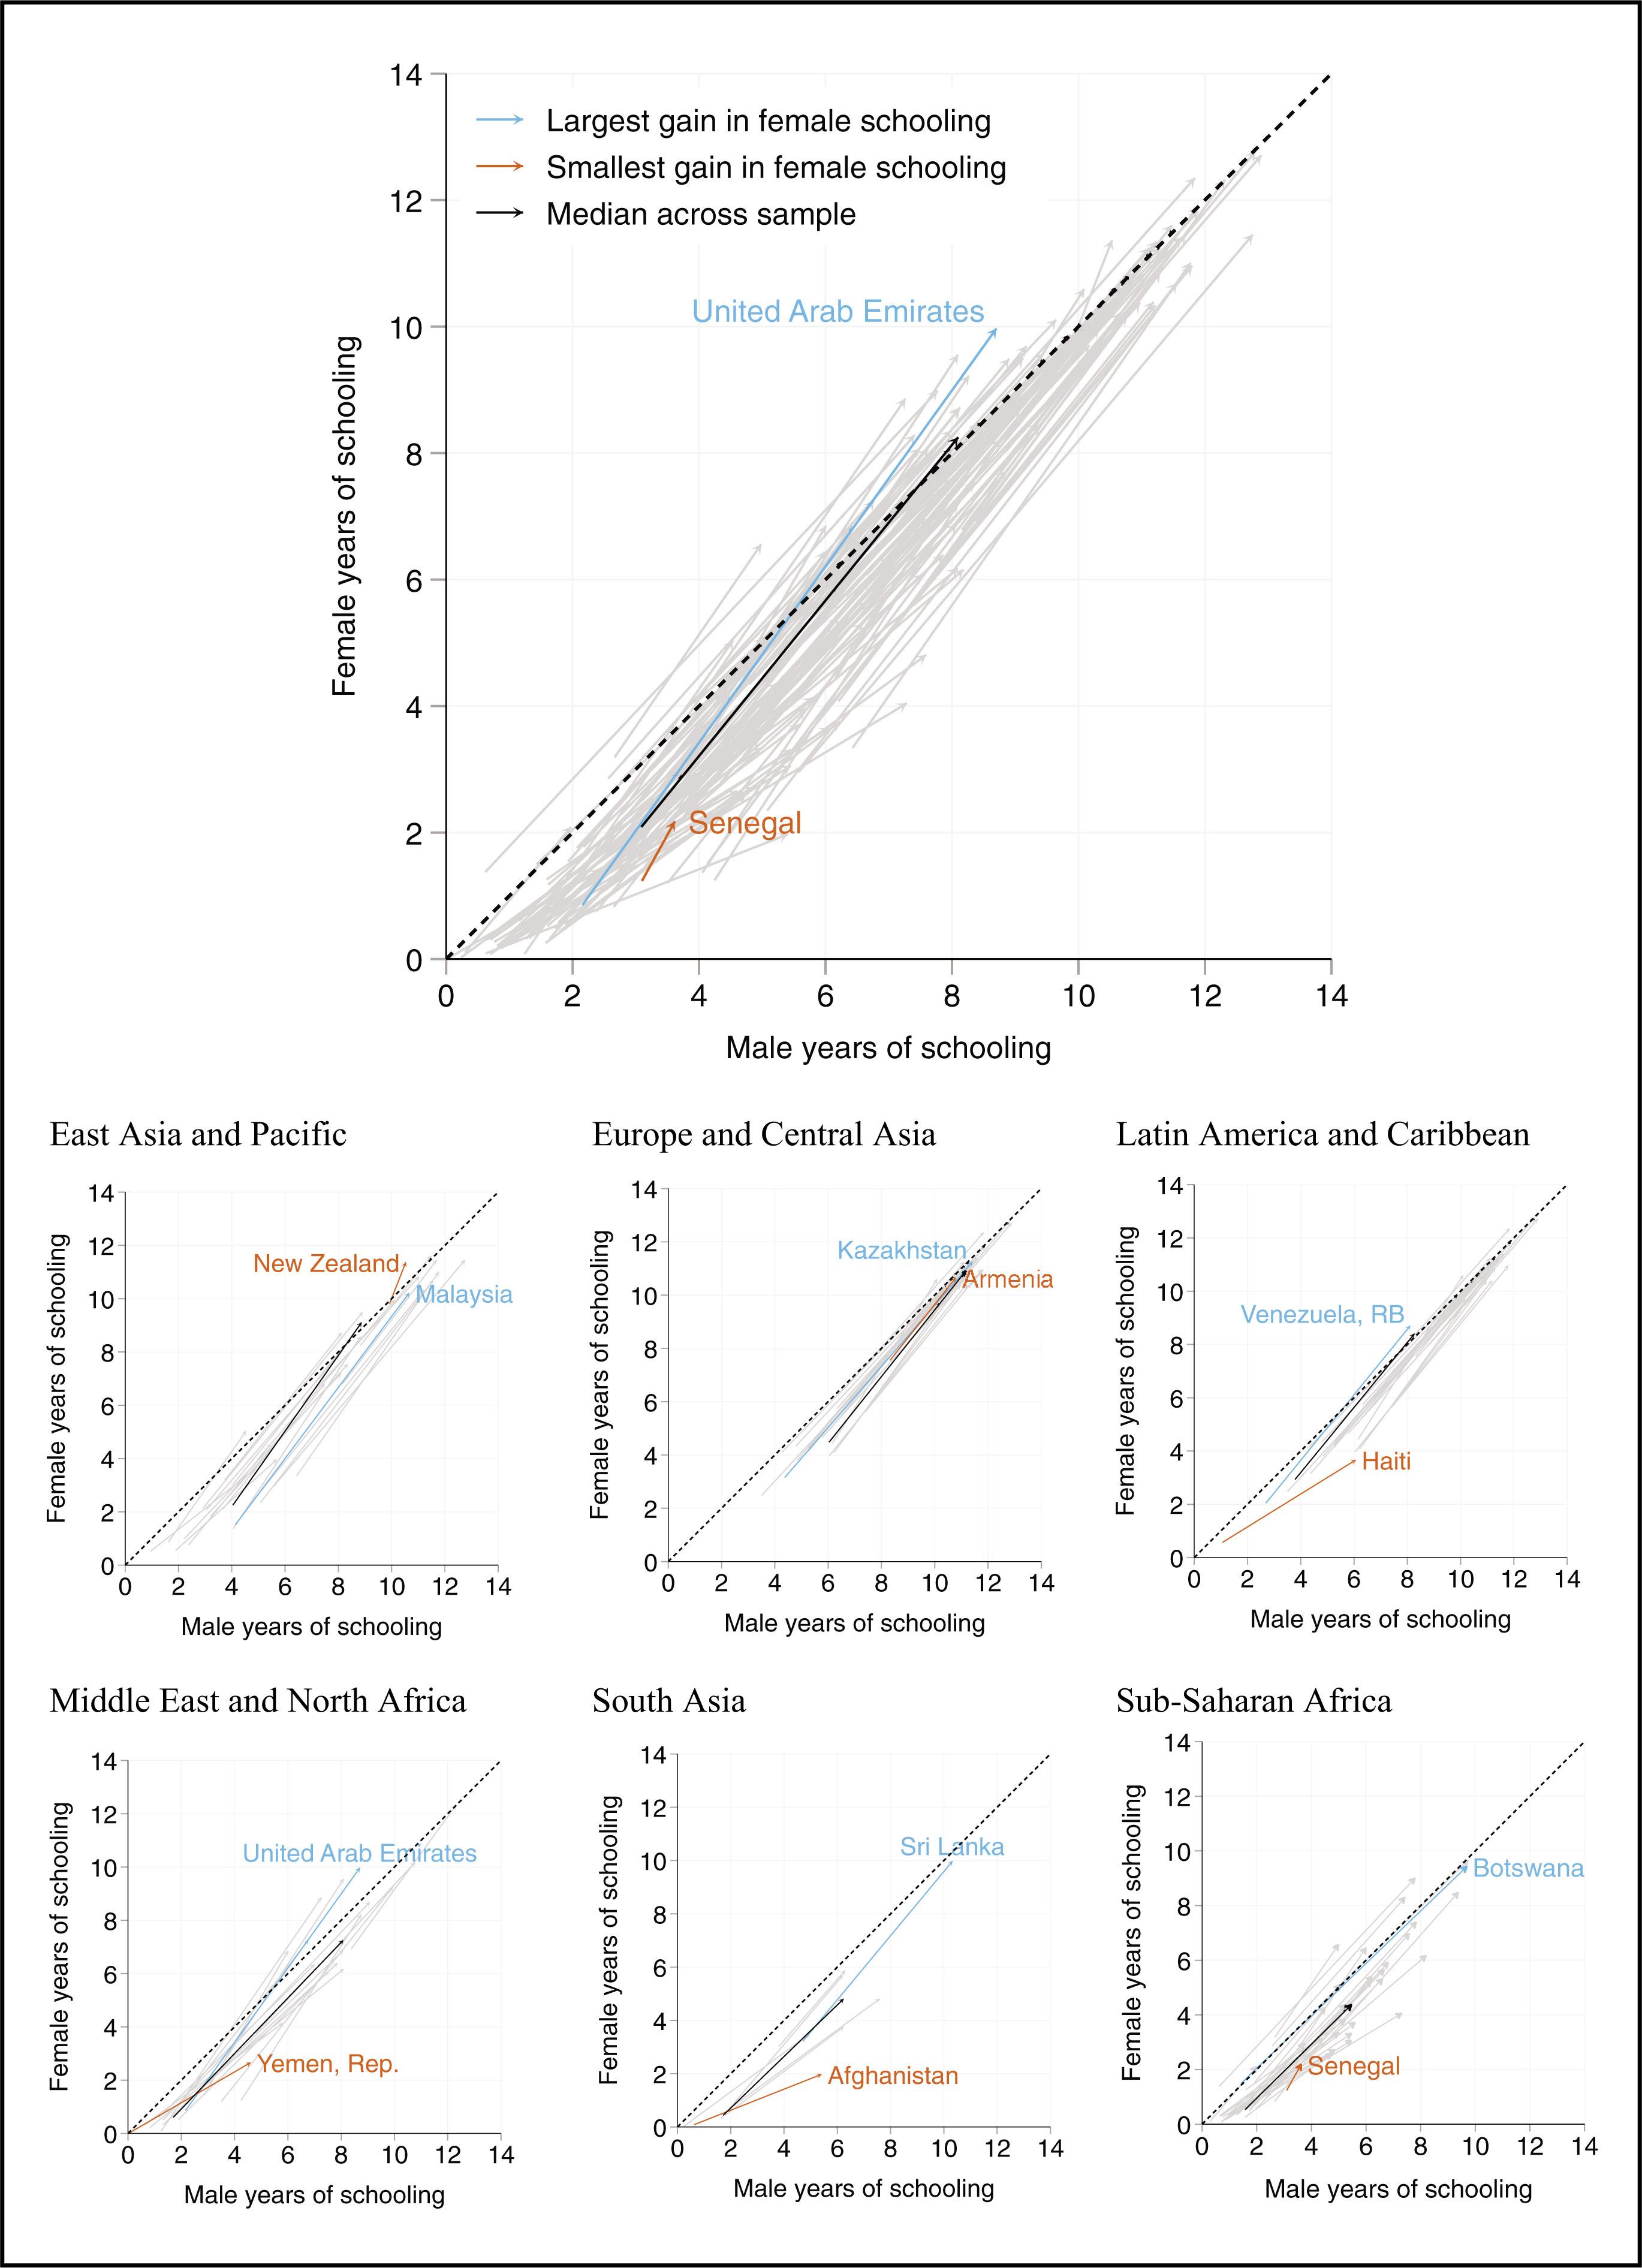
Figure 2
Figure 3
Figure 4
Figure 5
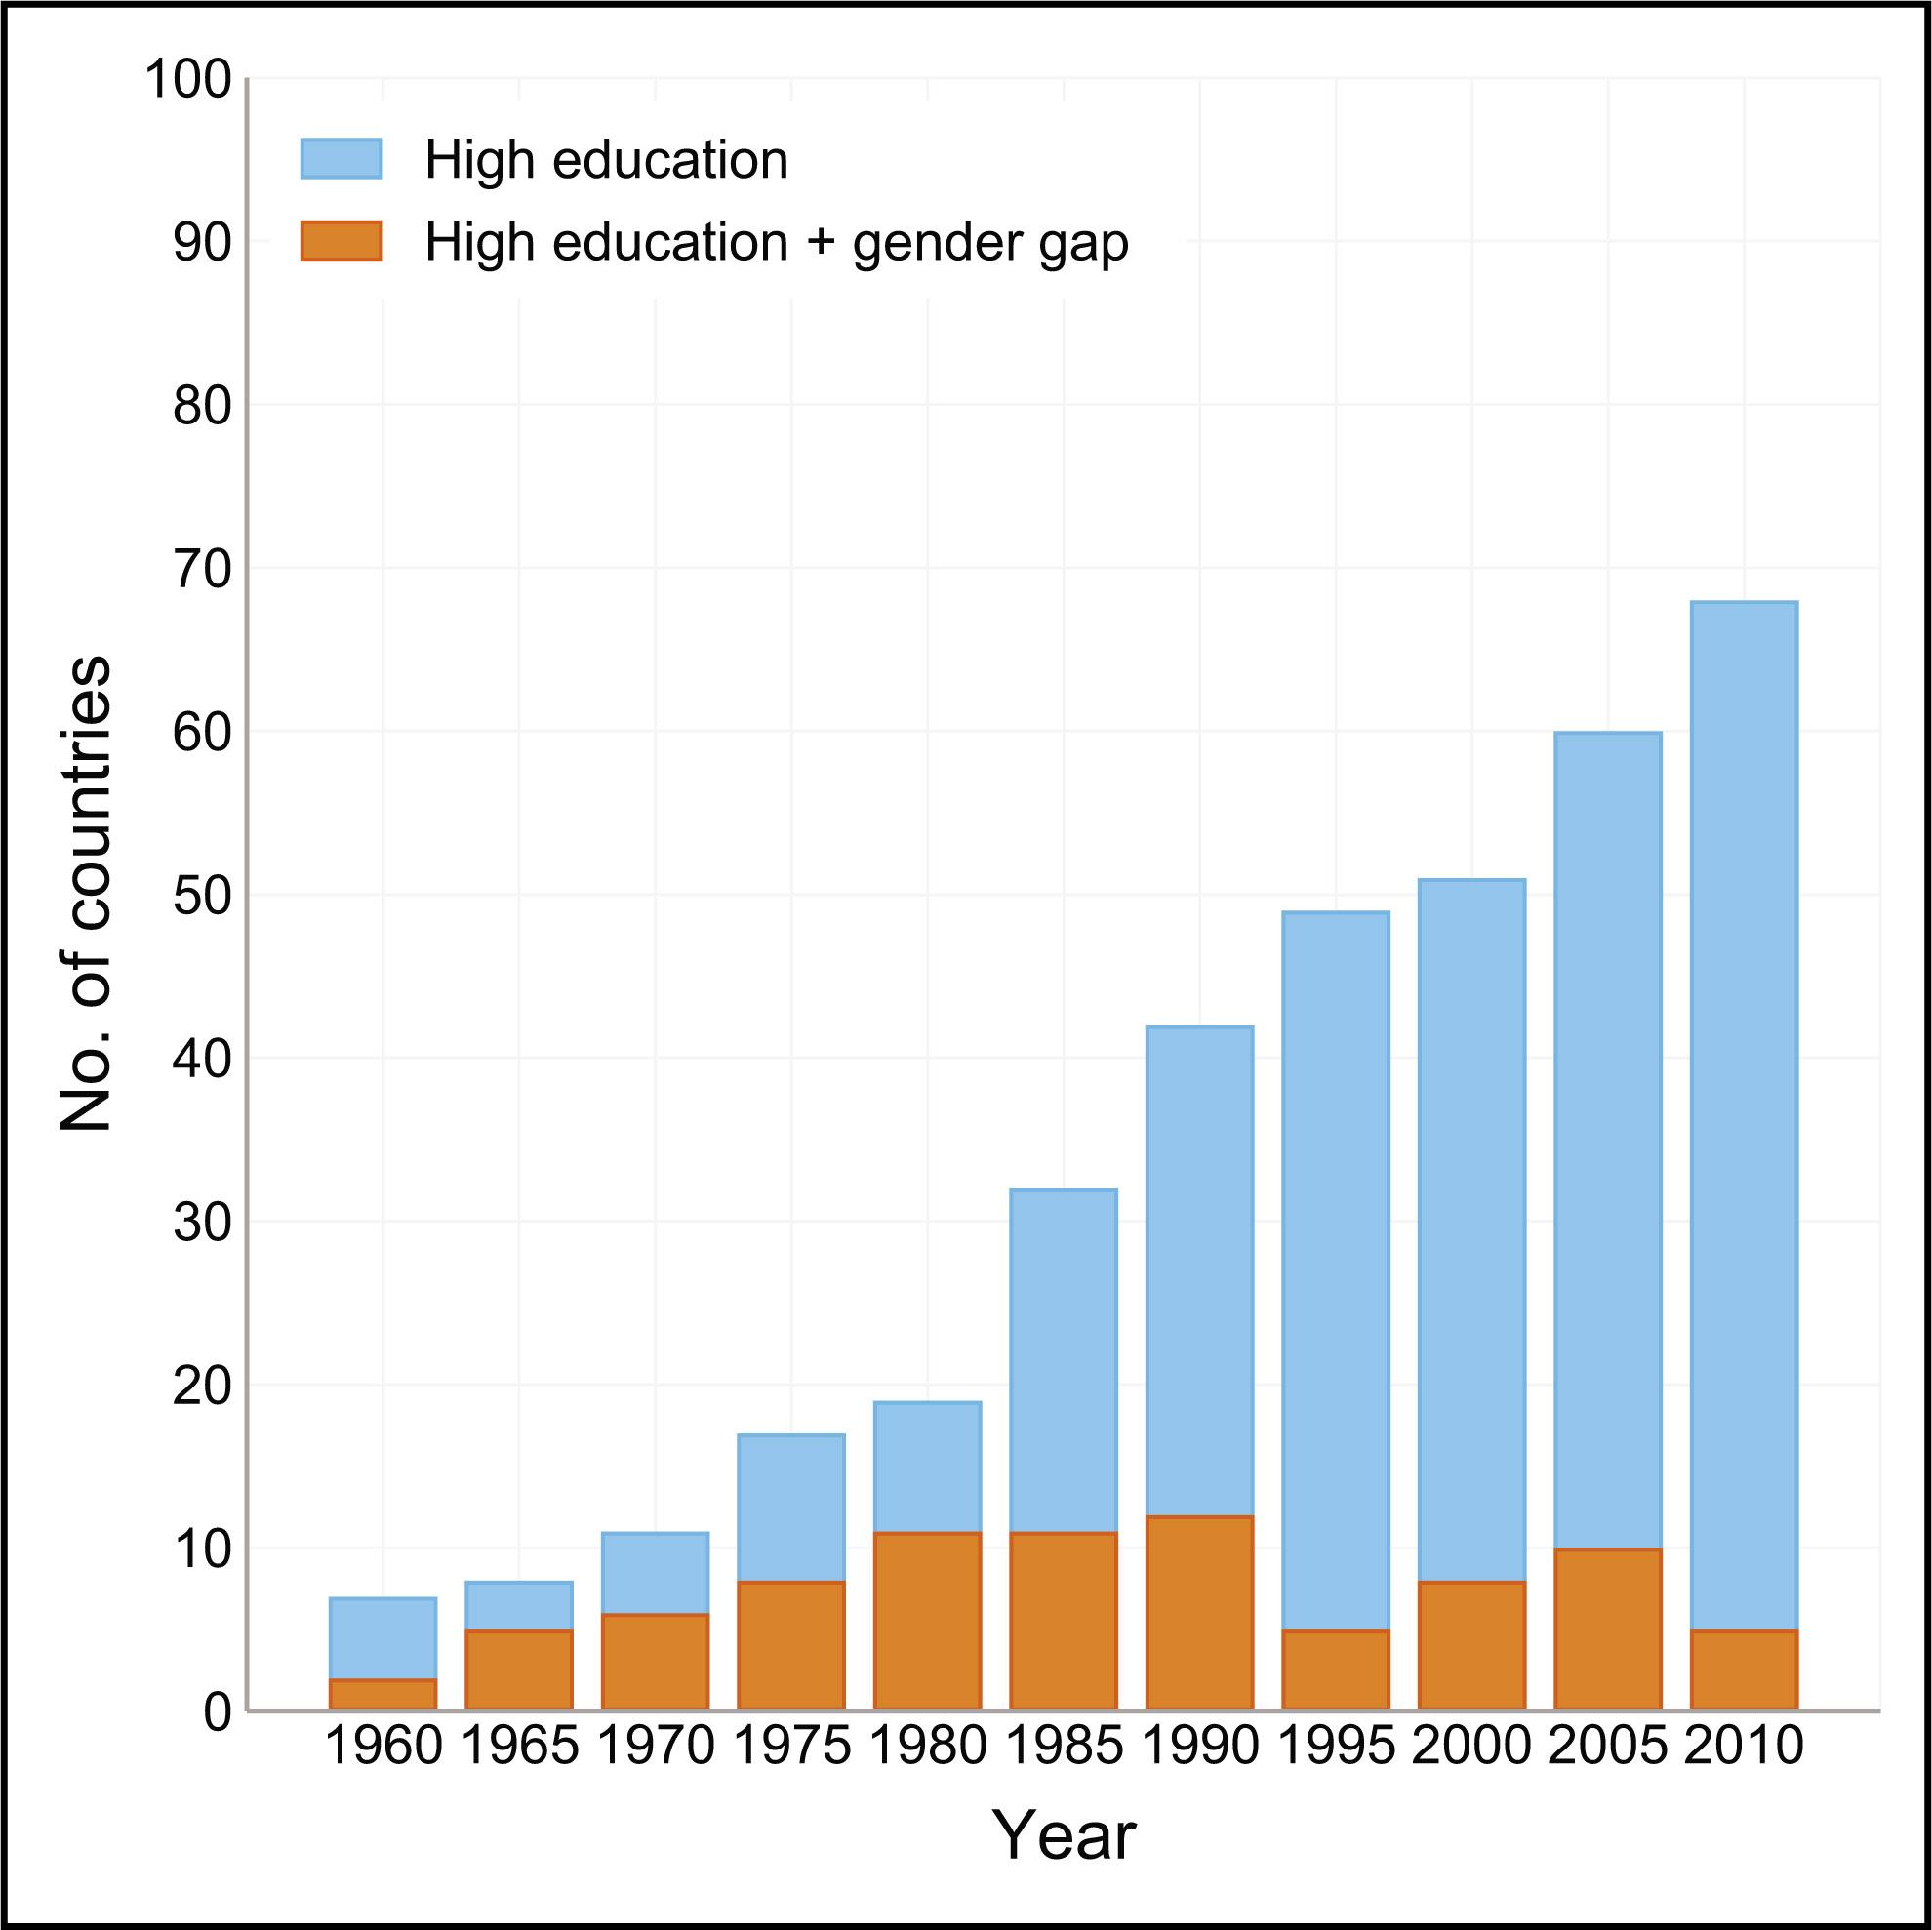
Figure 6
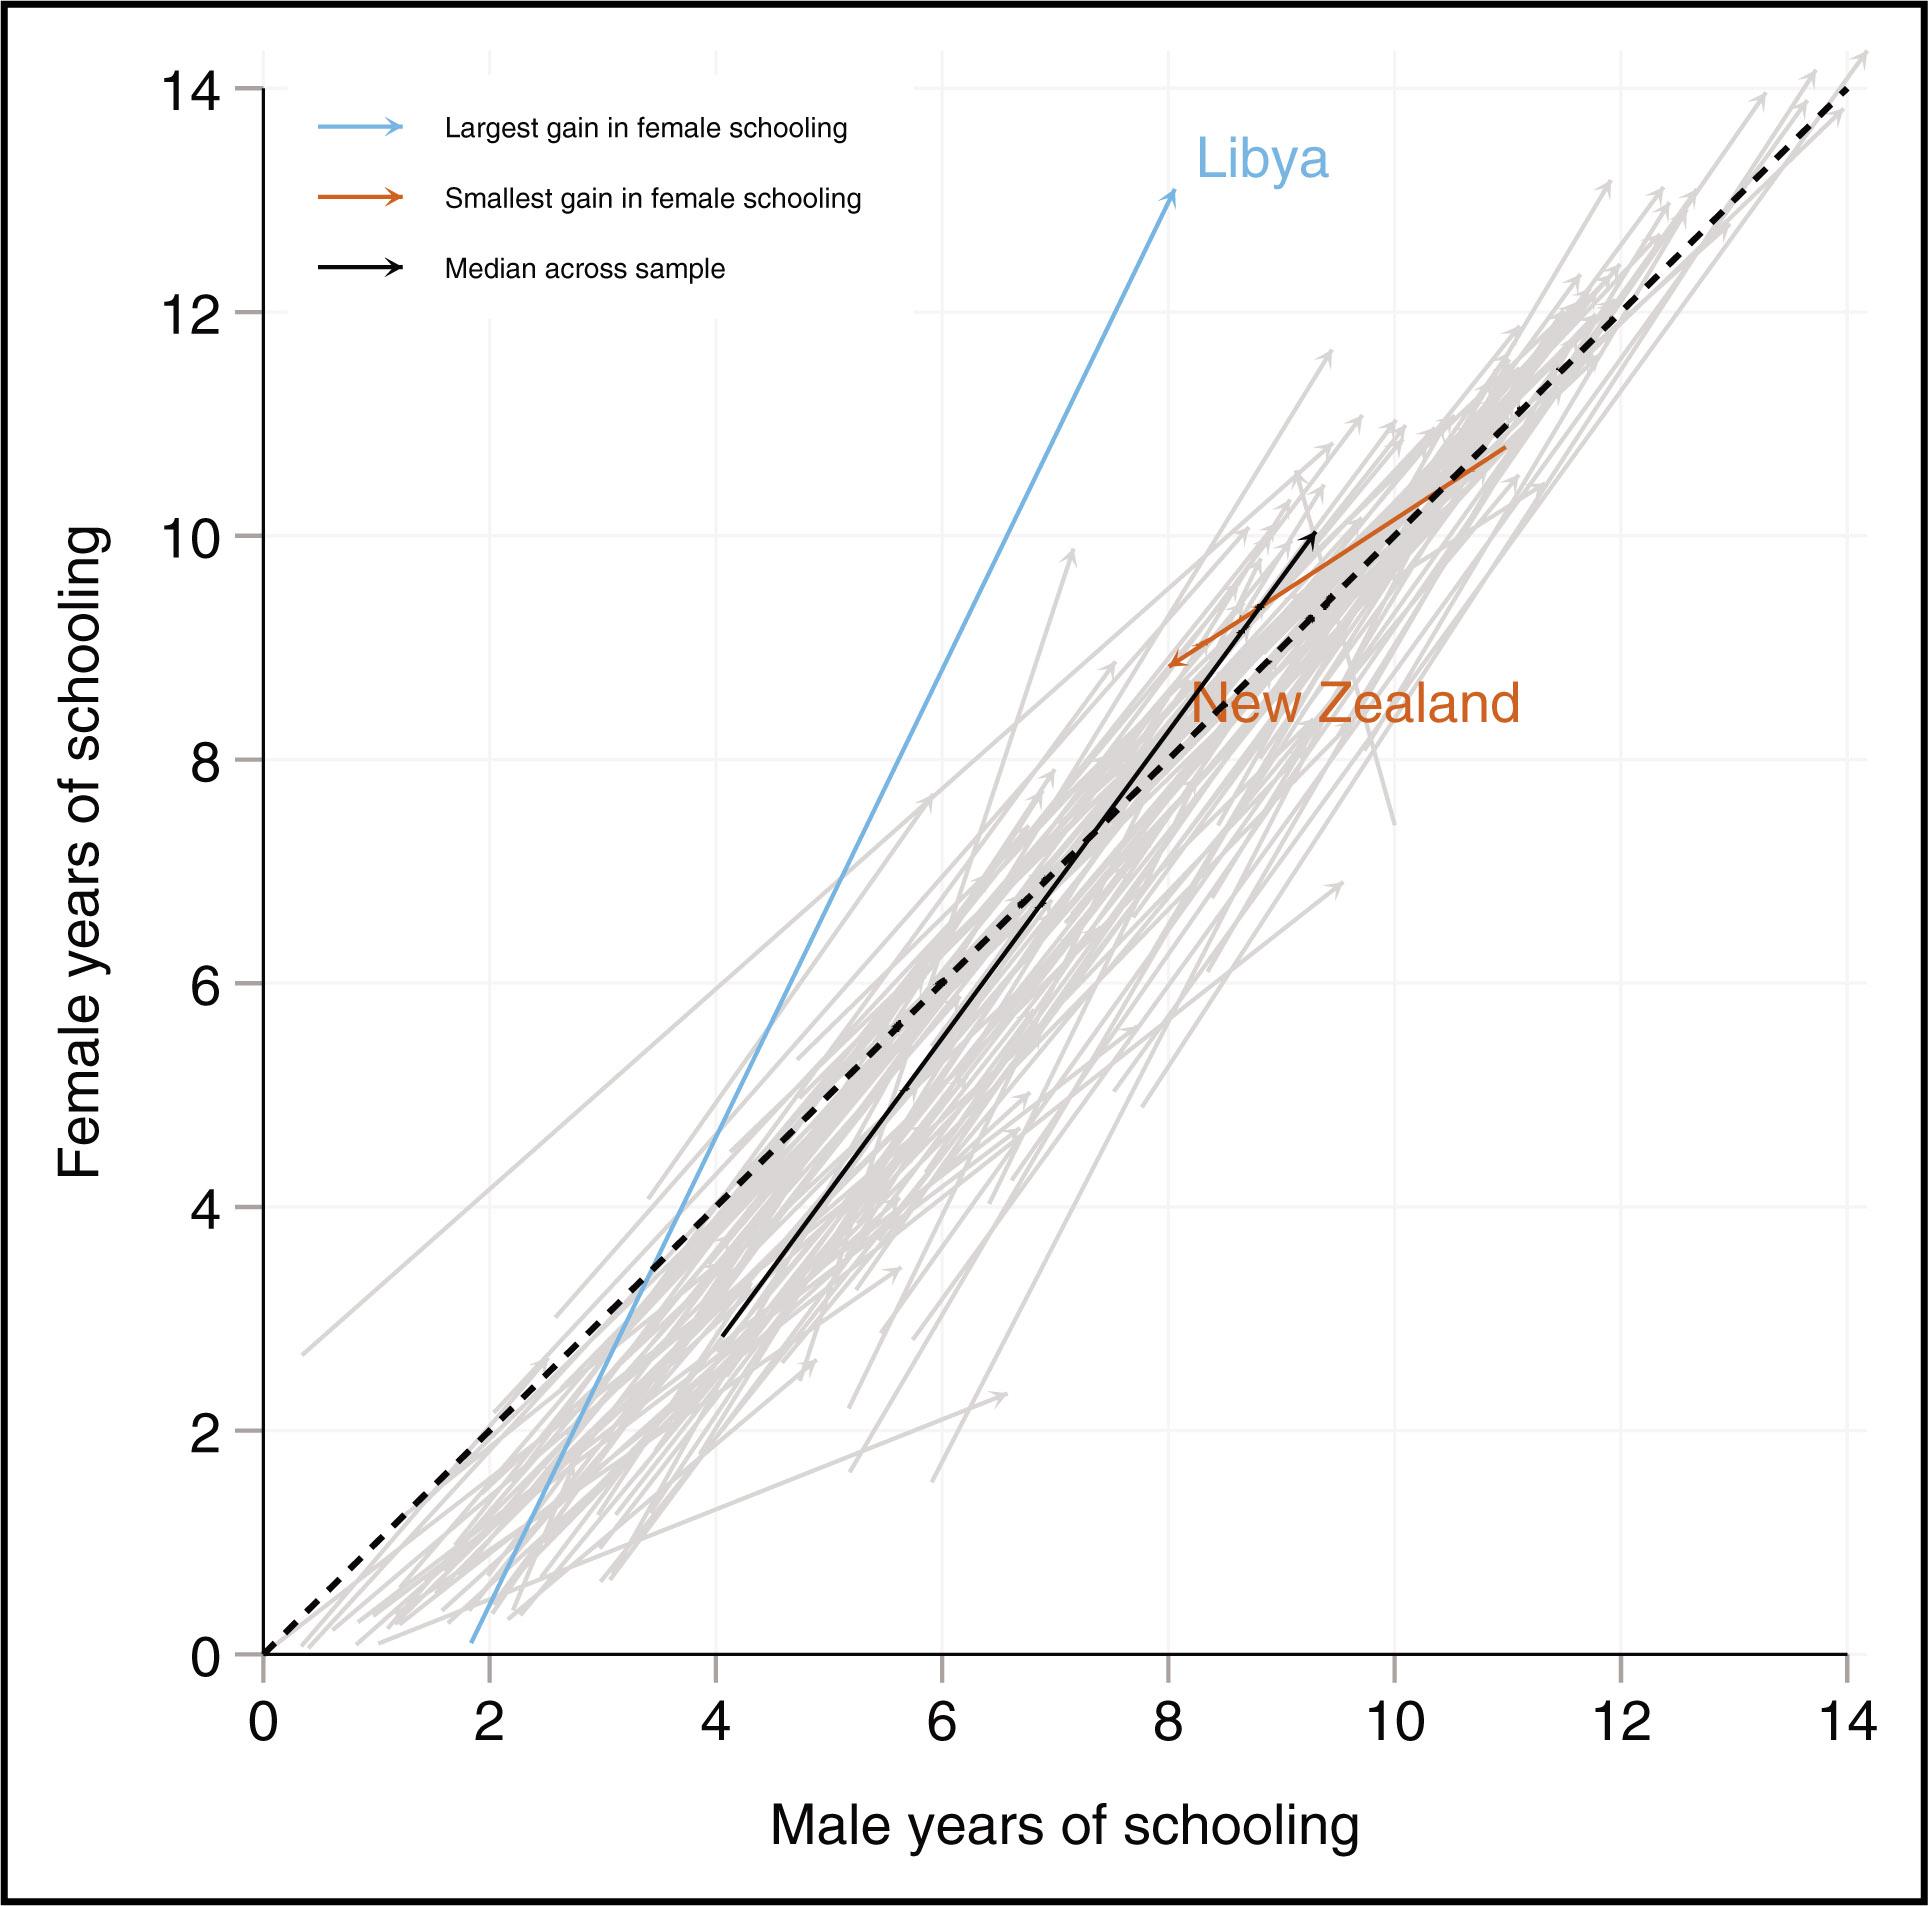
Figure 7
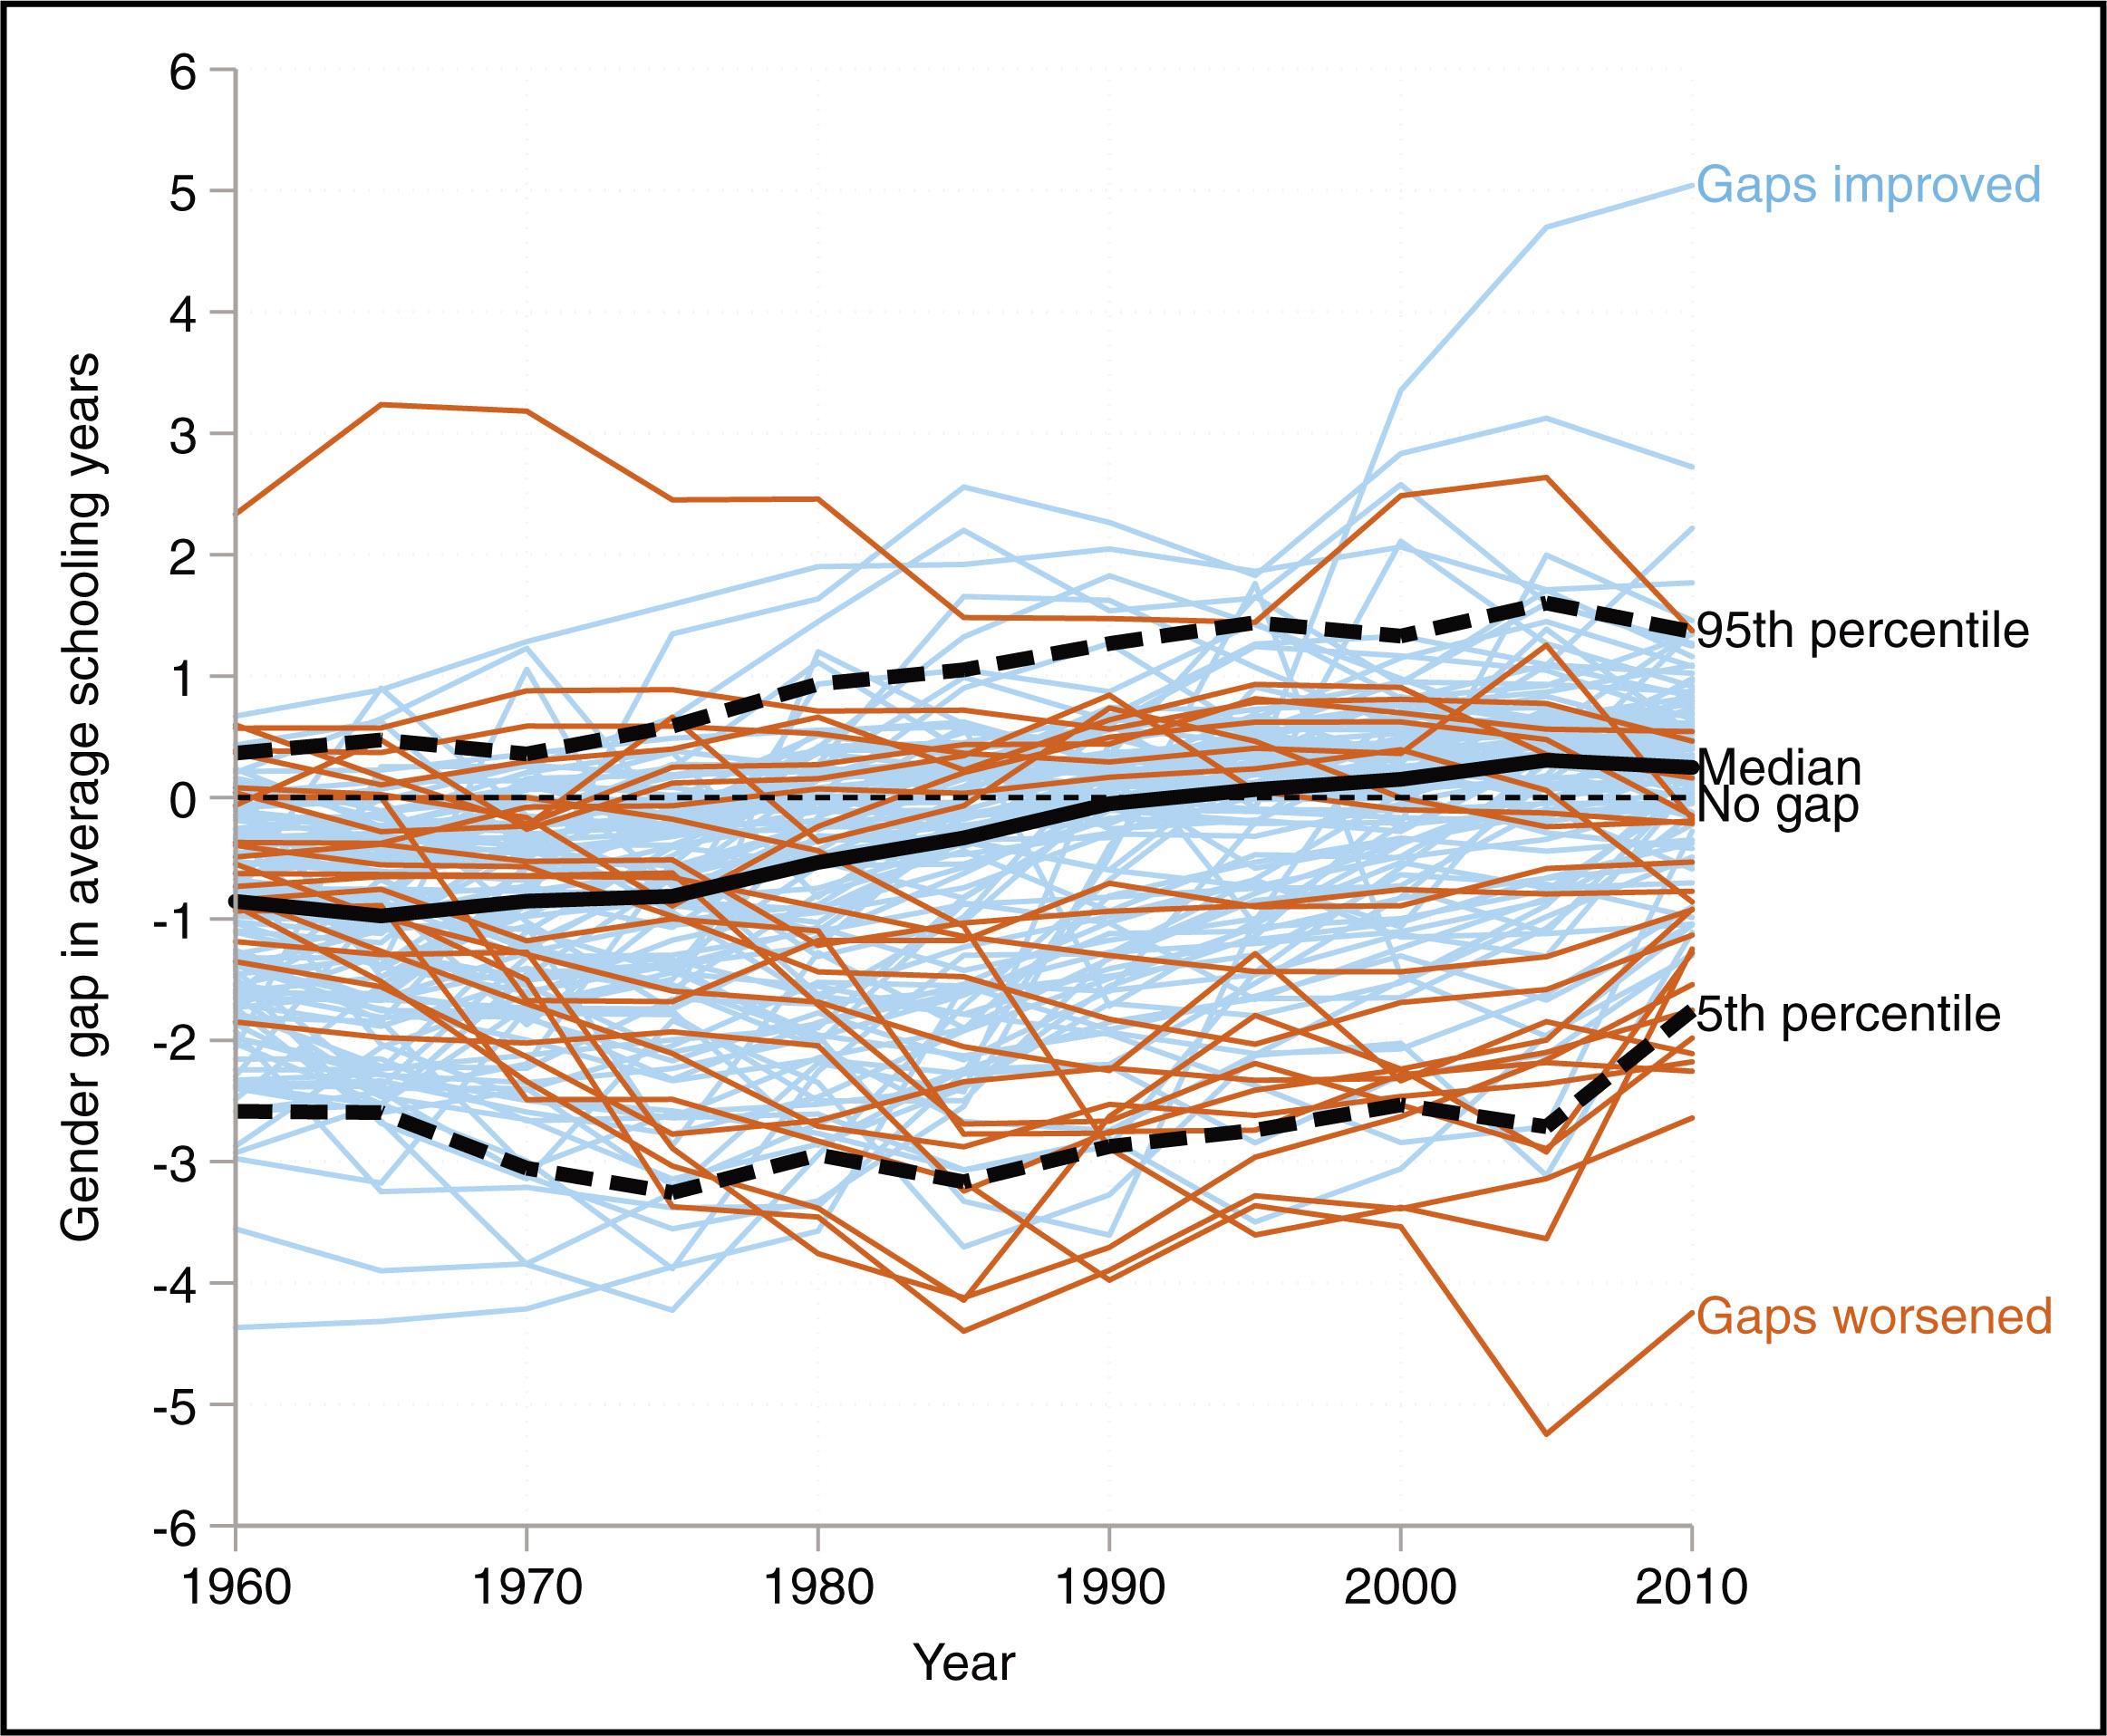
Figure 8
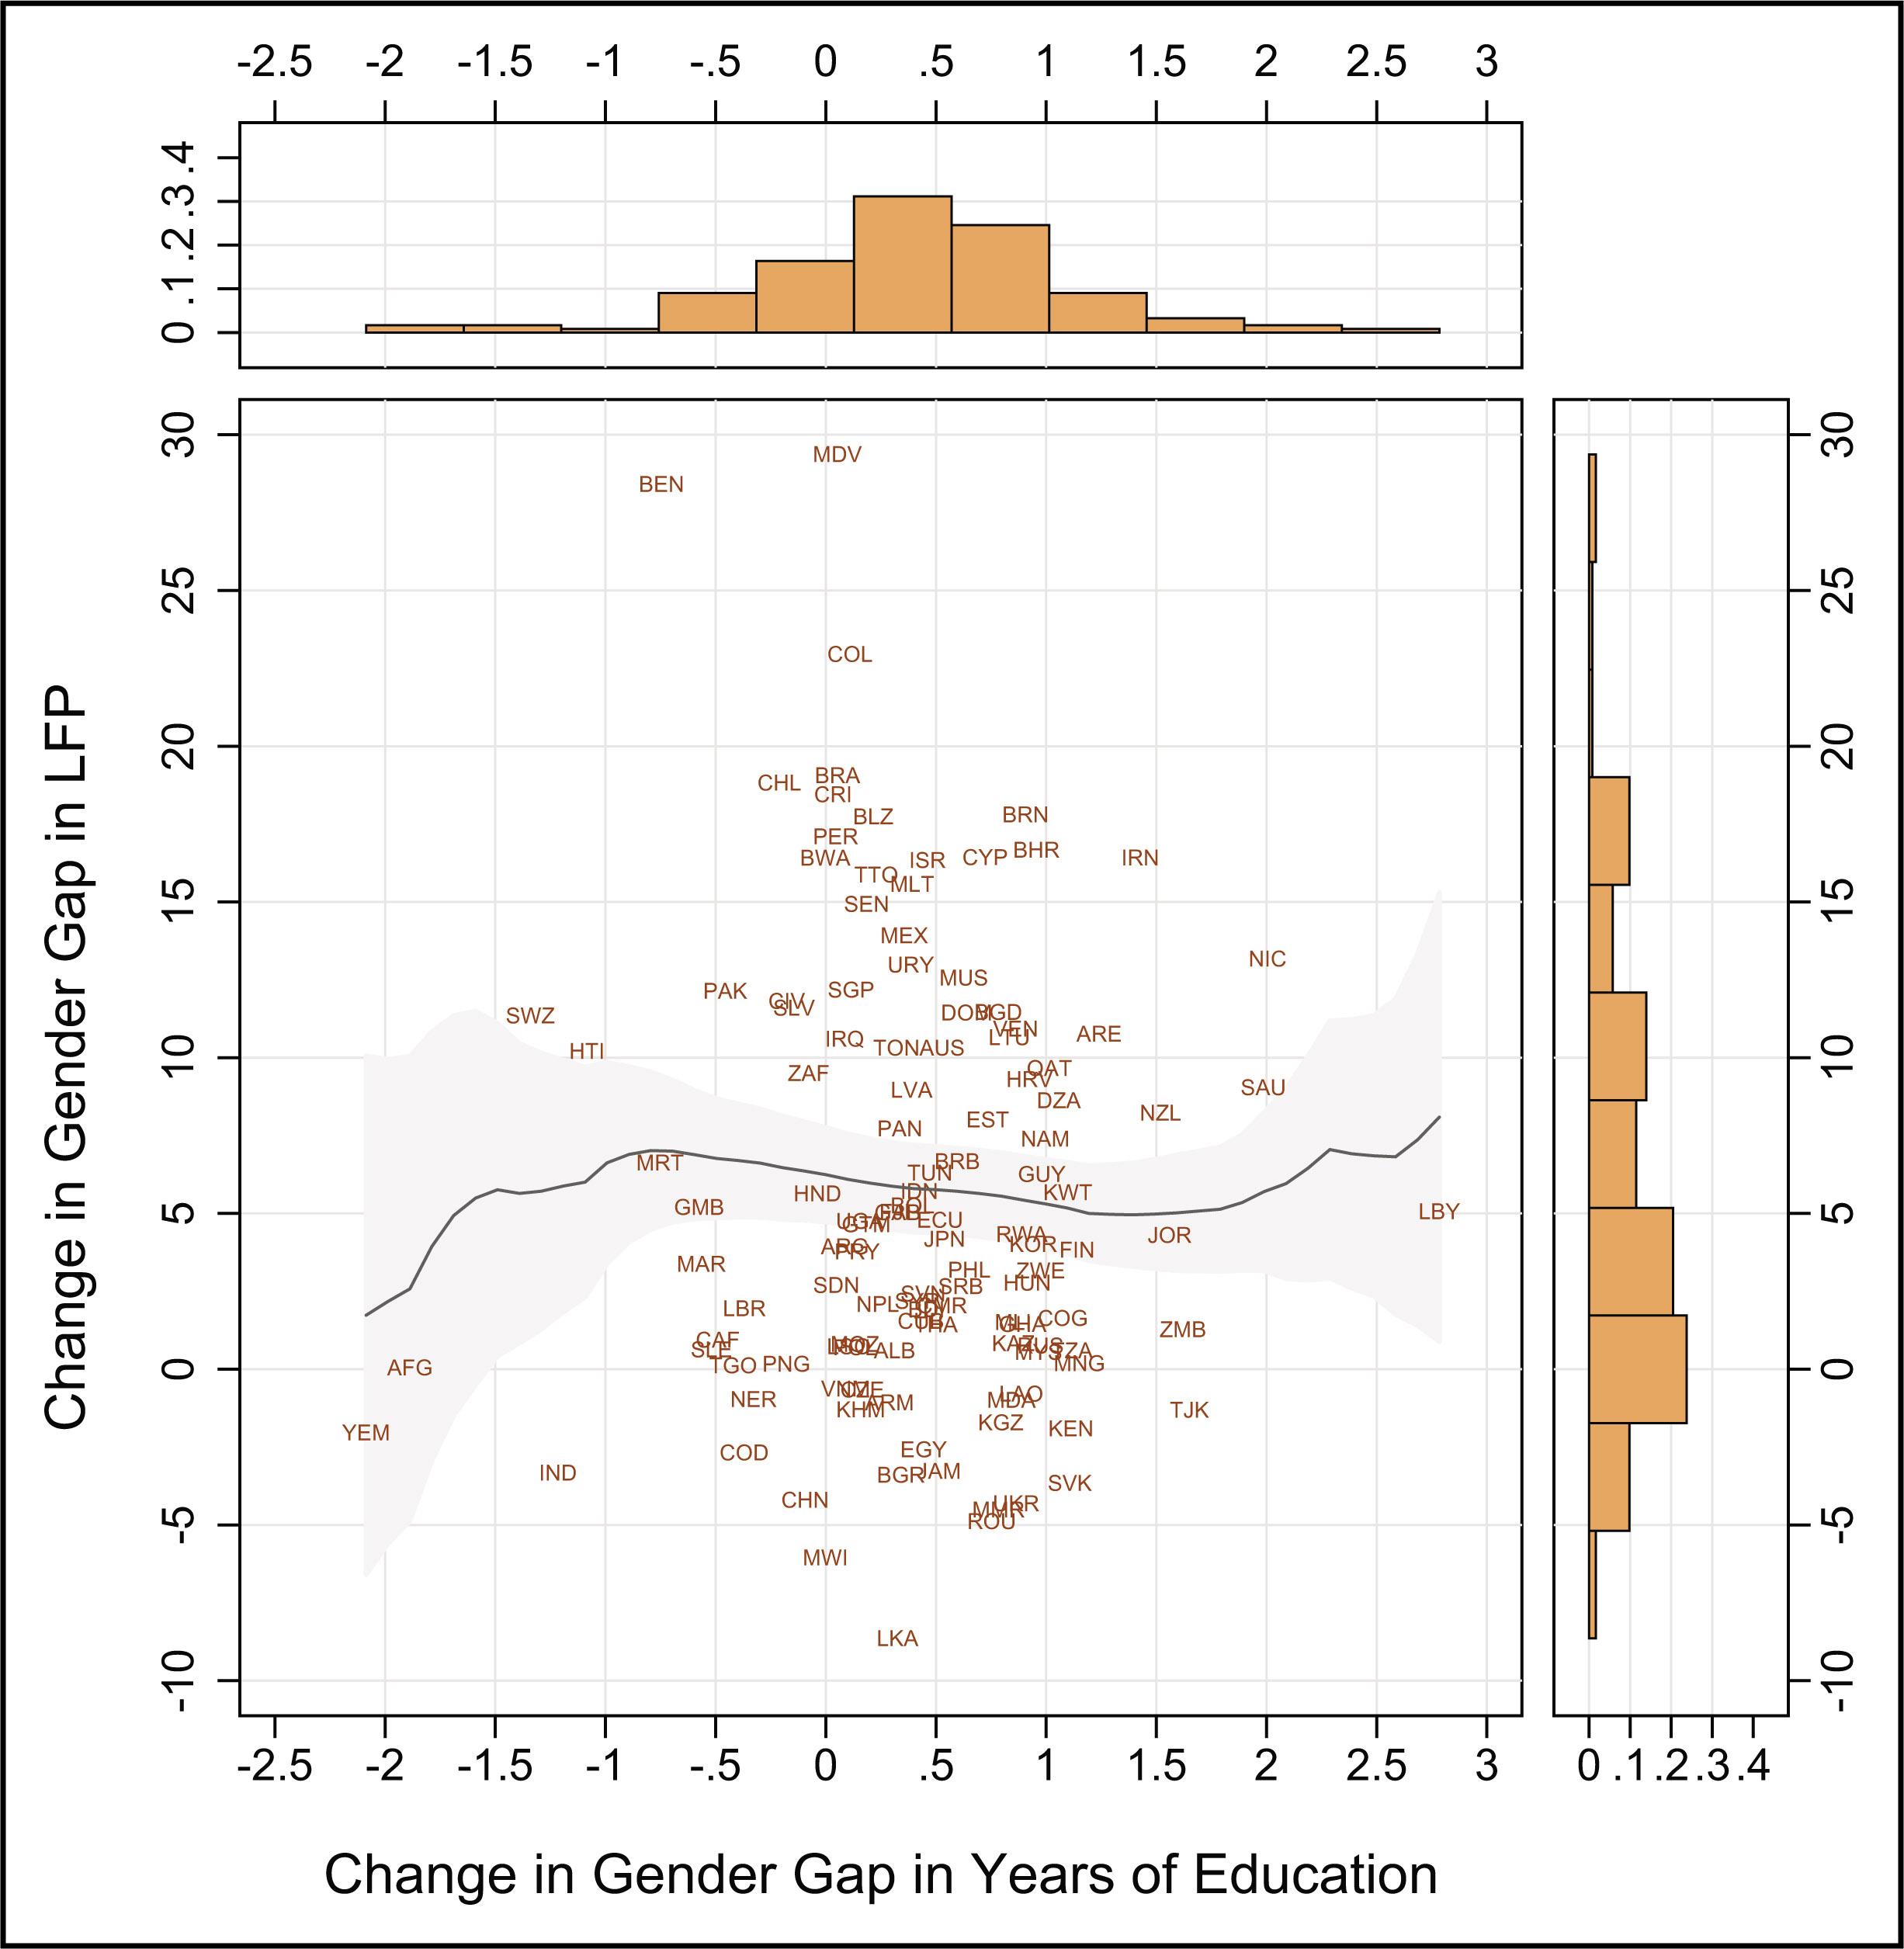
Figure A1
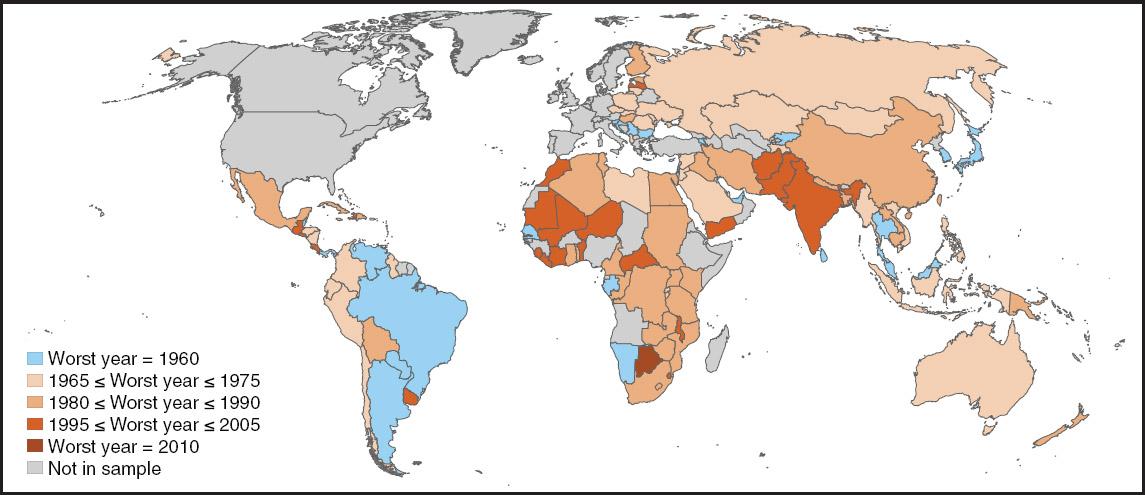
Figure A2
Figure A3
Figure A4
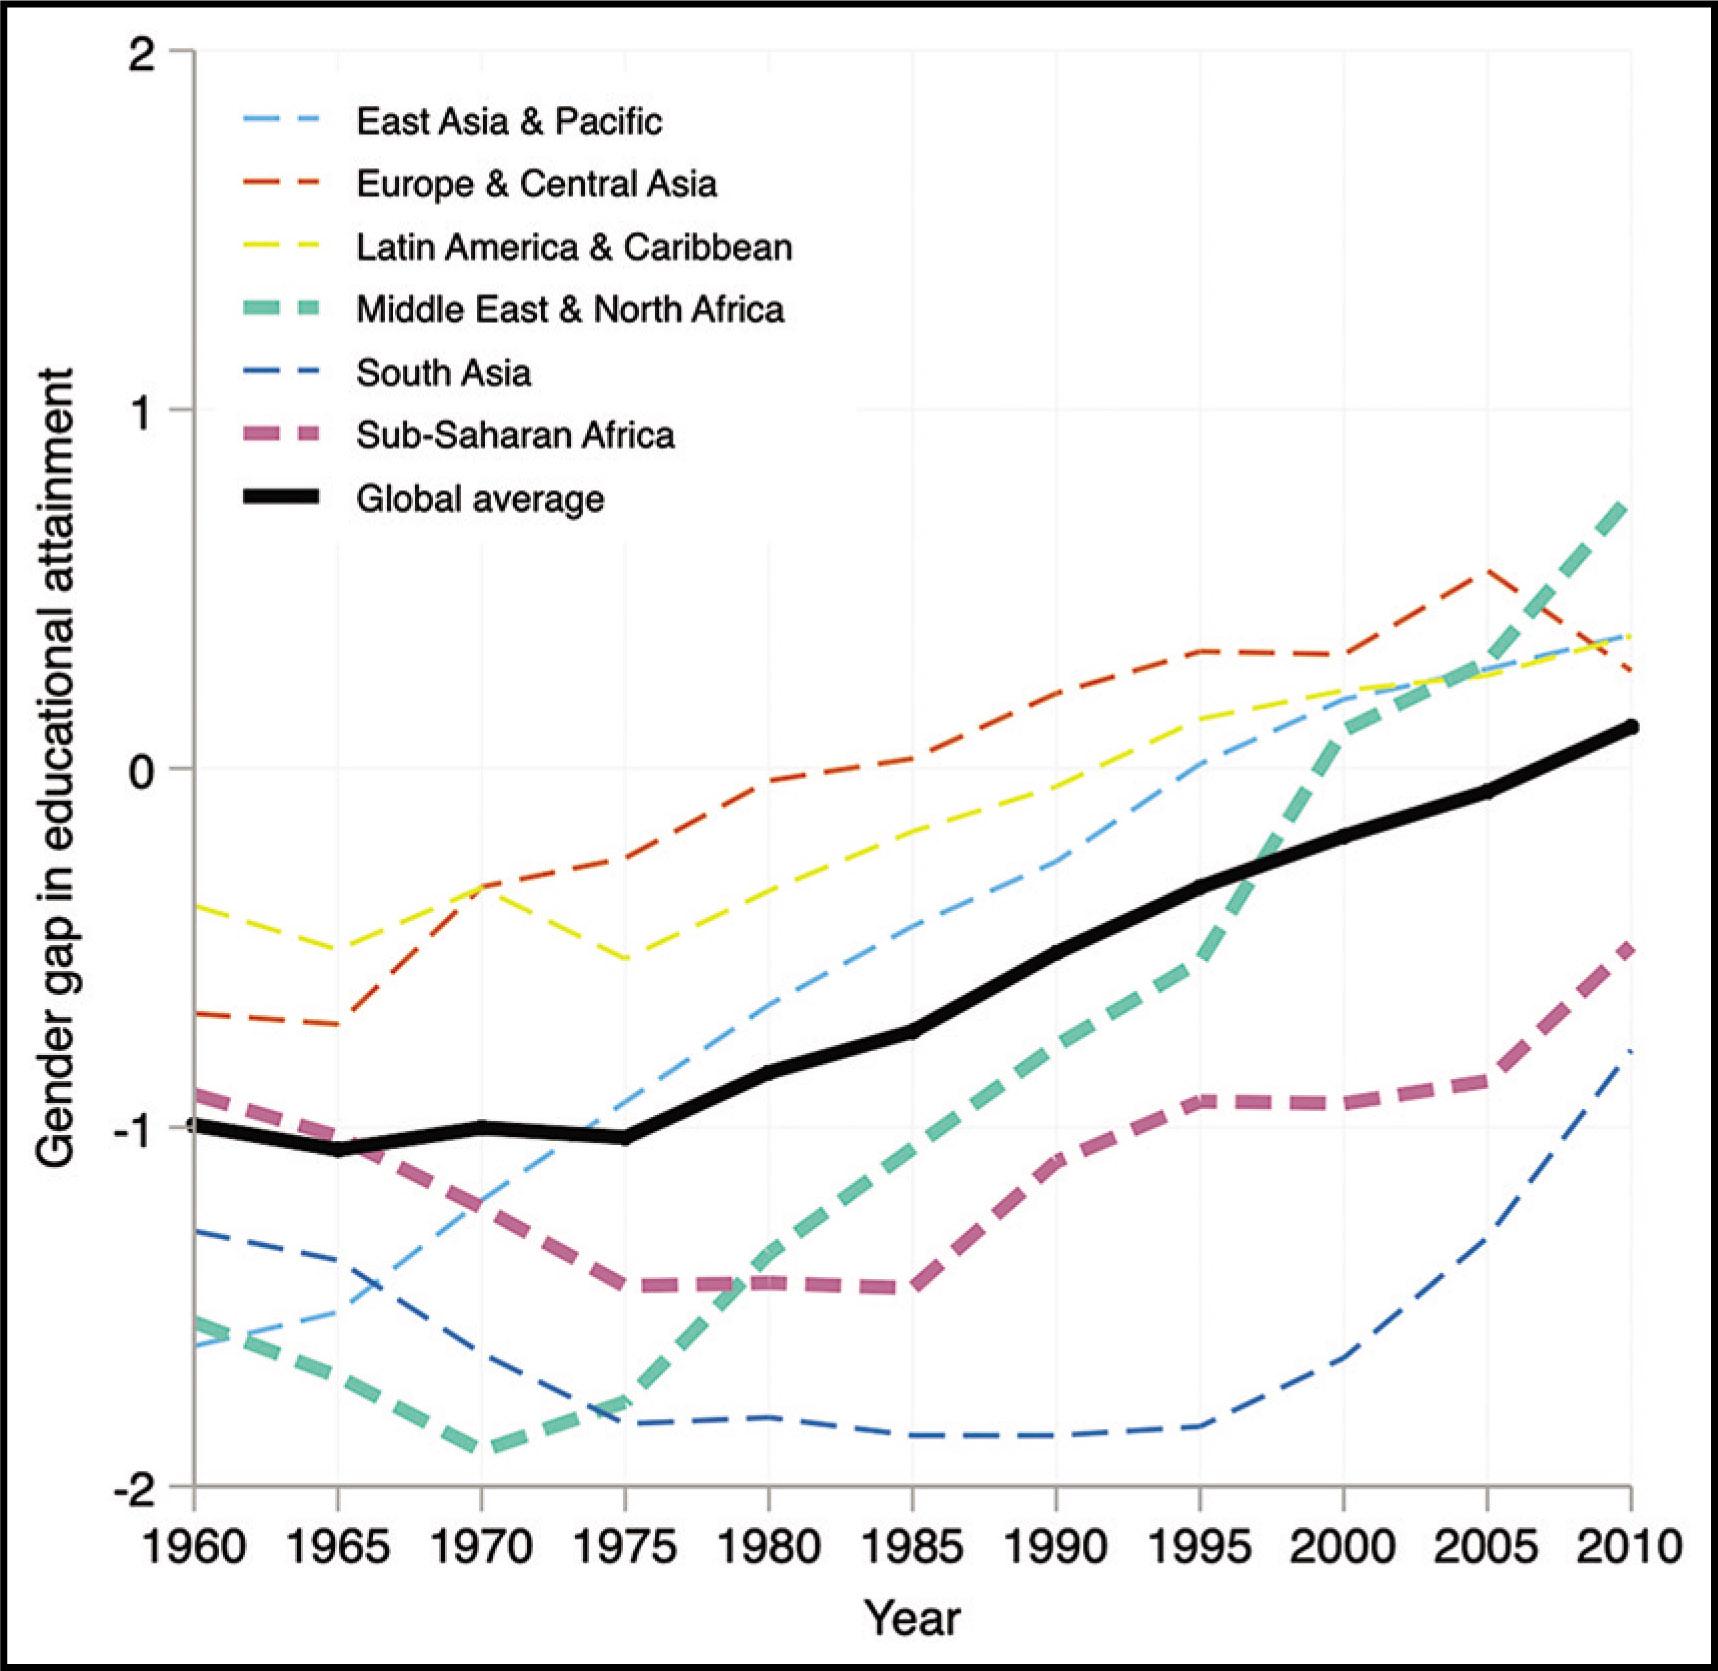
Change in Female Schooling Years_
| Region | Female schooling | Slope | ||
|---|---|---|---|---|
| 1960 | 2010 | Change | ||
| East Asia and Pacific | 3.04 | 8.67 | 5.63 | 1.22 |
| Europe and Central Asia | 5.07 | 11.08 | 6.00 | 1.18 |
| Latin America and Caribbean | 3.37 | 8.34 | 4.97 | 1.07 |
| Middle East and North Africa | 1.24 | 7.63 | 6.39 | 1.13 |
| South Asia | 1.09 | 5.08 | 3.99 | 0.86 |
| Sub-Saharan Africa | 1.05 | 4.90 | 3.85 | 0.95 |
Barro–Lee Sample Compared to UN Member State Sample_
| Barro–Lee Sample | UN Sample | Difference | |
|---|---|---|---|
| GDP per capita (Mean) | 20535 | 18453 | 2082 |
| GDP per capita (SE) | 1764 | 1432 | 2250 |
| Number of countries | 139 | 182 | |
| Literacy (Mean) | 86 | 85 | 1 |
| Literacy (SE) | 2 | 1 | 2 |
| Number of countries | 109 | 143 |
Top Three Countries for Male Schooling Years by Region_
| Region | Country | Male Schooling Years in 1960 | Gap in 1960 | Male Schooling Years in 2010 | Gap in 2010 |
|---|---|---|---|---|---|
| East Asia and Pacific | South Korea | 5.57 | −2.62 | 12.76 | −1.30 |
| Hong Kong | 6.43 | −3.09 | 11.77 | −0.77 | |
| Japan | 8.16 | −1.37 | 11.69 | −0.24 | |
| Europe and Central Asia | Czech Republic | 8.80 | −0.81 | 12.89 | −0.18 |
| Slovakia | 8.86 | −0.82 | 12.80 | −0.03 | |
| Hungary | 7.66 | −0.46 | 11.89 | −0.07 | |
| Latin America and Caribbean | Belize | 7.74 | −0.31 | 11.23 | 0.11 |
| Trinidad and Tobago | 5.84 | −0.39 | 10.64 | 0.00 | |
| Cuba | 3.94 | 0.11 | 10.32 | −0.29 | |
| Middle East and North Africa | Israel | 8.37 | −1.45 | 12.32 | 0.01 |
| Malta | 4.81 | −1.04 | 10.77 | −0.60 | |
| Jordan | 3.50 | −2.30 | 9.94 | −0.69 | |
| South Asia | Sri Lanka | 4.70 | −1.49 | 10.32 | −0.35 |
| India | 1.72 | −1.21 | 7.59 | −2.78 | |
| Maldives | 3.81 | −0.78 | 6.29 | −0.42 | |
| Sub-Saharan Africa | South Africa | 4.38 | 0.03 | 9.72 | −0.08 |
| Botswana | 1.43 | 0.06 | 9.68 | −0.26 | |
| Mauritius | 4.34 | −1.55 | 9.36 | −0.89 | |
Countries Where The Gender Gap Got Worse Before It Got Better_
| Country | Gap in 1960 | Worst Gap | Year of Worst Gap | Gap in 2010 |
|---|---|---|---|---|
| Brunei Darussalam | −2.69 | −2.71 | 1965 | −0.26 |
| Honduras | −0.31 | −0.36 | 1965 | 0.03 |
| Kazakhstan | −1.22 | −1.25 | 1965 | −0.17 |
| Philippines | −0.55 | −0.57 | 1965 | 0.59 |
| Singapore | −2.38 | −2.38 | 1965 | −0.88 |
| Myanmar | −0.75 | −0.86 | 1965 | 0.50 |
| Qatar | −1.18 | −1.43 | 1965 | 1.46 |
| Trinidad and Tobago | −0.39 | −0.43 | 1965 | −0.00 |
| Vietnam | −1.56 | −1.71 | 1965 | −0.68 |
| Guyana | −0.55 | −0.79 | 1965 | 0.96 |
| Barbados | −0.36 | −0.46 | 1965 | 0.51 |
| Bahrain | −0.92 | −1.36 | 1970 | 0.48 |
| Australia | −0.59 | −1.12 | 1970 | 0.12 |
| Jamaica | 0.15 | 0.05 | 1970 | 0.46 |
| Fiji | −1.00 | −1.18 | 1970 | −0.16 |
| Czech Republic | −0.81 | −1.59 | 1970 | −0.18 |
| Mongolia | −0.78 | −1.47 | 1970 | 0.59 |
| Slovakia | −0.82 | −1.43 | 1970 | −0.03 |
| Jordan | −2.30 | −2.66 | 1970 | −0.69 |
| Albania | −1.02 | −1.20 | 1970 | −0.47 |
| Saudi Arabia | −3.00 | −3.26 | 1970 | −0.54 |
| Russia | −1.02 | −1.42 | 1970 | −0.22 |
| Ukraine | −1.11 | −1.54 | 1970 | −0.04 |
| Indonesia | −1.23 | −1.53 | 1970 | −0.90 |
| Reunion | 0.29 | 0.12 | 1970 | 0.87 |
| Ecuador | −0.58 | −0.71 | 1970 | −0.04 |
| Poland | −0.59 | −0.62 | 1970 | −0.04 |
| Chile | −0.30 | −0.35 | 1970 | −0.26 |
| Mauritius | −1.55 | −1.99 | 1970 | −0.89 |
| Lithuania | −0.91 | −0.93 | 1975 | 0.02 |
| Libya | −1.16 | −2.65 | 1975 | 1.60 |
| Nicaragua | −1.11 | −2.54 | 1975 | 0.44 |
| Colombia | −0.26 | −0.35 | 1975 | −0.10 |
| Romania | −1.11 | −1.89 | 1975 | −0.60 |
| Peru | −1.26 | −1.47 | 1975 | −0.98 |
| Tajikistan | −1.71 | −1.96 | 1975 | 0.50 |
| Syria | −1.37 | −2.56 | 1975 | −1.45 |
| Rwanda | −0.95 | −1.27 | 1975 | −0.24 |
| Moldova | −1.03 | −1.12 | 1975 | −0.11 |
| Burundi | −0.61 | −1.23 | 1975 | −0.79 |
| Mexico | −0.48 | −0.82 | 1980 | −0.29 |
| China | −1.38 | −1.57 | 1980 | −0.81 |
| Iran | −0.81 | −1.92 | 1980 | −0.39 |
| South Africa | 0.03 | −0.55 | 1980 | −0.08 |
| Rep. of Congo | −1.41 | −2.36 | 1980 | −1.29 |
| New Zealand | −0.11 | −0.52 | 1980 | 0.83 |
| Bangladesh | −1.32 | −1.94 | 1980 | −0.52 |
| Tanzania | −1.83 | −2.43 | 1980 | −0.80 |
| Cameroon | −1.24 | −1.80 | 1980 | −1.00 |
| Estonia | −0.11 | −0.32 | 1980 | 0.51 |
| Dominican Republic | 0.03 | −0.65 | 1980 | 0.59 |
| Kenya | −1.39 | −2.16 | 1980 | −0.89 |
| Laos | −1.62 | −2.18 | 1980 | −0.92 |
| Bolivia | −1.44 | −2.02 | 1980 | −1.15 |
| Mozambique | −0.94 | −1.27 | 1980 | −1.00 |
| Malta | −1.04 | −1.22 | 1980 | −0.60 |
| Egypt | −0.99 | −2.44 | 1985 | −1.47 |
| Zimbabwe | −0.84 | −1.57 | 1985 | −0.44 |
| Uganda | −1.20 | −1.86 | 1985 | −0.94 |
| Cambodia | −1.34 | −2.22 | 1985 | −1.73 |
| Tunisia | −1.01 | −2.22 | 1985 | −1.20 |
| Papua New Guinea | −0.43 | −1.64 | 1985 | −1.29 |
| Cuba | 0.11 | −0.61 | 1985 | −0.29 |
| Algeria | −0.55 | −2.50 | 1985 | −0.66 |
| Sudan | −0.64 | −1.40 | 1985 | −1.06 |
| Ghana | −1.08 | −3.31 | 1985 | −2.03 |
| Iraq | −0.60 | −2.68 | 1985 | −1.92 |
| Zambia | −1.19 | −2.28 | 1985 | −0.61 |
| Dem. Rep. of Congo | −1.32 | −2.60 | 1985 | −2.15 |
| Finland | −0.16 | −0.92 | 1990 | −0.00 |
| Togo | −0.70 | −3.24 | 1990 | −3.24 |
| Hungary | −0.46 | −0.94 | 1990 | −0.07 |
| Nepal | −0.21 | −2.41 | 1990 | −1.46 |
| Uruguay | −0.04 | −0.98 | 1995 | 0.37 |
| Liberia | −0.75 | −2.88 | 2000 | −2.40 |
| Morocco | −0.30 | −1.84 | 2000 | −1.67 |
| Malawi | −0.87 | −1.64 | 2000 | −0.87 |
| Gambia | −0.34 | −1.57 | 2000 | −1.29 |
| Benin | −0.63 | −2.35 | 2000 | −2.15 |
| Niger | −0.62 | −1.21 | 2000 | −1.10 |
| Latvia | −0.45 | −0.60 | 2000 | −0.03 |
| Yemen | −0.03 | −2.33 | 2005 | −1.94 |
| Afghanistan | −0.54 | −3.62 | 2005 | −3.43 |
| Maldives | −0.78 | −0.83 | 2005 | −0.42 |
| Sierra Leone | −0.40 | −1.75 | 2005 | −1.65 |
| Central African Republic | −0.49 | −2.35 | 2005 | −2.13 |
| Pakistan | −1.35 | −2.62 | 2005 | −2.48 |
| Haiti | −0.49 | −2.50 | 2005 | −2.40 |
| Eswatini | −0.39 | −1.34 | 2005 | 0.06 |
| El Salvador | −0.40 | −0.98 | 2005 | −0.39 |
| Guatemala | −0.44 | −1.04 | 2005 | −1.00 |
| Mauritania | −0.33 | −1.97 | 2005 | −1.42 |
| Costa Rica | −0.10 | −0.15 | 2005 | 0.06 |
| Mali | −0.20 | −0.76 | 2005 | 0.11 |
| India | −1.21 | −3.05 | 2005 | −2.78 |
| Cote d’Ivoire | −0.83 | −2.08 | 2005 | −1.87 |
Ratio of Females to Males at Various Education Levels in 2010_
| Region | Ratio of females to males | ||
|---|---|---|---|
| No formal education | Complete primary | Complete secondary | |
| East Asia and Pacific | 1.89 | 0.99 | 0.93 |
| Europe and Central Asia | 2.13 | 0.99 | 0.94 |
| Latin America and Caribbean | 1.48 | 0.97 | 1.02 |
| Middle East and North Africa | 1.79 | 0.91 | 1.08 |
| South Asia | 1.84 | 0.73 | 0.88 |
| Sub-Saharan Africa | 1.52 | 0.86 | 0.77 |
Ratio of Females to Males at Various Education Levels in 2010 (25–29 Year Olds)_
| Region | Ratio of males to females | ||
|---|---|---|---|
| No formal Education | Complete Primary | Complete Secondary | |
| East Asia and Pacific | 1.27 | 1.03 | 1.03 |
| Europe and Central Asia | 0.84 | 1.00 | 1.06 |
| Latin America and Caribbean | 4.56 | 0.99 | 1.10 |
| Middle East and North Africa | 1.64 | 0.97 | 1.24 |
| South Asia | 1.80 | 0.78 | 0.93 |
| Sub-Saharan Africa | 3.06 | 0.90 | 0.79 |
Regression of Female Schooling and Gender Gap in Schooling on Key Variables_
| Female schooling | Female–Male gap | |
|---|---|---|
| Male years of schooling | 1.121*** (0.028) | 0.121*** (0.028) |
| Log GDP per capita (PPP-adjusted) | 1.985*** (0.155) | 0.428*** (0.066) |
| Poverty index | −0.104*** (0.010) | −0.016*** (0.005) |
| Life expectancy at birth | 0.298*** (0.024) | 0.052*** (0.013) |
| Infant mortality index | −0.126*** (0.010) | −0.025*** (0.005) |
| Corruption index | 0.107*** (0.011) | 0.019*** (0.005) |
Schooling Characteristics in the Year of Widest Gender Gap for Countries Where Gender Gap Got Worse Before It Got Better_
| 25th Percentile | 50th Percentile | 75th Percentile | |
|---|---|---|---|
| Female schooling (15+) | 2.07 | 3.20 | 4.93 |
| Male schooling (15+) | 4.12 | 4.93 | 6.40 |
| Female schooling (20–24) | 3.27 | 4.83 | 7.09 |
| Male schooling (20–24) | 5.59 | 6.74 | 8.62 |