
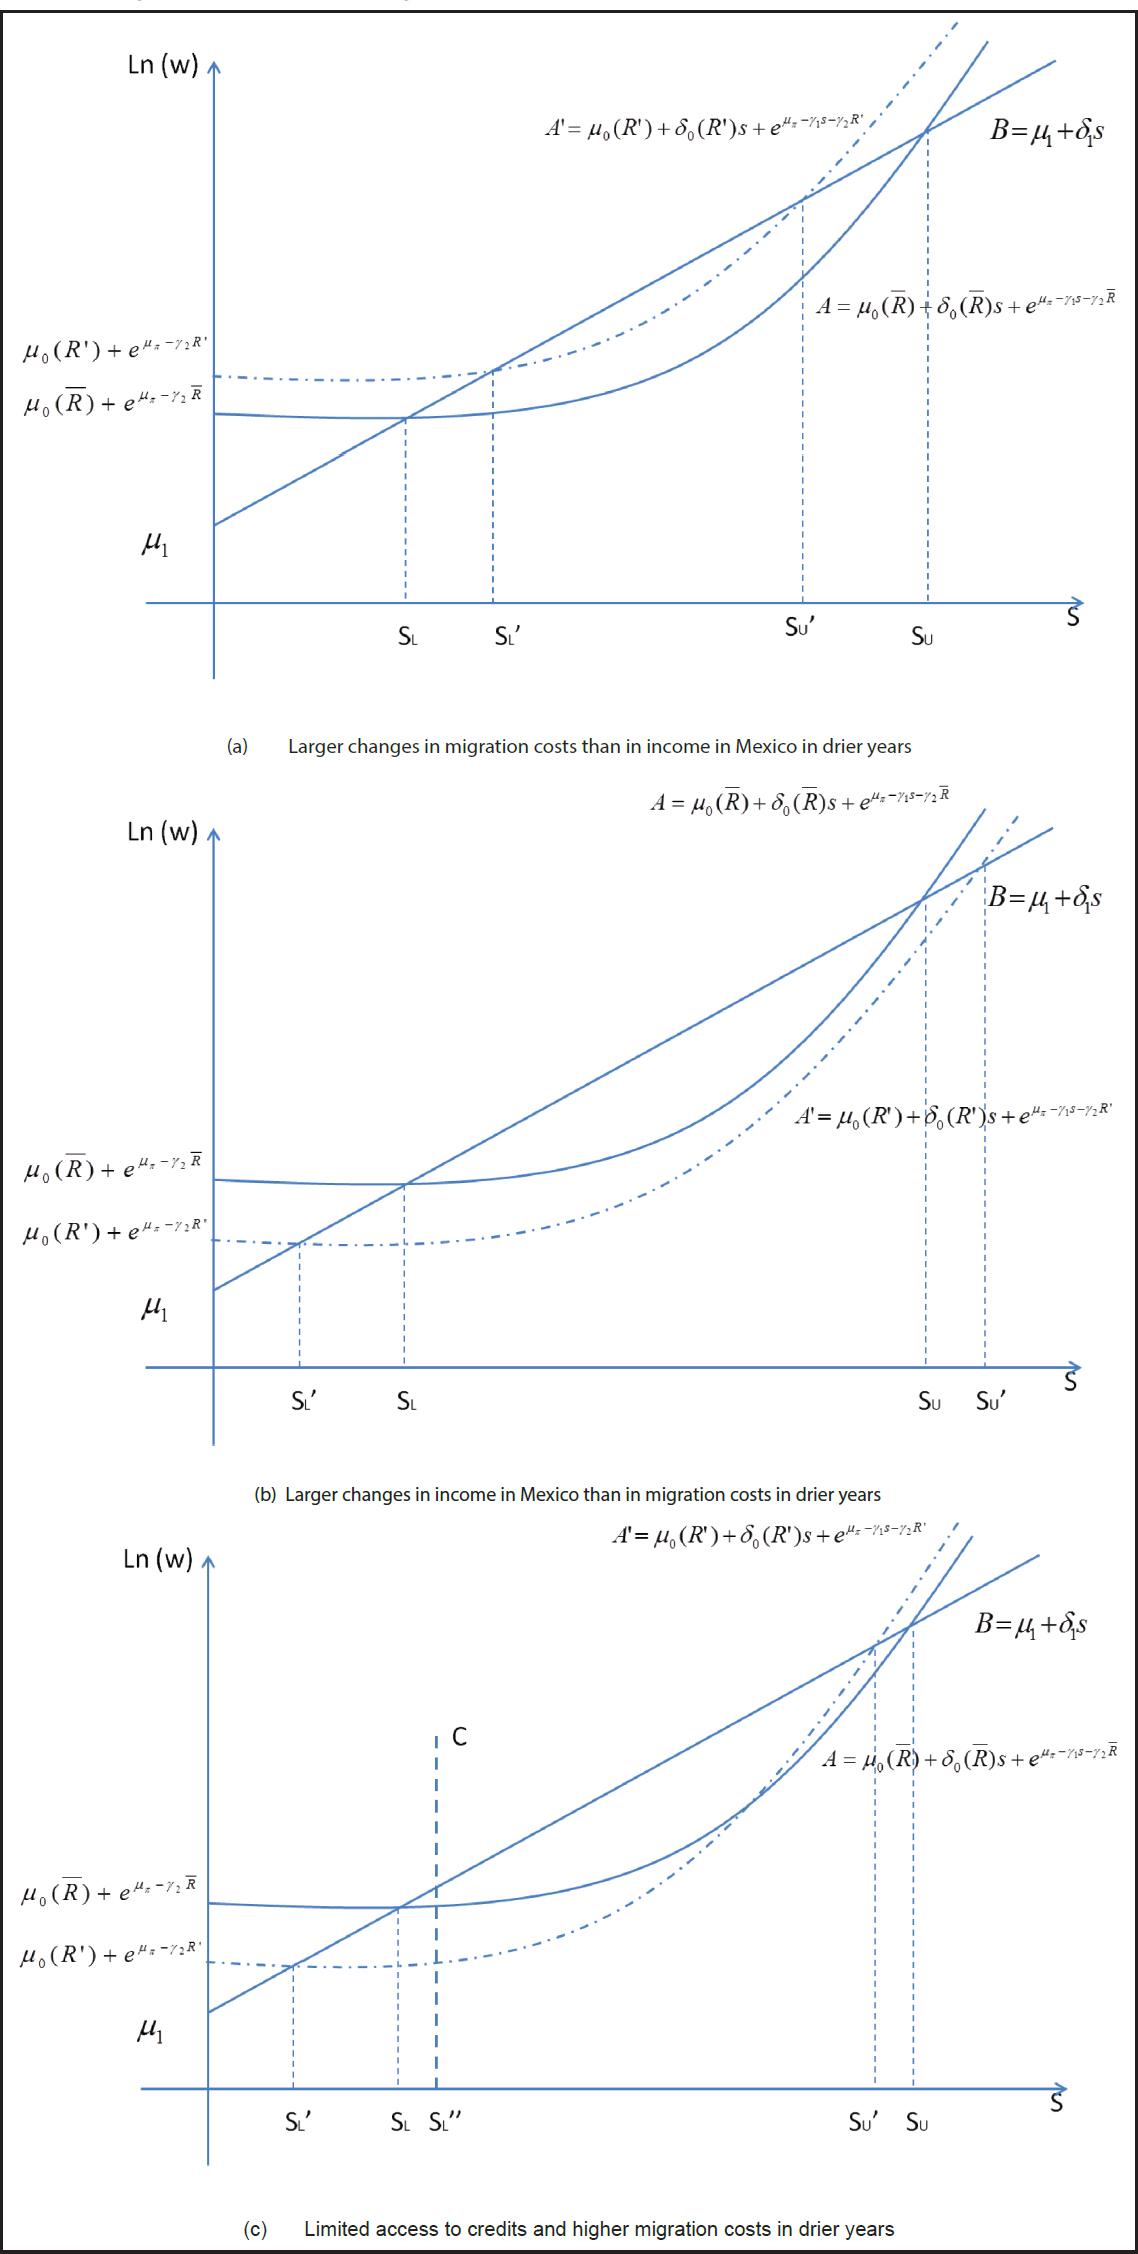
Figure 1
Migration selection, schooling, and rainfall.
A denotes the entire costs of migration, including opportunity costs; B denotes the monetary return to the investment, namely migrants’ earnings in the US. When A < B, people migrate to the US. With lower rainfall, A shifts to A′. The effects of rainfall on selection depend on liquidity constraints and the comparisons between changes in income in Mexico and migration costs.
Table 1
Summary statistics for state level rainfall in Mexico from 1941 to 2012.
| Annual | Rain spring | Rain winter | Drought spring* | |||||
|---|---|---|---|---|---|---|---|---|
| Mean | Std. Dev. | Mean | Std. Dev. | Mean | Std. Dev. | Mean | Std. Dev. | |
| Rainfall (100 mm) | 8.81 | 5.11 | 7.91 | 4.39 | 0.91 | 1.16 | 0.14 | 0.35 |
| Observations | 2,291 (32 states in Mexico) | |||||||
Table 2
Summary statistics of individual-year characteristics of male household heads from 1941 to 2012.
| Movement decision (travel) | Migration status (in the US) | |||||||
|---|---|---|---|---|---|---|---|---|
| Mean | Std. Dev. | Mean | Std. Dev. | Mean | Std. Dev. | Mean | Std. Dev. | |
| All males | Migrants (2%) | All males | Migrants (9%) | |||||
| Travel/ln US (%) | 2 | 15 | 9 | 28 | ||||
| School (Years) | 5.37 | 4.50 | 4.89 | 3.73 | 5.35 | 4.44 | 5.22 | 3.78 |
| No school (0) (%) | 17 | 38 | 14 | 35 | 17 | 37 | 12 | 33 |
| Primary (1–5 years) (%) | 33 | 47 | 39 | 49 | 33 | 47 | 38 | 49 |
| Middle (6–8 years) (%) | 26 | 44 | 27 | 45 | 26 | 44 | 29 | 45 |
| High (9–11 years) (%) | 12 | 32 | 13 | 33 | 12 | 32 | 13 | 34 |
| College (12–15 years) (%) | 7 | 26 | 5 | 22 | 7 | 26 | 6 | 24 |
| Grad (16–25 years) (%) | 5 | 22 | 2 | 13 | 5 | 21 | 2 | 13 |
| Married (%) | 68 | 47 | 63 | 48 | 68 | 47 | 66 | 47 |
| Age (years) | 34.78 | 12.90 | 29.39 | 9.91 | 34.62 | 12.76 | 32.47 | 11.00 |
| Child (number of children) | 2.07 | 2.30 | 1.94 | 2.30 | 2.07 | 2.29 | 2.06 | 2.24 |
| Migrated before (%) | 18 | 38 | 49 | 50 | 25 | 43 | 88 | 33 |
| Illegal (%) | 69 | 46 | 54 | 50 | ||||
| Number of Observations | 574,779 | 12,829 | 627,777 | 54,442 | ||||
Table 3
Male migrants’ coyote costs and sector choices change with rainfall.
| Coyote costs in USD | |||||
|---|---|---|---|---|---|
| (1) | (2) | (3) | (4) | (5) | |
| Rainfall | −7.7718** | −7.7860** | −11.7426*** | −7.6126* | −7.6126 |
| (3.4833) | (3.4893) | (4.3320) | (4.3557) | (5.2118) | |
| School | −4.8631*** | −9.9031*** | −26.8254 | −26.8254 | |
| (1.6115) | (3.7678) | (19.4667) | (27.7395) | ||
| School × Rainfall | 0.6594 (0.4270) | ||||
| Married | 28.8064** | 28.6928** | 4.4146 | 4.4146 | |
| (11.2538) | (11.2578) | (18.7946) | (27.0166) | ||
| Age | −2.1656*** | −2.2260*** | |||
| (0.5972) | (0.5996) | ||||
| Child | 0.8596 | 0.7900 | 0.9558 | 0.9558 | |
| (2.1556) | (2.1517) | (4.2650) | (6.5539) | ||
| Fixed effects | Community FE | Community FE | Community FE | Individual FE | Individual FE |
| State FE & Year FE | Yes | Yes | Yes | Yes | Yes |
| Cluster | State × Year | State × Year | State × Year | State × Year | Individual |
| R2 | 0.45 | 0.45 | 0.45 | 0.91 | 0.91 |
| Number of observations | 5,937 | 5,937 | 5,937 | 5,937 | 5,937 |
| Mean (Coyote) | 494.83 | ||||
| Std. Dev. (Coyote) | 400.48 | ||||
| Cross-Sector (Selected Coefficients) | |||||
| Rainfall | 0.0036 | 0.0041 | 0.0079* | −0.0037 | −0.0037 |
| (0.0038) | (0.0038) | (0.0047) | (0.0066) | (0.0083) | |
| School | −0.0004 | 0.0045 | −0.0475 | −0.0475 | |
| (0.0018) | (0.0039) | (0.0642) | (0.0523) | ||
| School × Rainfall | −0.0007 (0.0005) | ||||
| Fixed effects | Community FE | Community FE | Community FE | Individual FE | Individual FE |
| State FE & Year FE | Yes | Yes | Yes | Yes | Yes |
| Cluster | State × Year | State × Year | State × Year | State × Year | Individual |
| R2 | 0.31 | 0.31 | 0.31 | 0.84 | 0.84 |
| Number of observations | 7,839 | 7,839 | 7,839 | 7,839 | 7,839 |
| Mean (Sector) | 0.40 | ||||
| Std. Dev. (Sector) | 0.49 | ||||
[i] Note: Dependent variable: Panel (1): Coyote costs (dollars) (adjusted for CPI (1982–1984)); Panel (2): Dichotomous variable for crossing the border in Tijuana. Independent variable: individual characteristics and rainfall in the home state. Sample: Migrants’ traveling years with illegal crossings.
Table 4
Male migrants’ migration costs (networks) change with rainfall.
| Lodging from relatives | Contacting relatives | Receiving financial help | |
|---|---|---|---|
| (1) | (2) | (3) | |
| Rainfall | 0.0086** | 0.0056 | −0.0001 |
| (0.0042) | (0.0045) | (0.0045) | |
| School | 0.0022 | 0.0025 | −0.0041** |
| (0.0018) | (0.0019) | (0.0018) | |
| Married | 0.0410*** | 0.0431*** | −0.0000 |
| (0.0147) | (0.0151) | (0.0139) | |
| Age | −0.0025*** | −0.0049*** | −0.0053*** |
| (0.0007) | (0.0007) | (0.0007) | |
| Child | −0.0102*** | −0.0038 | 0.0008 |
| (0.0032) | (0.0032) | (0.0032) | |
| R2 | 0.17 | 0.13 | 0.21 |
| Rainfall | 0.0141*** | 0.0106** | −0.0089* |
| (0.0051) | (0.0050) | (0.0050) | |
| School | 0.0090** | 0.0086** | −0.0148*** |
| (0.0043) | (0.0041) | (0.0040) | |
| School × Rainfall | −0.0009* | −0.0008* | 0.0015*** |
| (0.0006) | (0.0005) | (0.0005) | |
| Married | 0.0414*** | 0.0434*** | −0.0006 |
| (0.0147) | (0.0151) | (0.0138) | |
| Age | −0.0025*** | −0.0049*** | −0.0054*** |
| (0.0007) | (0.0008) | (0.0007) | |
| Child | −0.0100*** | −0.0037 | 0.0006 |
| (0.0032) | (0.0032) | (0.0032) | |
| R2 | 0.17 | 0.13 | 0.21 |
| Number of observations | 6,855 | 6,874 | 6,983 |
| Fixed effects | Community FE | Community FE | Community FE |
| State FE & Year FE | Yes | Yes | Yes |
| Cluster | State × Year | State × Year | State × Year |
| Mean (dependent Var) | 0.44 | 0.50 | 0.59 |
| Std. Dev. (dependent Var) | 0.50 | 0.50 | 0.49 |
[i] Note: Dependent variable: Column (1): Dichotomous variable for lodging from relatives upon arriving in the US; Column (2): Dichotomous variable for contacting relatives after arriving in the US; Column (3): Dichotomous variable for receiving financial help for US trips. Independent variable: individual characteristics and rainfall in the home state. Sample: Male household heads’ first or last trips to the US (Surveys before 2012 only asked either migrants’ first or last US trip. Surveys after 2012 recorded both the first and last trips for migrants traveled multiple times.). State FE, Year FE, and Community FE are included. Errors are cluster at State × Year level.
Table 5
Selection on schooling varies by rainfall (selected coefficients).
| Dependent variable | Movement decision (travel) | Migration status (in the US) | ||||
|---|---|---|---|---|---|---|
| (1) | (2) | (3) | (4) | (5) | (6) | |
| Rainfall | 0.0001 | 0.0006*** | 0.0001 | 0.0003 | 0.0037*** | 0.0009*** |
| (0.0002) | (0.0002) | (0.0002) | (0.0003) | (0.0004) | (0.0003) | |
| School | 0.0014*** | 0.0031*** | 0.0065*** | 0.0150*** | ||
| (0.0001) | (0.0004) | (0.0003) | (0.0008) | |||
| School × Rainfall | −0.0002*** | −0.0011*** | ||||
| (0.00004) | (0.0001) | |||||
| School squared | −0.0001*** | −0.0002*** | −0.0004*** | −0.0009*** | ||
| (0.000001) | (0.00002) | (0.00002) | (0.00005) | |||
| School squared × Rainfall | 0.00001*** | 0.0001*** | ||||
| (0.000002) | (0.000005) | |||||
| No school | −0.0092*** | −0.0389*** | ||||
| (0.0016) | (0.0031) | |||||
| Middle | 0.0025* | 0.0177*** | ||||
| (0.0014) | (0.0024) | |||||
| High | 0.0004 | 0.0206*** | ||||
| (0.0018) | (0.0034) | |||||
| College | −0.0099*** | 0.0082*** | ||||
| (0.0017) | (0.0030) | |||||
| Grad | −0.0163*** | −0.0304*** | ||||
| (0.0017) | (0.0029) | |||||
| No school × Rainfall | 0.0005*** | 0.0028*** | ||||
| (0.0002) | (0.0003) | |||||
| Middle × Rainfall | −0.0003** | −0.0015*** | ||||
| (0.0001) | (0.0003) | |||||
| High × Rainfall | −0.0003* | −0.0023*** | ||||
| (0.0002) | (0.0003) | |||||
| College × Rainfall | −0.0001 | −0.0020*** | ||||
| (0.0002) | (0.0003) | |||||
| Grad × Rainfall | 0.0005*** | 0.0009*** | ||||
| (0.0002) | (0.0003) | |||||
| R2 | 0.036 | 0.036 | 0.036 | 0.25 | 0.25 | 0.25 |
| Number of observations | 574,779 | 574,779 | 574,779 | 627,777 | 627,777 | 627,777 |
[i] Note: Dependent variable (Columns (1)–(3)): Travel=1 for actual migration trips, zero otherwise. Dependent variable (Columns (4)–(6)): In US=1 if migrants spend more than 1 month in the US, 0 otherwise. Independent variables: Rainfall in Mexico (state level) and its interactions with education-related variables. Sample (Columns (1)–(3)): male household heads’ years in Mexico and traveling years to the US (unbalanced panels). Sample (Columns (4)–(6)): male household heads’ life years (unbalanced panels). State FE, Year FE, and Community FE are included. Errors are cluster at State × Year level.
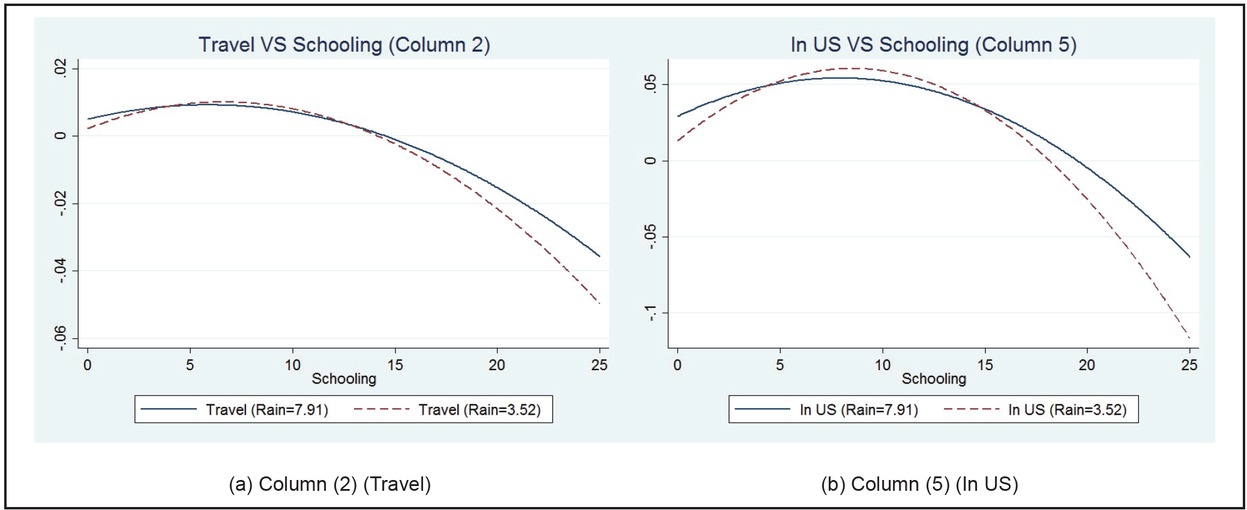
Figure 2
The inverted U relationship between years of schooling and migration probabilities changes with rainfall.
Setting the values of all control variables to zero and ignoring the constant terms, these figures show the expected migration probabilities versus individuals’ years of schooling based on coefficients in Table 5. (a) and (b) are from the movement decision (Travel) sample and the migration status (in the US) sample, respectively. The inverted U curves in droughts are sharper with higher vertexes than curves in normal years. Facing droughts, people with about 5–13 years of schooling increase their migration probabilities, while people with years of schooling fewer than 5 years or more than 15 years decrease their probabilities of migrating
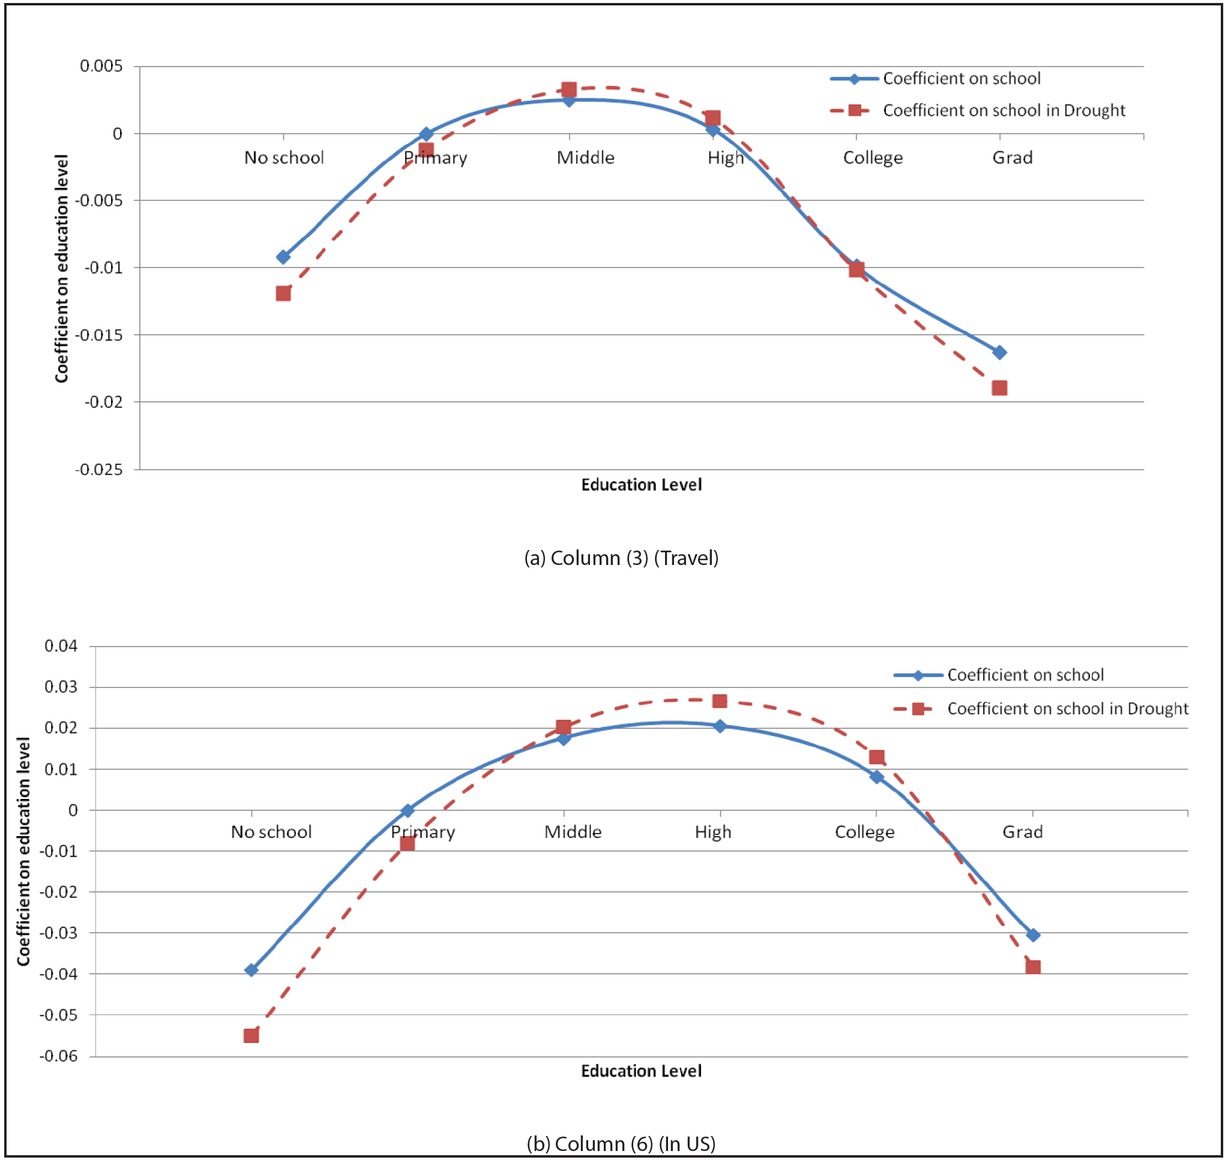
Figure 3
The relationship between educational attainments and migration probabilities changes with rainfall.
Points on the solid line represent the coefficients on educational categories based on the migration regression results in Table 5. Points on the dashed line represent the changed coefficients on educational categories caused by a decrease in rainfall (439 mm). Both (a) and (b) show an inverted U relationship between migration probabilities and educational attainments. When rainfall decreases, people in categories Middle and High have higher probabilities to travel to or stay in the US, while people in categories No school, Primary, and Grad reveal lower migration probabilities.
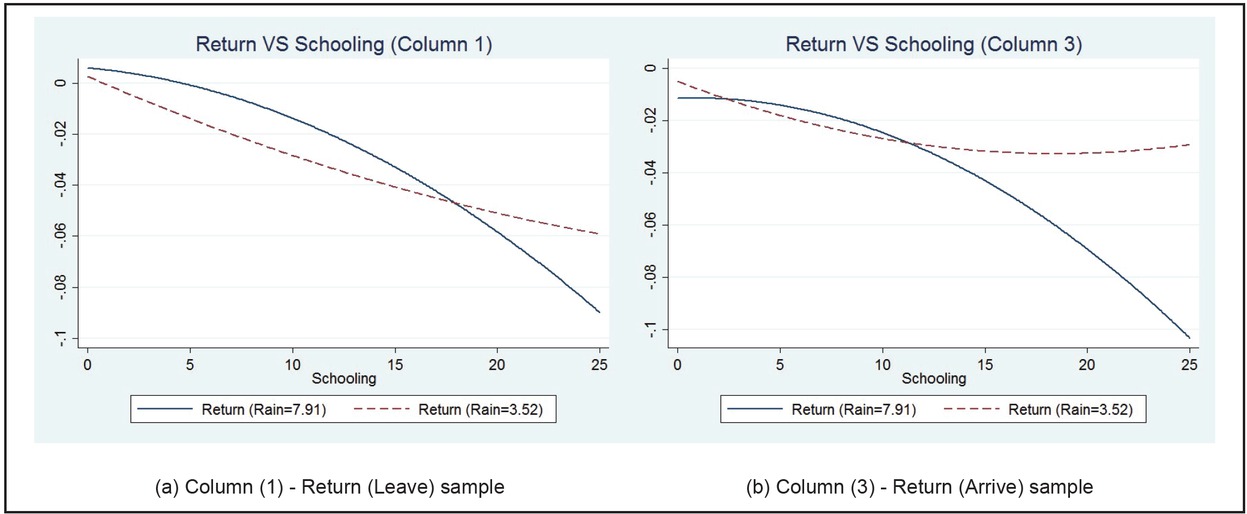
Figure 4
The relationship between years of schooling and return probabilities changes with rainfall.
Setting the values of all control variables to zero and ignoring the constant terms, these figures show the expected or predicted return probabilities versus individuals’ years of schooling based on coefficients in Table 6. Facing droughts, migrants with some years of schooling lower their return probabilities, while the least educated migrants and the most educated migrants increase their probabilities of return to Mexico.
Table 6
Return decision varies with rainfall by schooling (selected coefficients).
| Dependent variable | Return (leave) | Return (arrive) | ||
|---|---|---|---|---|
| (1) | (2) | (3) | (4) | |
| Rainfall | 0.0007 | 0.0024 | −0.0015 | 0.0004 |
| (0.0021) | (0.0019) | (0.0020) | (0.0016) | |
| School | −0.0058* | −0.0056* | ||
| (0.0033) | (0.0030) | |||
| School × Rainfall | 0.0006 | 0.0007* | ||
| (0.0004) | (0.0004) | |||
| School squared | 0.0002 | 0.0003 | ||
| (0.0002) | (0.0002) | |||
| School squared × Rainfall | −0.00004 | −0.0001** | ||
| (0.00002) | (0.00002) | |||
| No school | 0.0100 | 0.0109 | ||
| (0.0184) | (0.0160) | |||
| Middle | 0.0042 | 0.0017 | ||
| (0.0109) | (0.0101) | |||
| High | −0.0397*** | −0.0233** | ||
| (0.0130) | (0.0117) | |||
| College | −0.0374*** | −0.0239* | ||
| (0.0143) | (0.0132) | |||
| Grad | 0.0267 | 0.0382* | ||
| (0.0229) | (0.0223) | |||
| No school × Rainfall | −0.0009 | −0.0015 | ||
| (0.0024) | (0.0021) | |||
| Middle × Rainfall | −0.0007 | −0.0003 | ||
| (0.0015) | (0.0014) | |||
| High × Rainfall | 0.0035** | 0.0016 | ||
| (0.0018) | (0.0015) | |||
| College × Rainfall | 0.0009 | −0.0002 | ||
| (0.0020) | (0.0018) | |||
| Grad × Rainfall | −0.0066** | −0.0082*** | ||
| (0.0027) | (0.0026) | |||
| R2 | 0.059 | 0.06 | 0.043 | 0.044 |
| Number of observations | 36,340 | 36,340 | 39,749 | 39,749 |
| Mean (return) | 13% | 12% | ||
| Std. Dev. (return) | 0.34 | 0.33 | ||
[i] Note: Dependent variable: Return = 1 if migrants return to Mexico, 0 if migrants stay in the US. Independent variables: Rainfall in Mexico (state level) and its interactions with education-related variables. State FE, Year FE, and Community FE are included. Errors are cluster at State × Year level.
Table A1
Relationship between rainfall and migration behavior.
| Migrated before | ||||||
|---|---|---|---|---|---|---|
| Illegal | Using coyote | Cross alone | Mother | Father | Siblings | |
| (1) | (2) | (3) | (4) | (5) | (6) | |
| Rainfall | 0.0023 | 0.0043 | −0.0028 | 0.0006 | 0.0000 | −0.0033 |
| (0.0027) | (0.0031) | (0.0030) | (0.0010) | (0.0021) | (0.0032) | |
| School | −0.0182*** | −0.0161*** | −0.0063*** | 0.0042*** | 0.0093*** | 0.0094*** |
| (0.0013) | (0.0014) | (0.0011) | (0.0007) | (0.0012) | (0.0014) | |
| Married | −0.0283*** | −0.0120 | −0.0081 | −0.0071* | −0.0118 | −0.0015 |
| (0.0087) | (0.0099) | (0.0086) | (0.0038) | (0.0079) | (0.0094) | |
| Age | −0.0086*** | −0.0086*** | −0.0014*** | −0.0002 | −0.0045*** | −0.0014*** |
| (0.0005) | (0.0006) | (0.0004) | (0.0002) | (0.0004) | (0.0005) | |
| Child | 0.0162*** | 0.0118*** | 0.0051*** | −0.0006 | −0.0017 | 0.0050** |
| (0.0019) | (0.0023) | (0.0019) | (0.0007) | (0.0017) | (0.0023) | |
| Migrated before | −0.0660*** | −0.1025*** | −0.0280*** | 0.0204*** | 0.0522*** | 0.1422*** |
| (0.0080) | (0.0090) | (0.0076) | (0.0035) | (0.0074) | (0.0088) | |
| R2 | 0.38 | 0.33 | 0.16 | 0.07 | 0.27 | 0.23 |
| Rainfall | −0.0033 | −0.0006 | −0.0059* | 0.0038*** | 0.0052* | −0.0039 |
| (0.0033) | (0.0036) | (0.0033) | (0.0014) | (0.0027) | (0.0036) | |
| School | −0.0256*** | −0.0227*** | −0.0104*** | 0.0084*** | 0.0160*** | 0.0086*** |
| (0.0029) | (0.0031) | (0.0024) | (0.0015) | (0.0026) | (0.0030) | |
| School × Rainfall | 0.0010*** | 0.0009** | 0.0006* | −0.0006*** | −0.0009*** | 0.0001 |
| (0.0003) | (0.0004) | (0.0003) | (0.0002) | (0.0003) | (0.0004) | |
| Married | −0.0286*** | −0.0122 | −0.0082 | −0.0069* | −0.0115 | −0.0016 |
| (0.0086) | (0.0099) | (0.0085) | (0.0038) | (0.0079) | (0.0094) | |
| Age | −0.0087*** | −0.0086*** | −0.0014*** | −0.0002 | −0.0045*** | −0.0014*** |
| (0.0005) | (0.0006) | (0.0004) | (0.0002) | (0.0004) | (0.0005) | |
| Child | 0.0162*** | 0.0118*** | 0.0051*** | −0.0006 | −0.0017 | 0.0050** |
| (0.0019) | (0.0023) | (0.0019) | (0.0007) | (0.0017) | (0.0023) | |
| Migrated before | −0.0661*** | −0.1026*** | −0.0280*** | 0.0204*** | 0.0523*** | 0.1422*** |
| (0.0080) | (0.0090) | (0.0076) | (0.0035) | (0.0074) | (0.0088) | |
| R2 | 0.38 | 0.33 | 0.16 | 0.072 | 0.27 | 0.23 |
| Number of observations | 12,736 | 12,826 | 12,826 | 12,652 | 12,077 | 12,826 |
Table A2
Relationship between rainfall and illegal migration behavior.
| Using coyote | Cross alone | |
|---|---|---|
| (1) | (2) | |
| Rainfall | 0.0039 | −0.0044 |
| (0.0036) | (0.0042) | |
| School | −0.0033* | 0.0018 |
| (0.0018) | (0.0018) | |
| Married | 0.0015 | 0.0061 |
| (0.0117) | (0.0127) | |
| Age | −0.0039*** | 0.0018*** |
| (0.0007) | (0.0007) | |
| Child | 0.0030 | 0.0019 |
| (0.0028) | (0.0027) | |
| R2 | 0.22 | 0.2 |
| Rainfall | 0.0021 | −0.0017 |
| (0.0048) | (0.0050) | |
| School | −0.0057 | 0.0053 |
| (0.0043) | (0.0041) | |
| School × Rainfall | 0.0003 | −0.0005 |
| (0.0005) | (0.0005) | |
| Married | 0.0013 | 0.0063 |
| (0.0117) | (0.0127) | |
| Age | −0.0039*** | 0.0018*** |
| (0.0007) | (0.0007) | |
| Child | 0.0030 | 0.0019 |
| (0.0028) | (0.0027) | |
| R2 | 0.22 | 0.2 |
| Number of observations | 7,837 | 7,837 |
Table A3
Summary statistics of male household heads (agriculture versus. non-agriculture).
| Migration decision sample | ||||
|---|---|---|---|---|
| Agriculture | Non-agriculture | |||
| Mean | Std. Dev. | Mean | Std. Dev. | |
| Travel (%) | 3 | 17 | 2 | 13 |
| School (Year) | 3.25 | 3.04 | 6.78 | 4.67 |
| No school (0) (%) | 27 | 44 | 10 | 29 |
| Primary (1–5 years) (%) | 43 | 50 | 25 | 44 |
| Middle (6–8 years) (%) | 22 | 41 | 30 | 46 |
| High (9–11 years) (%) | 6 | 23 | 17 | 37 |
| College (12–15 years) (%) | 2 | 13 | 10 | 31 |
| Grad (16–25 years) (%) | 0 | 6 | 8 | 28 |
| Married (%) | 70 | 46 | 70 | 46 |
| Age (Years) | 35.62 | 13.41 | 34.14 | 11.79 |
| Child (number of children) | 2.23 | 2.46 | 2.06 | 2.18 |
| Migrated before (%) | 21 | 41 | 15 | 36 |
| Number of observations | 234,816 | 308,411 | ||
| Migration status sample | ||||
| In the US (%) | 8 | 28 | 9 | 29 |
| School (Year) | 3.27 | 3.04 | 6.73 | 4.61 |
| No school (0) (%) | 27 | 44 | 9 | 29 |
| Primary (1–5 years) (%) | 44 | 50 | 26 | 44 |
| Middle (6–8 years) (%) | 22 | 41 | 30 | 46 |
| High (9–11 years) (%) | 6 | 23 | 17 | 37 |
| College (12–15 years) (%) | 2 | 13 | 10 | 30 |
| Grad (16–25 years) (%) | 0 | 6 | 8 | 27 |
| Married (%) | 70 | 46 | 69 | 46 |
| Age (Years) | 35.38 | 13.27 | 34.02 | 11.69 |
| Child (number of children) | 2.24 | 2.46 | 2.05 | 2.17 |
| Migrated before (%) | 28 | 45 | 23 | 42 |
| Number of observations | 254,594 | |||
Table A4
Selection on schooling varies by rainfall - agriculture (selected coefficients).
| Dependent variable | Movement decision (travel) | Migration status (in the US) | ||||
|---|---|---|---|---|---|---|
| (1) | (2) | (3) | (4) | (5) | (6) | |
| Rainfall | −0.0003 | 0.0008*** | 0.0001 | 0.0007* | 0.0052*** | 0.0014*** |
| (0.0003) | (0.0003) | (0.0003) | (0.0004) | (0.0005) | (0.0005) | |
| School | 0.0030*** | 0.0066*** | 0.0089*** | 0.0225*** | ||
| (0.0003) | (0.0008) | (0.0005) | (0.0015) | |||
| School × Rainfall | −0.0004*** | −0.0017*** | ||||
| (0.0001) | (0.0002) | |||||
| School squared | −0.0002*** | −0.0004*** | −0.0006*** | −0.0012*** | ||
| (0.00002) | (0.0001) | (0.00004) | (0.0001) | |||
| School squared | 0.00002*** | 0.0001*** | ||||
| × Rainfall | (0.000006) | (0.00001) | ||||
| No school | −0.0112*** | −0.0473*** | ||||
| (0.0025) | (0.0043) | |||||
| Middle | 0.0115*** | 0.0356*** | ||||
| (0.0029) | (0.0042) | |||||
| High | 0.0183*** | 0.0421*** | ||||
| (0.0049) | (0.0065) | |||||
| College | −0.0022 | 0.0260** | ||||
| (0.0078) | (0.0106) | |||||
| Grad | −0.0272** | −0.0247 | ||||
| (0.0111) | (0.0205) | |||||
| No school × Rainfall | 0.0006** | 0.0033*** | ||||
| (0.0003) | (0.0004) | |||||
| Middle × Rainfall | −0.0011*** | −0.0033*** | ||||
| (0.0003) | (0.0004) | |||||
| High × Rainfall | −0.0015*** | −0.0049*** | ||||
| (0.0005) | (0.0006) | |||||
| College × Rainfall | −0.0001 | −0.0037*** | ||||
| (0.0008) | (0.0010) | |||||
| Grad × Rainfall | 0.0014 | 0.0018 | ||||
| (0.0012) | (0.0022) | |||||
| R2 | 0.044 | 0.044 | 0.044 | 0.22 | 0.23 | 0.23 |
| Number of observations | 234,816 | 234,816 | 234,816 | 254,594 | 254,594 | 254,594 |
| Mean (dependent Var) | 3% | 8% | ||||
| Std. Dev. (dependent Var) | 0.17 | 0.28 | ||||
[i] Note: Dependent variable (Columns (1)– (3)): Travel=1 for actual migration trips, zero otherwise. Dependent variable (Columns (4)– (6)): In US=1 if migrants spend more than one month in the US, zero otherwise. Independent Variables: Rainfall in Mexico (state level) and its interactions with education-related variables. Sample (Columns (1)– (3)): male household heads’ years in Mexico and traveling years to the US (unbalanced panels). Sample (Columns (4)– (6)): male household heads’ life years (unbalanced panels). State FE, Year FE, and Community FE are included. Errors are cluster at State × Year level.
Table A5
Selection on schooling varies by rainfall - non-agriculture (selected coefficients).
| Dependent variable | Movement decision (travel) | Migration status (in the US) | ||||
|---|---|---|---|---|---|---|
| (1) | (2) | (3) | (4) | (5) | (6) | |
| Rainfall | 0.0002 | 0.0008*** | 0.0001 | −0.0002 | 0.0031*** | 0.0006 |
| (0.0002) | (0.0002) | (0.0002) | (0.0004) | (0.0005) | (0.0005) | |
| School | 0.0007*** | 0.0021*** | 0.0054*** | 0.0120*** | ||
| (0.0002) | (0.0003) | (0.0004) | (0.0008) | |||
| School × Rainfall | −0.0002*** | −0.0009*** | ||||
| (0.00004) | (0.0001) | |||||
| School squared | −0.0001*** | −0.0001*** | −0.0003*** | −0.0007*** | ||
| (0.000001) | (0.00002) | (0.00002) | (0.00004) | |||
| School squared x Rainfall | 0.00001*** | 0.00004*** | ||||
| (0.000002) | (0.000004) | |||||
| No school | −0.0097*** | −0.0371*** | ||||
| (0.0022) | (0.0043) | |||||
| Middle | 0.0003 | 0.0117*** | ||||
| (0.0015) | (0.0027) | |||||
| High | −0.0006 | 0.0180*** | ||||
| (0.0018) | (0.0038) | |||||
| College | −0.0074*** | 0.0132*** | ||||
| (0.0018) | (0.0037) | |||||
| Grad | −0.0126*** | −0.0270*** | ||||
| (0.0018) | (0.0036) | |||||
| No school × Rainfall | 0.0009*** | 0.0029*** | ||||
| (0.0003) | (0.0005) | |||||
| Middle × Rainfall | −0.00004 | −0.0011*** | ||||
| (0.0002) | (0.0003) | |||||
| High × Rainfall | −0.0001 | −0.0021*** | ||||
| (0.0002) | (0.0004) | |||||
| College × Rainfall | 0.0001 | −0.0021*** | ||||
| (0.0002) | (0.0004) | |||||
| Grad × Rainfall | 0.0005*** | 0.0005 | ||||
| (0.0002) | (0.0004) | |||||
| R2 | 0.03 | 0.03 | 0.03 | 0.3 | 0.3 | 0.3 |
| Number of observations | 308,411 | 308,411 | 308,411 | 340,364 | 340,364 | 340,364 |
| Mean (dependent Var) | 2% | 9% | ||||
| Std. Dev. (dependent Var) | 0.13 | 0.29 | ||||
[i] Note: Dependent variable (Columns (1)– (3)): Travel=1 for actual migration trips, zero otherwise. Dependent variable (Columns (4)– (6)): In US=1 if migrants spend more than one month in the US, zero otherwise. Independent Variables: Rainfall in Mexico (state level) and its interactions with education-related variables. Sample (Columns (1)– (3)): male household heads’ years in Mexico and traveling years to the US (unbalanced panels). Sample (Columns (4)– (6)): male household heads’ life years (unbalanced panels). State FE, Year FE, and Community FE are included. Errors are cluster at State × Year level.
Table A6
Cox model results: migration duration changes with rainfall (selected coefficients).
| (1) | (2) | (3) | |
|---|---|---|---|
| Rainfall | 1.0104 (0.0071) | 1.0083 (0.0102) | 1.0149* (0.0084) |
| School | 0.9371*** (0.0169) | ||
| School × Rainfall | 1.0025 (0.0023) | ||
| School squared | 1.0041*** (0.0013) | ||
| School squared × Rainfall | 0.9997* (0.0002) | ||
| No school | 1.0737 (0.0894) | ||
| Middle | 0.9154 (0.0508) | ||
| High | 0.8678* (0.0675) | ||
| College | 0.8163** (0.0838) | ||
| Grad | 1.6970*** (0.3438) | ||
| No school × Rainfall | 0.9926 (0.0110) | ||
| Middle × Rainfall | 0.9961 (0.0074) | ||
| High × Rainfall | 0.9828* (0.0100) | ||
| College × Rainfall | 0.9972 (0.0130) | ||
| Grad × Rainfall | 0.9467** (0.0228) | ||
| Number of observations | 22,883 | 22,883 | 22,883 |
| Mean (duration) | 21.41 months | ||
| Std. Dev. (duration) | 46.28 | ||
[i] Note: Dependent variable: Duration (months) in the US. Independent Variable: Rainfall in Mexico in migrants’ traveling year. Sample: All male migrants’ trips to the US. State FE, Year FE, and Community FE are included. Errors are cluster at State × Year level.
Table A7
The insignificant effects of rainfall on years of schooling.
| Movement decision (travel) | Migration status (in the US) | |||||||
|---|---|---|---|---|---|---|---|---|
| (1) | (2) | (3) | (4) | (5) | (6) | (7) | (8) | |
| Rainfall | –0.0026 | –0.0026 | 0.0002 | 0.0002 | –0.0015 | –0.0015 | 0.0002 | 0.0002 |
| (0.0030) | (0.0030) | (0.0004) | (0.0004) | (0.0027) | (0.0027) | (0.0004) | (0.0004) | |
| Married | 0.0465 | 0.0468 | 0.1135*** | 0.1134*** | 0.0476* | 0.0478* | 0.1050*** | 0.1050*** |
| (0.0299) | (0.0299) | (0.0040) | (0.0040) | (0.0289) | (0.0288) | (0.0037) | (0.0037) | |
| Age | –0.1241*** | –0.1244*** | 0.0009*** | 0.0009*** | –0.1234*** | –0.1234*** | 0.0009*** | 0.0009*** |
| (0.0011) | (0.0011) | (0.0001) | (0.0001) | (0.0011) | (0.0011) | (0.0001) | (0.0001) | |
| Child | –0.1366*** | –0.1367*** | 0.0009*** | 0.0008*** | –0.1403*** | –0.1402*** | 0.0007*** | 0.0007*** |
| (0.0046) | (0.0046) | (0.0003) | (0.0003) | (0.0044) | (0.0044) | (0.0003) | (0.0003) | |
| Migrated before | –0.3278*** | –0.3150*** | –0.0284*** | –0.0281*** | –0.2970*** | –0.3036*** | –0.0200*** | –0.0212*** |
| (0.0156) | (0.0155) | (0.0051) | (0.0052) | (0.0163) | (0.0152) | (0.0043) | (0.0043) | |
| Movement decision (travel) | –0.2916*** | 0.0034 | ||||||
| (0.0315) | (0.0028) | |||||||
| Migration status (in the US) | 0.0231 | 0.0064** | ||||||
| (0.0180) | (0.0031) | |||||||
| Rainfall | –0.0043 | –0.0044 | 0.0002 | 0.0002 | 0.0002 | (0.0002 | –0.0000 | –0.0000 |
| (0.0089) | (0.0089) | (0.0012) | (0.0012) | (0.0084) | (0.0084) | (0.0011) | (0.0011) | |
| Rainfall squared | 0.0001 | 0.0001 | –0.0000 | –0.0000 | –0.0001 | –0.0001 | 0.0000 | 0.0000 |
| (0.0004) | (0.0004) | (0.0000) | (0.0000) | (0.0004) | (0.0004) | (0.0000) | (0.0000) | |
| Fixed effects | Community | Community | Individual | Individual | Community | Community | Individual | Individual |
| State FE & Year FE | Yes | Yes | Yes | Yes | Yes | Yes | Yes | Yes |
| Cluster | State × Year | State × Year | Individual | Individual | State × Year | State × Year | Individual | Individual |
| R2 | 0.37 | 0.37 | 0.99 | 0.99 | 0.37 | 0.37 | 1 | 1 |
| Number of observations | 574,779 | 574,779 | 574,779 | 574,779 | 627,777 | 627,777 | 627,777 | 627,777 |
[i] Note: Dependent variable: School (Years of schooling). Independent variable: individual characteristics and rainfall in home state. Sample (Columns (1)– (4)): male household heads’ years in Mexico and traveling years to the US (unbalanced panels). Sample (Columns (5)–(8)): male household heads’ life years (unbalanced panels). State FE,Year FE, and Community FE (or Individual FE) are included. Errors are cluster at State x Year or Individual level.