
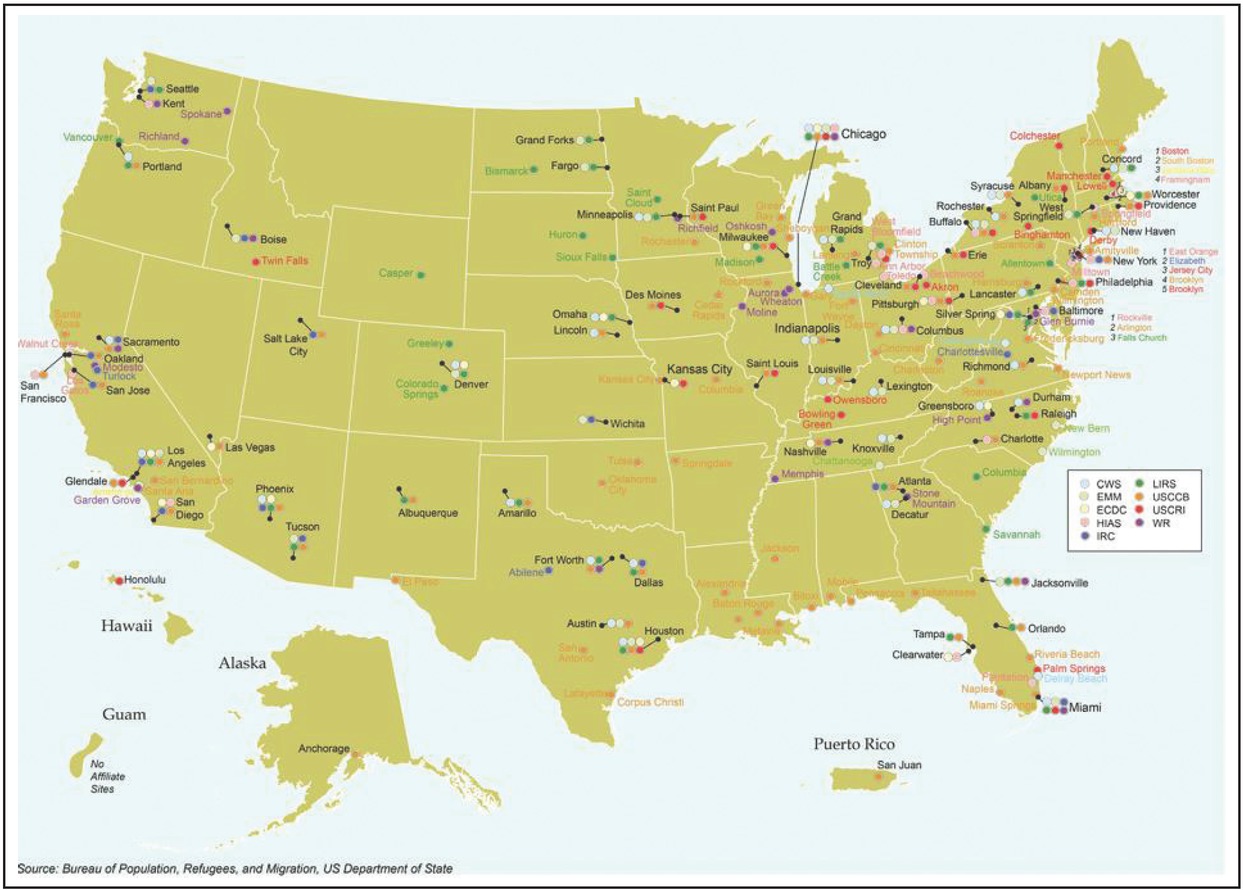
Figure 1
Resettlement sites by volunteer agency.
Source: https://www.wrapsnet.org/documents/PRM-RPP+Affilaite+Sites+2014.jpg
Table 1
Summary statistics by year of arrival
| Demographics | 1988–1991 | 1992–1995 | 1996–1999 | 2000–2004 | All years |
|---|---|---|---|---|---|
| Years of education | 10.19 | 10.38 | 10.74 | 10.08 | 10.36 |
| % Female | 50.62 | 51.38 | 49.76 | 51.52 | 50.98 |
| Age at arrival | 31.47 | 32.92 | 32.09 | 32.12 | 32.38 |
| % Fluent in English | 9.09 | 7.33 | 10.71 | 14.29 | 9.18 |
| % Disabled | 10.73 | 13.13 | 8.19 | 8.97 | 11.15 |
| % Married | 61.01 | 54.09 | 58.33 | 57.64 | 56.67 |
| % Have children | 54.88 | 56.44 | 61.32 | 67.96 | 58.84 |
| % From Africa | 1.64 | 5.23 | 10.26 | 13.80 | 6.80 |
| % From Asia | 90.91 | 86.12 | 50.51 | 53.87 | 75.70 |
| % From Europe | 7.45 | 8.66 | 39.10 | 31.76 | 17.38 |
| % From South America | 0 | 0 | 0.13 | 0.56 | 0.11 |
| Individuals | 3,289 | 8,573 | 3,069 | 2,840 | 17,771 |
Table 2
Years since migration by panel iteration
| Years since | Panel iteration | |||||
|---|---|---|---|---|---|---|
| Migration | 1 | 2 | 3 | 4 | 5 | Total |
| 1 Year | 7,442 | 0 | 0 | 0 | 0 | 7,442 |
| 2 Years | 3,619 | 4,202 | 0 | 0 | 0 | 7,821 |
| 3 Years | 2,639 | 1,546 | 3,596 | 0 | 0 | 7,781 |
| 4 Years | 2,147 | 1,225 | 1,247 | 3,089 | 0 | 7,708 |
| 5 Years | 1,924 | 907 | 976 | 1,118 | 2,398 | 7,323 |
| Total | 17,771 | 7,880 | 5,819 | 4,207 | 2,398 | 38,075 |
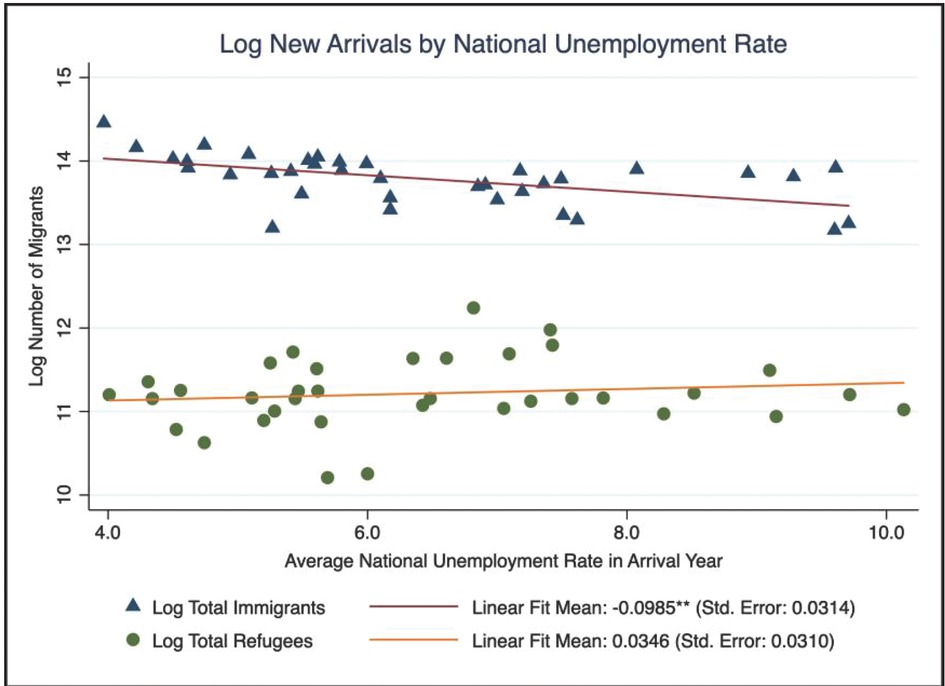
Figure 2
Log new arrivals by National Unemployment Rate (1980–2015).
Log total immigrants are based on author estimates of total immigration by year using IPUMS American Community Survey data for 2011–2016 (Ruggles et al., 2017). Log total refugees are based on estimates of total refugee migration by fiscal year from the Migration Policy Institute (Zong et al., 2017). Regressions are estimates of log totals for each population regressed on annual national unemployment rates for arrival years. Standard errors are clustered at the year-of-arrival level.
Table 3
Test of balance for continuous treatments
| (1) | (2) | |
|---|---|---|
| Arrival | Arrival | |
| National | State | |
| Unemp. rate | Unemp. rate | |
| Age | −0.0012 | −0.0008 |
| (0.0011) | (0.0014) | |
| English fluency | 0.0056 | 0.0224 |
| (0.0396) | (0.0455) | |
| Years of education | 0.0065+ | 0.0050 |
| (0.0035) | (0.0053) | |
| Gender | 0.0107 | −0.0094 |
| (0.0115) | (0.0174) | |
| Disability | 0.0150 | 0.1023 |
| (0.0431) | (0.0686) | |
| Married | 0.0049 | 0.0955* |
| (0.0309) | (0.0410) | |
| Any Children | 0.0240 | 0.0057 |
| (0.0347) | (0.0494) | |
| Country-of-Origin FE | * | * |
| Date-of-Arrival FE | * | |
| Observations | 31,969 | 31,969 |
| Adj. R2 | 0.213 | 0.509 |
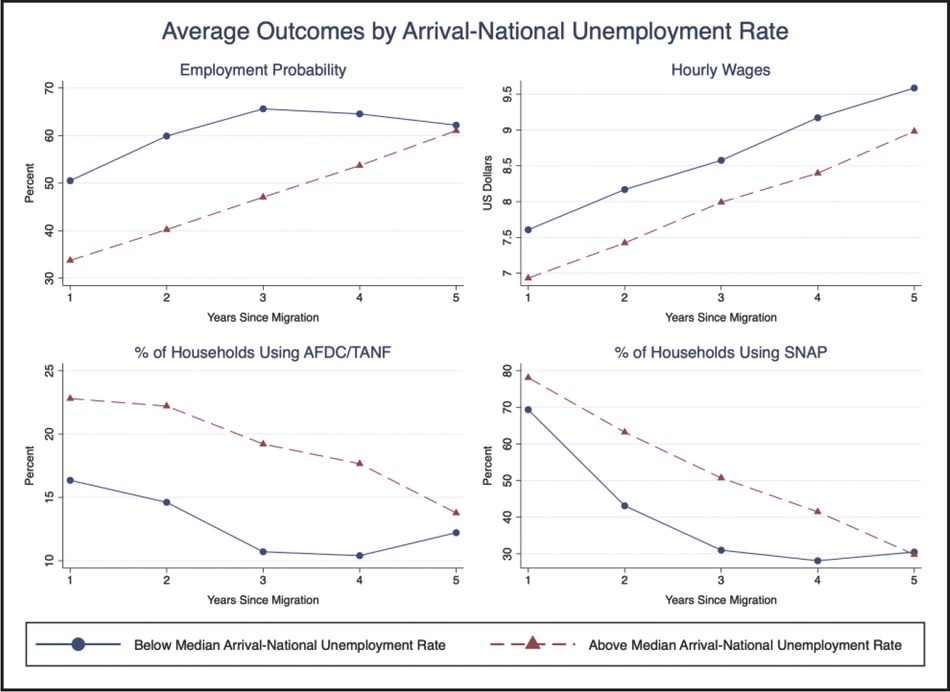
Figure 3
Average outcomes by Arrival-National Unemployment Rate.
Source: I estimated using the Annual Survey of Refugees data. The median arrival-national unemployment rate is 5.9. The gap in the average arrival-national unemployment rate between the aggregate above and below-median groups is roughly two percentage points. Employment is based on a binary variable for employment status. Hourly wages are conditional on employment and measured in real 2000 US dollars. The percentage of households is based on a binary variable defining whether or not at least one member of a household collected a particular benefit (AFDC/TANF, SNAP) in the previous year.
Table 4
Main results
| (1) | (2) | (3) | (4) | |
|---|---|---|---|---|
| Employment | Employment | Log wages | Log wages | |
| ue_i | −0.0157** | −0.0198** | ||
| (0.0055) | (0.0061) | |||
| 1 year, ue_i | 0.0168 | −0.0153+ | ||
| (0.0104) | (0.0087) | |||
| 2 years, ue_i | −0.0113 | −0.0240** | ||
| (0.0073) | (0.0079) | |||
| 3 years, ue_i | −0.0225* | −0.0088 | ||
| (0.0089) | (0.0075) | |||
| 4 years, ue_i | −0.0360*** | −0.0211* | ||
| (0.0081) | (0.0091) | |||
| 5 years, ue_i | −0.0208* | −0.0251** | ||
| (0.0085) | (0.0090) | |||
| Observations | 31,815 | 31,815 | 13,772 | 13,772 |
| Adj. R2 | 0.202 | 0.203 | 0.251 | 0.251 |
Table 5
Main results by gender
| (1) | (2) | (3) | (4) | (5) | (6) | (7) | (8) | |
|---|---|---|---|---|---|---|---|---|
| Male | Male | Male | Male | Female | Female | Female | Female | |
| Employment | Employment | Log wages | Log wages | Employment | Employment | Log wages | Log wages | |
| ue_i | -0.0170* | -0.0201** | -0.0143* | -0.0198** | ||||
| (0.0068) | (0.0075) | (0.0070) | (0.0071) | |||||
| 1 year, ue_i | 0.0044 | -0.0161 | 0.0293* | -0.0153 | ||||
| (0.0132) | (0.0114) | (0.0119) | (0.0100) | |||||
| 2 years, ue_i | -0.0153 | -0.0270** | -0.0072 | -0.0216* | ||||
| (0.0099) | (0.0104) | (0.0089) | (0.0101) | |||||
| 3 years, ue_i | -0.0258* | -0.0030 | -0.0190+ | -0.0171* | ||||
| (0.0104) | (0.0100) | (0.0113) | (0.0087) | |||||
| 4 years, ue_i | -0.0293** | -0.0198+ | -0.0429*** | -0.0218+ | ||||
| (0.0097) | (0.0107) | (0.0117) | (0.0112) | |||||
| 5 years, ue_i | -0.0169 | -0.0285* | -0.0240* | -0.0208+ | ||||
| (0.0112) | (0.0111) | (0.0112) | (0.0115) | |||||
| Observations | 15,748 | 15,748 | 7,504 | 7,504 | 16,067 | 16,067 | 6,268 | 6,268 |
| Adj. R2 | 0.203 | 0.203 | 0.248 | 0.249 | 0.191 | 0.192 | 0.232 | 0.232 |
Table 6
Welfare utilization
| (1) | (2) | (3) | (4) | |
|---|---|---|---|---|
| AFDC/TANF | AFDC/TANF | SNAP | SNAP | |
| ue_i | −0.0019 | 0.0094 | ||
| (0.0067) | (0.0080) | |||
| 1 year, ue_i | −0.0286* | −0.0416** | ||
| (0.0126) | (0.0157) | |||
| 2 years, ue_i | 0.0098 | 0.0133 | ||
| (0.0111) | (0.0140) | |||
| 3 years, ue_i | −0.0026 | 0.0199+ | ||
| (0.0095) | (0.0119) | |||
| 4 years, ue_i | 0.0109 | 0.0372** | ||
| (0.0085) | (0.0129) | |||
| 5 years, ue_i | −0.0052 | 0.0101 | ||
| (0.0096) | (0.0133) | |||
| Observations | 31,751 | 31,751 | 31,780 | 31,780 |
| Adj. R2 | 0.186 | 0.187 | 0.281 | 0.283 |
Table 7
Heterogeneity within employment estimates
| (1) | (2) | (3) | (4) | (5) | (6) | |
|---|---|---|---|---|---|---|
| No HS | HS | College | No HS | HS | College | |
| Males | Males | Males | Females | Females | Females | |
| ue_i | −0.0149 | −0.0190+ | −0.0101 | 0.0032 | −0.0352** | −0.0423+ |
| (0.0094) | (0.0099) | (0.0231) | (0.0100) | (0.0107) | (0.0246) | |
| Observations | 6,596 | 7,762 | 1,390 | 7,980 | 6,984 | 1,103 |
| Adj. R2 | 0.177 | 0.187 | 0.270 | 0.165 | 0.185 | 0.224 |
| (1) | (2) | (3) | (4) | (5) | (6) | |
|---|---|---|---|---|---|---|
| No HS | HS | College | No HS | HS | College | |
| Males | Males | Males | Females | Females | Females | |
| 1 year, ue_i | 0.0130 | 0.0143 | −0.0632 | 0.0627*** | 0.0093 | −0.0856+ |
| (0.0206) | (0.0169) | (0.0433) | (0.0161) | (0.0198) | (0.0478) | |
| 2 years, ue_i | −0.0078 | −0.0131 | −0.0373 | 0.0081 | −0.0224 | −0.0118 |
| (0.0148) | (0.0143) | (0.0330) | (0.0128) | (0.0148) | (0.0353) | |
| 3 years, ue_i | −0.0339* | −0.0246 | 0.0050 | −0.0031 | −0.0347* | −0.0582+ |
| (0.0151) | (0.0151) | (0.0303) | (0.0155) | (0.0158) | (0.0307) | |
| 4 years, ue_i | −0.0226 | −0.0463*** | 0.0400 | −0.0382* | −0.0596*** | −0.0317 |
| (0.0143) | (0.0127) | (0.0324) | (0.0160) | (0.0158) | (0.0385) | |
| 5 years, ue_i | −0.0210 | −0.0202 | 0.0101 | −0.0054 | −0.0549*** | −0.0357 |
| (0.0175) | (0.0148) | (0.0367) | (0.0162) | (0.0149) | (0.0472) | |
| Observations | 6,596 | 7,762 | 1,390 | 7,980 | 6,984 | 1,103 |
| Adj. R2 | 0.178 | 0.187 | 0.271 | 0.168 | 0.186 | 0.223 |
Table 8
Heterogeneity within log wage estimates
| (1) | (2) | (3) | (4) | (5) | (6) | |
|---|---|---|---|---|---|---|
| No HS | HS | College | No HS | HS | College | |
| Males | Males | Males | Females | Females | Females | |
| ue_i | −0.0070 | −0.0282** | −0.0668** | −0.0191* | −0.0082 | −0.0799* |
| (0.0094) | (0.0098) | (0.0251) | (0.0076) | (0.0097) | (0.0321) | |
| Observations | 2,634 | 4,224 | 646 | 2,641 | 3,194 | 433 |
| Adj. R2 | 0.200 | 0.276 | 0.236 | 0.196 | 0.223 | 0.205 |
| (1) | (2) | (3) | (4) | (5) | (6) | |
|---|---|---|---|---|---|---|
| No HS | HS | College | No HS | HS | College | |
| Males | Males | Males | Females | Females | Females | |
| 1 year, ue_i | −0.0011 | −0.0150 | −0.0967** | −0.0071 | 0.0026 | −0.1520** |
| (0.0161) | (0.0164) | (0.0340) | (0.0123) | (0.0146) | (0.0510) | |
| 2 years, ue_i | −0.0001 | −0.0385** | −0.0641+ | −0.0191+ | −0.0096 | −0.0455 |
| (0.0149) | (0.0136) | (0.0373) | (0.0105) | (0.0149) | (0.0465) | |
| 3 years, ue_i | −0.0007 | −0.0067 | −0.0480 | −0.0368*** | 0.0064 | −0.0746+ |
| (0.0130) | (0.0129) | (0.0352) | (0.0109) | (0.0112) | (0.0443) | |
| 4 years, ue_i | −0.0097 | −0.0251+ | −0.0466 | −0.0214+ | −0.0197 | −0.0116 |
| (0.0143) | (0.0133) | (0.0466) | (0.0119) | (0.0154) | (0.0506) | |
| 5 years, ue_i | −0.0190 | −0.0420** | −0.0741 | −0.0111 | −0.0123 | −0.1264* |
| (0.0167) | (0.0136) | (0.0475) | (0.0146) | (0.0149) | (0.0572) | |
| Observations | 2,634 | 4,224 | 646 | 2,641 | 3,194 | 433 |
| Adj. R2 | 0.199 | 0.276 | 0.232 | 0.197 | 0.223 | 0.211 |
Table 9
Summary statistics by years since migration
| Above median | 1 | 2 | 3 | 4 | 5 | All |
|---|---|---|---|---|---|---|
| Years of education | 10.80 | 10.84 | 10.73 | 10.34 | 10.04 | 10.58 |
| % Female | 51.33 | 51.24 | 50.96 | 49.41 | 50.89 | 50.79 |
| Age at arrival | 34.29 | 33.74 | 32.94 | 32.00 | 31.56 | 33.01 |
| % Fluent in English | 9.16 | 6.86 | 8.50 | 8.39 | 6.63 | 7.97 |
| % Disabled | 10.85 | 11.55 | 10.88 | 10.43 | 11.17 | 10.98 |
| % Married | 62.61 | 61.99 | 61.92 | 60.01 | 60.96 | 61.55 |
| % Have children | 63.50 | 62.18 | 62.76 | 61.64 | 60.35 | 62.17 |
| Below median | 1 | 2 | 3 | 4 | 5 | All |
| Years of education | 10.34 | 10.83 | 10.84 | 10.87 | 10.63 | 10.72 |
| % Female | 50.28 | 50.62 | 51.32 | 50.39 | 50.62 | 50.67 |
| Age at arrival | 34.78 | 34.53 | 33.94 | 33.47 | 32.23 | 33.71 |
| % Fluent in English | 8.71 | 8.33 | 6.74 | 5.29 | 4.94 | 6.66 |
| % Disabled | 14.00 | 13.70 | 12.32 | 11.81 | 10.06 | 12.25 |
| % Married | 56.30 | 58.45 | 58.74 | 57.19 | 55.33 | 57.22 |
| % Have children | 57.51 | 54.33 | 54.40 | 54.33 | 56.37 | 55.31 |
Table 10
Test for changes in composition
| (1) | (2) | (3) | (4) | |
|---|---|---|---|---|
| Employment | Employment | Log wages | Log wages | |
| ue_i | 0.0052* | 0.0010 | ||
| (0.0023) | (0.0015) | |||
| 1 year, ue_i | −0.0092* | −0.0003 | ||
| (0.0044) | (0.0026) | |||
| 2 years, ue_i | 0.0026 | 0.0014 | ||
| (0.0027) | (0.0017) | |||
| 3 years, ue_i | 0.0045 | 0.0003 | ||
| (0.0028) | (0.0019) | |||
| 4 years, ue_i | 0.0079* | −0.0009 | ||
| (0.0034) | (0.0021) | |||
| 5 years, ue_i | 0.0155*** | 0.0035+ | ||
| (0.0038) | (0.0020) | |||
| Observations | 31,974 | 31,974 | 31,974 | 31,974 |
| Adj. R2 | 0.077 | 0.078 | 0.197 | 0.197 |
Table 11
Main results for non-movers
| (1) | (2) | (3) | (4) | |
|---|---|---|---|---|
| Employment | Employment | Log wages | Log wages | |
| ue_i | −0.0227** | −0.0263*** | ||
| (0.0071) | (0.0078) | |||
| 1 year, ue_i | 0.0213 | −0.0275* | ||
| (0.0145) | (0.0128) | |||
| 2 years, ue_i | −0.0012 | −0.0311** | ||
| (0.0095) | (0.0106) | |||
| 3 years, ue_i | −0.0380** | −0.0135 | ||
| (0.0130) | (0.0111) | |||
| 4 years, ue_i | −0.0538*** | −0.0330** | ||
| (0.0120) | (0.0115) | |||
| 5 years, ue_i | −0.0345** | −0.0229* | ||
| (0.0114) | (0.0115) | |||
| Observations | 18,289 | 18,289 | 8,190 | 8,190 |
| Adj. R2 | 0.192 | 0.193 | 0.246 | 0.246 |
Table 12
State unemployment estimates
| (1) | (2) | (3) | (4) | |
|---|---|---|---|---|
| Employment | Employment | Log wages | Log wages | |
| ue_si | 0.0049 | −0.0140* | ||
| (0.0067) | (0.0060) | |||
| 1 year, ue_si | 0.0017 | −0.0249*** | ||
| (0.0085) | (0.0071) | |||
| 2 years, ue_si | −0.0080 | −0.0238*** | ||
| (0.0075) | (0.0071) | |||
| 3 years, ue_si | 0.0046 | −0.0153* | ||
| (0.0076) | (0.0068) | |||
| 4 years, ue_si | 0.0071 | −0.0117+ | ||
| (0.0076) | (0.0066) | |||
| 5 years, ue_si | 0.0137+ | −0.0067 | ||
| (0.0072) | (0.0063) | |||
| Observations | 31,815 | 31,815 | 13,772 | 13,772 |
| Adj. R2 | 0.221 | 0.221 | 0.278 | 0.278 |
Table 13
State unemployment estimates using pioneers
| Nationality-by-state pioneers | ||
|---|---|---|
| (1) | (2) | |
| Employment | Log wages | |
| ue_si | −0.0048 | −0.0359+ |
| (0.0155) | (0.0183) | |
| Observations | 4,800 | 2,169 |
| Adj. R2 | 0.292 | 0.332 |
| 1 year, ue_si | 0.0148 | −0.0579* |
| (0.0237) | (0.0242) | |
| 2 years, ue_si | −0.0114 | −0.0408+ |
| (0.0181) | (0.0225) | |
| 3 years, ue_si | −0.0006 | −0.0368+ |
| (0.0174) | (0.0204) | |
| 4 years, ue_si | −0.0026 | −0.0325 |
| (0.0177) | (0.0200) | |
| 5 years, ue_si | −0.0143 | −0.0323+ |
| (0.0170) | (0.0187) | |
| Observations | 4,800 | 2,169 |
| Adj. R2 | 0.293 | 0.332 |
[i] +0.1; *0.05; **0.01; ***0.001.
Note: Nationality-by-state Pioneers are refugees who are resettled in a particular state within 2 years of their nationality’s first appearance in that state either in the data or in previous ORR Annual reports.
Standard errors are clustered at the state-of-placement-by-date-of-arrival level.
Table 14
State unemployment estimates using pioneers
| Nationality pioneers | ||
|---|---|---|
| (3) | (4) | |
| Employment | Log wages | |
| ue_si | −0.0314 | −0.1250** |
| (0.0259) | (0.0419) | |
| Observations | 1,739 | 681 |
| Adj. R2 | 0.298 | 0.347 |
| 1 year, ue_si | 0.0028 | −0.1322+ |
| (0.0440) | (0.0713) | |
| 2 years, ue_si | −0.0621* | −0.1058* |
| (0.0312) | (0.0513) | |
| 3 years, ue_si | −0.0305 | −0.1321** |
| (0.0289) | (0.0461) | |
| 4 years, ue_si | −0.0241 | −0.1387** |
| (0.0313) | (0.0419) | |
| 5 years, ue_si | −0.0582+ | −0.1245** |
| (0.0306) | (0.0445) | |
| Observations | 1,739 | 681 |
| Adj. R2 | 0.300 | 0.343 |
[i] +0.1; *0.05; **0.01; ***0.001.
Note: Nationality Pioneers are refugees who are resettled within 2 years of their nationality’s first appearance in the US in general, either in the data or in previous ORR Annual reports.
Standard errors are clustered at the state-of-placement-by-date-of-arrival level.
Table A1
Employment estimates-national unemployment rate treatment (robustness table for results found in Column 2 of Table 3)
| (1) | (2) | (3) | (4) | (5) | (6) | (7) | (8) | |
|---|---|---|---|---|---|---|---|---|
| 1 year, ue_i | 0.0078 | 0.0035 | 0.0041 | 0.0057 | 0.0073 | 0.0105 | 0.0151 | 0.0168 |
| (0.0107) | (0.0106) | (0.0106) | (0.0106) | (0.0105) | (0.0106) | (0.0104) | (0.0104) | |
| 2 years, ue_i | -0.0087 | -0.0149+ | -0.0145+ | -0.0139+ | -0.0141+ | -0.0142+ | -0.0117 | -0.0113 |
| (0.0080) | (0.0077) | (0.0076) | (0.0076) | (0.0076) | (0.0074) | (0.0074) | (0.0073) | |
| 3 years, ue_i | -0.0183* | -0.0234* | -0.0232* | -0.0230* | -0.0224* | -0.0249** | -0.0228* | -0.0225* |
| (0.0091) | (0.0091) | (0.0091) | (0.0091) | (0.0090) | (0.0091) | (0.0090) | (0.0089) | |
| 4 years, ue_i | -0.0285*** | -0.0331*** | -0.0322*** | -0.0332*** | -0.0326*** | -0.0366*** | -0.0359*** | -0.0360*** |
| (0.0083) | (0.0083) | (0.0082) | (0.0082) | (0.0082) | (0.0082) | (0.0082) | (0.0081) | |
| 5 years, ue_i | -0.0055 | -0.0129 | -0.0129 | -0.0144+ | -0. 0148+ | -0.0210* | -0.0212* | -0.0208* |
| (0.0091) | (0.0089) | (0.0088) | (0.0087) | (0.0086) | (0.0087) | (0.0085) | (0.0085) | |
| Country of origin | * | * | * | * | * | * | * | * |
| Years of education | * | * | * | * | * | * | * | |
| Gender | * | * | * | * | * | * | ||
| Age | * | * | * | * | * | |||
| English at arrival | * | * | * | * | ||||
| Disabled at arrival | * | * | * | |||||
| Married at arrival | * | * | ||||||
| Any children at arrival | * | |||||||
| Years since migration FE | * | * | * | * | * | * | * | * |
| Contemp. year FE | * | * | * | * | * | * | * | * |
| Month of arrival FE | * | * | * | * | * | * | * | * |
| Contemp. state UR | -0.0541*** | -0.0539*** | -0.0540*** | -0.0535*** | -0.0536*** | -0.0518*** | -0.0530*** | -0.0529*** |
| (0.0039) | (0.0037) | (0.0037) | (0.0037) | (0.0037) | (0.0038) | (0.0039) | (0.0039) | |
| Observations | 31,815 | 31,815 | 31,815 | 31,815 | 31,815 | 31,815 | 31,815 | 31,815 |
| Adj. R2 | 0.116 | 0.161 | 0.170 | 0.174 | 0.175 | 0.195 | 0.201 | 0.203 |
Table A2
Log wage estimates—national unemployment rate treatment (robustness table for results found in column 4 of Table 3)
| (1) | (2) | (3) | (4) | (5) | (6) | (7) | (8) | |
|---|---|---|---|---|---|---|---|---|
| 1 year, ue_si | -0.0215* | -0.0221* | -0.0200* | -0.0199* | -0.0182* | -0.0181* | -0.0153+ | -0.0153+ |
| (0.0095) | (0.0088) | (0.0087) | (0.0088) | (0.0087) | (0.0087) | (0.0087) | (0.0087) | |
| 2 years, ue_si | -0.0234** | -0.0251** | -0.0243** | -0.0246** | -0.0252** | -0.0253** | -0.0240** | -0.0240** |
| (0.0087) | (0.0080) | (0.0080) | (0.0081) | (0.0080) | (0.0080) | (0.0079) | (0.0079) | |
| 3 years, ue_si | -0.0089 | -0.0099 | -0.0097 | -0.0098 | -0.0092 | -0.0092 | -0.0088 | -0.0088 |
| (0.0083) | (0.0075) | (0.0076) | (0.0076) | (0.0076) | (0.0076) | (0.0075) | (0.0075) | |
| 4 years, ue_si | -0.0218* | -0.0199* | -0.0201* | -0.0207* | -0.0203* | -0.0205* | -0.0211* | -0.0211* |
| (0.0097) | (0.0091) | (0.0091) | (0.0091) | (0.0091) | (0.0091) | (0.0091) | (0.0091) | |
| 5 years, ue_si | -0.0181+ | -0.0205* | -0.0222* | -0.0227* | -0.0237** | -0.0239** | -0.0251** | -0.0251** |
| (0.0095) | (0.0092) | (0.0090) | (0.0090) | (0.0089) | (0.0090) | (0.0090) | (0.0090) | |
| Country of origin | * | * | * | * | * | * | * | * |
| Years of education | * | * | * | * | * | * | * | |
| Gender | * | * | * | * | * | * | ||
| Age | * | * | * | * | * | |||
| English at arrival | * | * | * | * | ||||
| Disabled at arrival | * | * | * | |||||
| Married at arrival | * | * | ||||||
| Any children at arrival | * | |||||||
| Years since migration FE | * | * | * | * | * | * | * | * |
| Contemp. year FE | * | * | * | * | * | * | * | * |
| Month of arrival FE | * | * | * | * | * | * | * | * |
| Contemp. state UR | -0.0183*** | -0.0190*** | -0.0200*** | -0.0204*** | -0.0205*** | -0.0205*** | -0.0204*** | -0.0204*** |
| (0.0036) | (0.0036) | (0.0035) | (0.0035) | (0.0035) | (0.0035) | (0.0035) | (0.0035) | |
| Observations | 13,772 | 13,772 | 13,772 | 13,772 | 13,772 | 13,772 | 13,772 | 13,772 |
| Adj. R2 | 0.178 | 0.221 | 0.243 | 0.244 | 0.247 | 0.247 | 0.251 | 0.251 |