
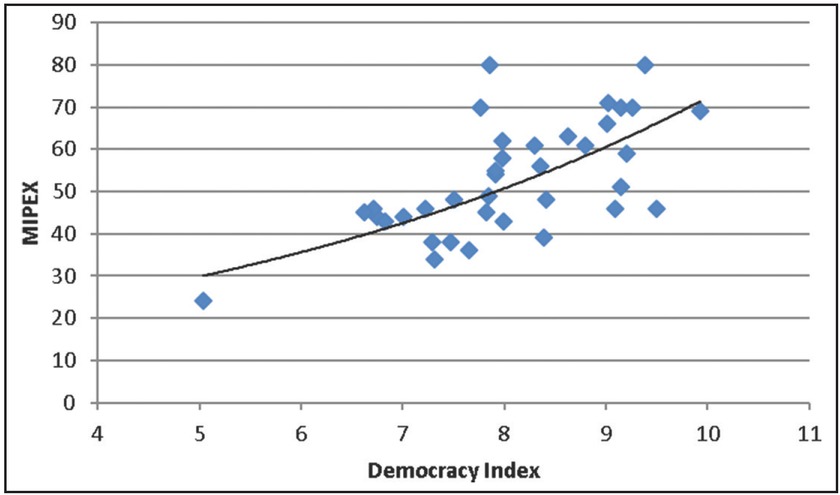
Figure 1
Relation between democracy in host countries and rights of admitted migrants.
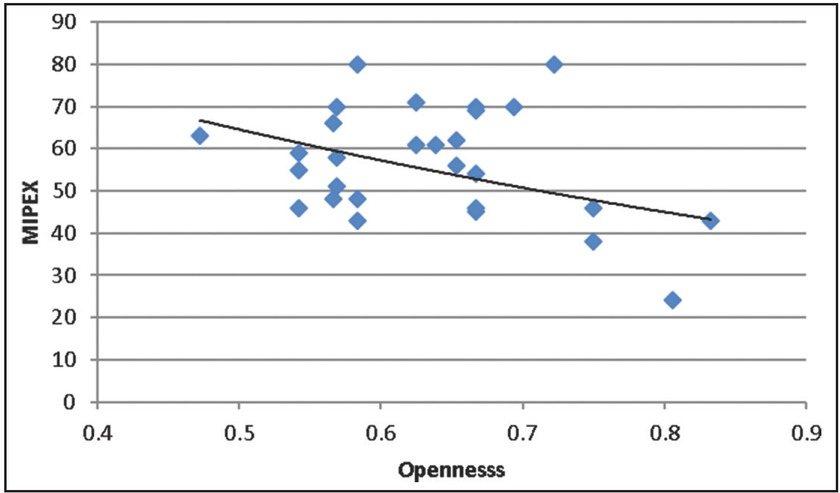
Figure 2
Relation between rights of migrants and openness.
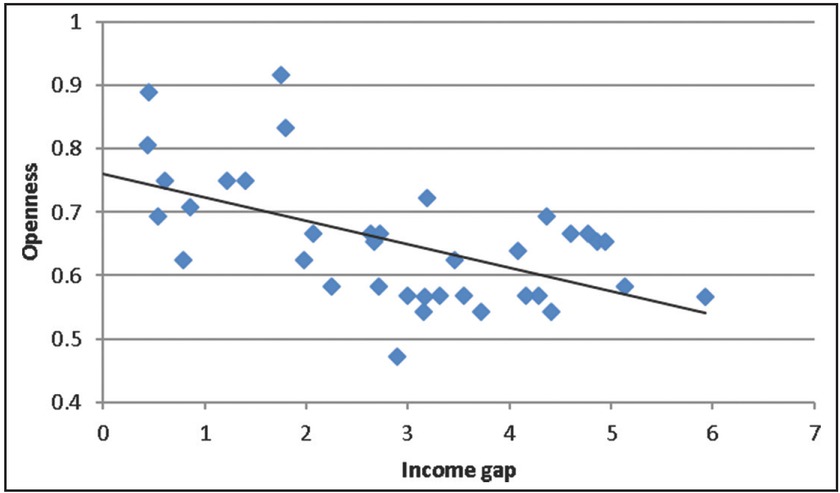
Figure 3
Relationship between openness and the income gap.
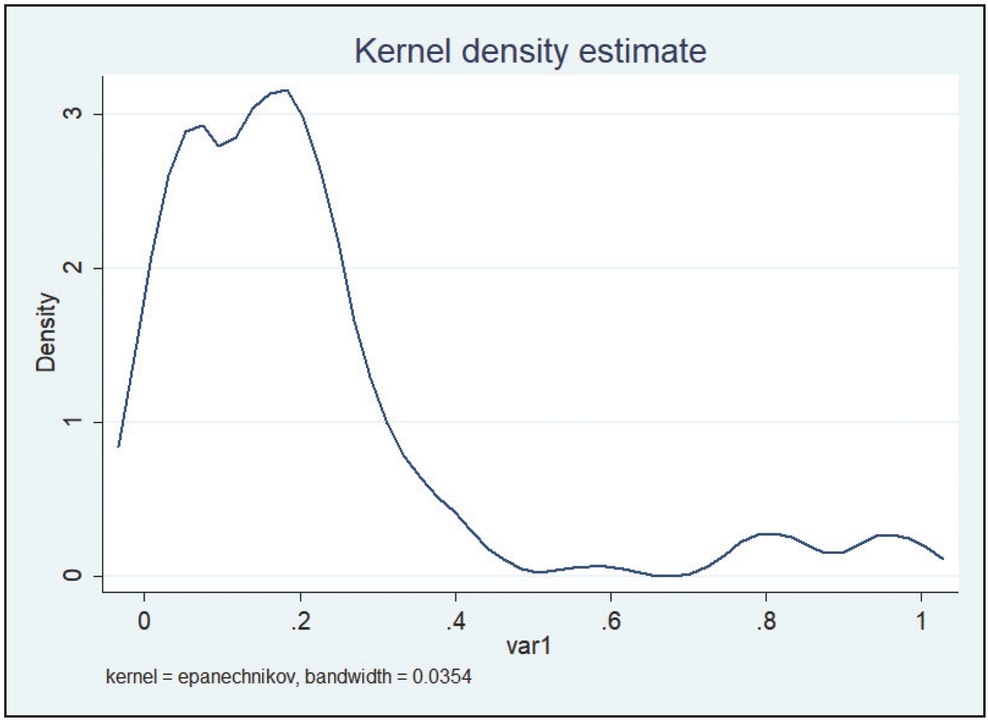
Figure 4
Kernel distribution of the normalized income levels difference index.
Note: var1 describes the differences in GDP per capita (in PPP) between two partner countries relative to the differences between the richest and poorest country in the world in the year being considered. The variable has been estimated for each five-year period. The vertical axis describes the number of BLAs per income gap.
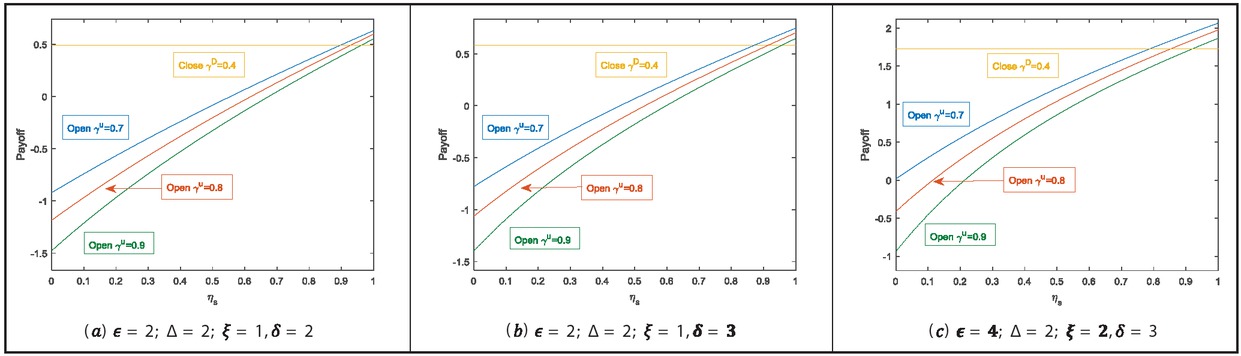
Figure 5
HD (γD,ηS,η) and HD (γD) functions for ηS = 1 – η.
Table 1
ηs thresholds obtained for different (ϵ;Δ;ξ,δ) variables and (γD,γU) values.
| Threshold values | γU = 0.7 | γU = 0.8 | γU = 0.9 |
|---|---|---|---|
| (ϵ = 2;Δ = 2,ξ =1;δ = 2) | 0.9 | 0.931 | 0.964 |
| (ϵ = 2;Δ = 2,ξ =1;δ = 3) | 0.87 | 0.913 | 0.955 |
| (ϵ = 4;Δ = 2,ξ = 2;δ = 3) | 0.79 | 0.855 | 0.922 |
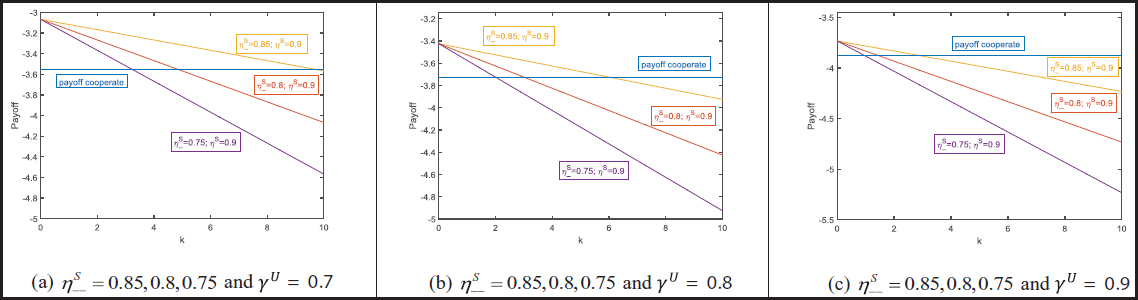
Figure 6
HU (γU, ηS, η) and when ηS = 0.9 and In order to simplify the presentation, we have assumed: ϵ = 4; Δ = 2; ξ = 2; δ = 3, for all developing countries.