
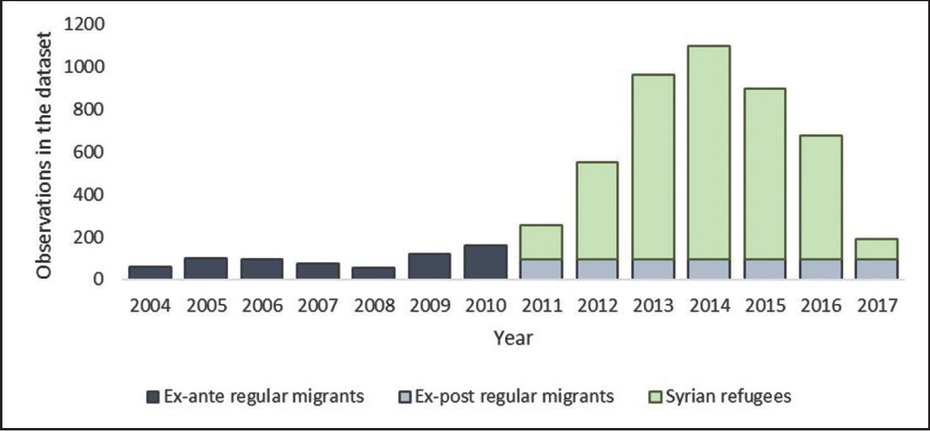
Figure 1
Number of foreign-born individuals in Turkey by the year of arrival, 2004–2017.
Sources: Household Labour Force Survey 2017 and author’s own calculations.
Notes: The figure shows the number of foreign-born observations living in Turkey. “Syrian refugees” are obtained by subtracting the average number of foreign-born individuals during the 2004–2010 period (the so-called ex-ante standard migrants) from the total number of observations in each of the years between 2011 and 2017 (ex-post migrants).
Table 1
Summary statistics at the family level: before matching
| Variable | Migrant families (2004–2010) | Migrants families (2011–2017) | Ratio (ex-post/ex-ante) |
|---|---|---|---|
| Family size | 1.68 | 3.34 | 2.00 |
| Proportion of 0–14 | 0.09 | 0.20 | 2.23 |
| Proportion of 15–24 | 0.16 | 0.24 | 1.50 |
| Proportion of 15+ women | 0.75 | 0.63 | 0.83 |
| Existence of a widow | 0.03 | 0.08 | 2.37 |
| Existence tertiary educ. | 0.41 | 0.23 | 0.55 |
| Existence of 15–24 students | 0.15 | 0.10 | 0.65 |
| Existence of 15+ female workers | 0.27 | 0.13 | 0.50 |
| Proportion of 15+ NEETs | 0.50 | 0.59 | 1.18 |
| Existence of workers | 0.42 | 0.55 | 1.31 |
| Number of informal workers | 0.18 | 0.63 | 3.50 |
| Existence of male garment workers | 0.02 | 0.11 | 6.61 |
| Existence of non-migrants | 0.57 | 0.27 | 0.47 |
[i] Sources: Household Labour Force Survey 2017 and author’s own calculations.
Notes: The table shows averages at the family level for a number of variables. The wording “existence” refers to the existence of at least one person with the mentioned characteristic in the household. In all cases, it can be rejected that the difference in means is equal to zero at the 95% confidence level.
Table 2
Variable description
| Mnemonic | Short description | Full description |
|---|---|---|
| kids | Prop. 0–14 | Proportion of people aged 0–14 in the family. |
| young | Prop. 15–24 | Proportion of people aged 15–24 in the family. |
| women | Prop. 15+ women | Proportion of women among 15+ family members. |
| widow | Exist widows | Existence of at least one widow in the family. |
| university | Exist 15+ tertiary educ. | Existence of at least one 15+ university graduate. |
| student | Exist 15–24 students | Existence of at least one student aged 15–24. |
| fem work | Exist 15+ female workers | Existence of at least one working women. |
| NEET | Prop. 15+ NEETs | Proportion of NEETs among 15+ family members. |
| workers | Exist workers | Existence of at least one 15+ worker in the family. |
| informal | Number informal workers | Number of 15+ informal workers in the family. |
| garment | Exist male garment worker | Existence of at least one 15+ male garment worker. |
| turkish | Exist nonmigrants | Existence of at least one nonmigrant in the family. |
[i] Sources: Household Labour Force Survey 2017 and author’s own calculations.
Note: The table describes the variables used in Equation (1).
Table 3
Estimates of the probability of being a “standard” migrant family, marginal effects
| Variable | Marginal effect | Variable | Marginal effect |
|---|---|---|---|
| Prop. 0–14 | −0.05 | Exist 15+ female workers | 0.10*** |
| Prop. 15–24 | −0.19*** | Prop. 15+ NEETs | −0.15*** |
| Prop. 15+ women | 0.02 | Exist 15+ workers | −0.09** |
| Exist widows | −0.04 | Number of informal workers | −0.10*** |
| Exist 15+ tertiary education | 0.05** | Exist male garment worker | −0.07 |
| Exist 15–24 students | 0.12** | Exist nonmigrants | 0.12*** |
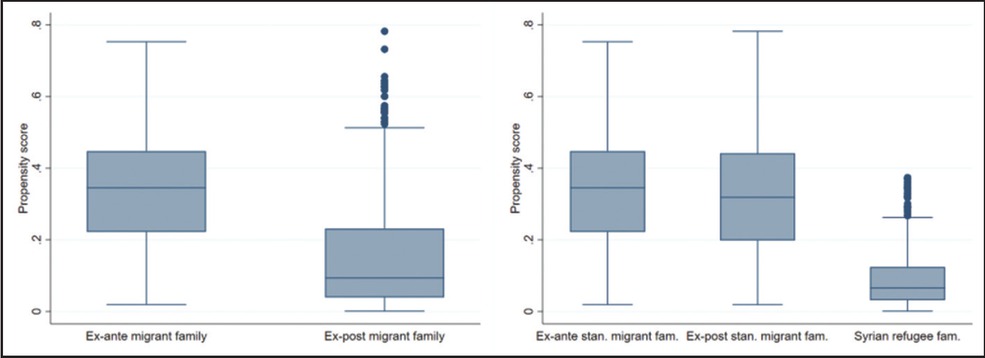
Figure 2
Propensity scores, before and after matching: (a) before matching and (b) after matching.
Sources: Household Labour Force Survey 2017 and author’s own calculations.
Notes: The box plots show propensity scores distributions. The three horizontal lines of the blue boxes denote the third quantile, the median, and the first quantile, from top to bottom. (a) shows the distribution before matching for foreign-born families who arrived, respectively, between 2004 and 2010 and between 2011 and 2017. (b) splits the scores of 2011–2017 migrant families between those families matched (ex-post “standard” migrant families) and those unmatched (Syrian families).
Table 4
Summary statistics at the family level: after matching
| Variable | “Standard” migrant families (2004–2010) | “Standard” migrant families (2011–2017) | Syrian families |
|---|---|---|---|
| Family size | 1.67 | 1.91 | 3.88 |
| Proportion of 0–14 | 0.09 | 0.09 | 0.25 |
| Proportion of 15–24 | 0.16 | 0.15 | 0.27 |
| Proportion of 15+ women | 0.75 | 0.77 | 0.57 |
| Existence of a widow | 0.03 | 0.04 | 0.09 |
| Existence tertiary educ. | 0.41 | 0.38 | 0.17 |
| Existence of 15–24 students | 0.14 | 0.14 | 0.07 |
| Existence of 15+ female workers | 0.26 | 0.25 | 0.07 |
| Proportion of 15+ NEETs | 0.50 | 0.51 | 0.62 |
| Existence of workers | 0.42 | 0.39 | 0.61 |
| Number of informal workers | 0.18 | 0.16 | 0.81 |
| Existence of male garment workers | 0.02 | 0.02 | 0.14 |
| Existence of non-migrants | 0.57 | 0.55 | 0.16 |
[i] Notes: The table shows averages for a number of variables at the family level. The term “existence” refers to the existence of at least one person with the mentioned characteristic. In all cases, it can be rejected that the difference in means between Syrian families and ex-post “standard” migrant families is equal to zero at the 95% confidence level.
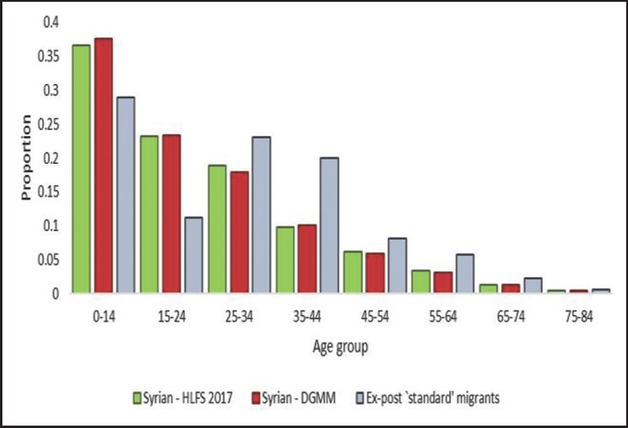
Figure 3
Syrian refugees’ population pyramid, HLFS vs. DGMM.
Sources: Household Labour Force Survey 2017, Directorate General of Migration Management, and author’s own calculations.
Notes: The figure shows the proportion of Syrian refugees in a number of age groups from two sources: the HLFS 2017 and the DGMM. A chi-square test cannot reject that the HLFS and DGMM data are drawn from the same distribution. It also shows the proportion of ex-post “standard” migrants for comparison.
Table A1
Construction of the variable ‘year of arrival to Turkey’.
| Year of arrival | Variable | Subpopulation | Observed HLFS 2017 |
|---|---|---|---|
| buil yil | dogum yer=Abroad | 8,310 | |
| buil yasama=No* | |||
| onceki ikamet=Abroad | |||
| tr yil | dogum yer=Abroad | 1,377 | |
| buil yasama=No | |||
| onceki ikamet=Turkey | |||
| yurtdisi durum=Yes |
[i] Notes: *In practice, it is not possible for a person born abroad to have lived permanently in the same Turkish province his/her whole life. There is only one observation (out of 10,032) in the 2017 HLFS for which a Yes is recorded in ‘buil yasama’ despite being born abroad and it is disregarded.
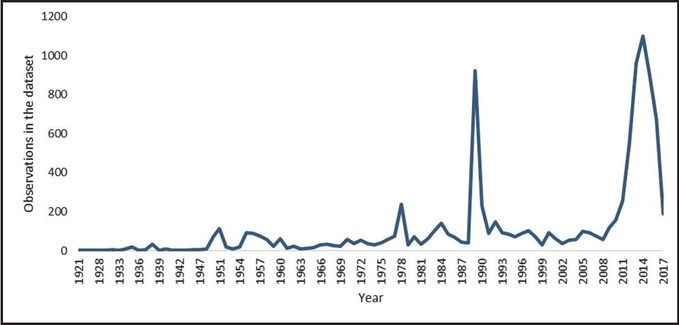
Figure A1
Born abroad by year of arrival to Turkey.
Table B1
Re-weighting by subregion (NUTS-2), 2017 HLFS
| Turkish | Syrian refugees | |||
|---|---|---|---|---|
| Subregion | Provinces | Adj. factor | Inv. prob. | Adj. weight |
| İstanbul | İstanbul | 1.0203 | 338 | 1,511 |
| Tekirdağ | Tekirdağ, Edirne, Kırklareli | 1.0024 | 109 | 485 |
| Balıkesir | Balıkesir, Ç anakkale | 1.0020 | 96 | 428 |
| İzmir | İzmir | 1.0076 | 196 | 876 |
| Aydın | Aydın, Denizli, Mŭgla | 1.0079 | 157 | 700 |
| Manisa | Manisa, Afyon, Kütahya, Uşak | 1.0041 | 171 | 765 |
| Bursa | Bursa, Eskişehir, Bilecik | 1.0207 | 195 | 871 |
| Kocaeli | Kocaeli, Sakarya, Düzce, Bolu, Yalova | 1.0032 | 188 | 838 |
| Ankara | Ankara | 1.0077 | 192 | 856 |
| Konya | Konya, Karaman | 1.0429 | 83 | 370 |
| Antalya | Antalya, Isparta, Burdur | 1.0081 | 166 | 743 |
| Adana | Adana, Mersin | 1.0268 | 183 | 817 |
| Hatay | Hatay, Kahramanmaraş, Osmaniye | 1.0143 | 187 | 837 |
| Kırıkkale | Kırıkkale, Aksaray | 1.0263 | 85 | 378 |
| Niğde, Nevşehir, Kırşehir | ||||
| Kayseri | Kayseri, Sivas, Yozgat | 1.0075 | 160 | 716 |
| Zonguldak | Zonguldak, Karabük, Bartın | 1.0008 | 110 | 490 |
| Kastamonu | Kastamonu, Ç ankırı, Sinop | 1.0029 | 55 | 246 |
| Samsun | Samsun, Tokat, Ç orum, Amasya | 1.0026 | 139 | 620 |
| Trabzon | Trabzon, Ordu, Giresun Rize, Artvin, Gümüşhane | 1.0003 | 124 | 552 |
| Erzurum | Erzurum, Erzincan, Bayburt | 1.0016 | 75 | 335 |
| Ağrı | Ağrı, Kars, Iğdır, Ardahan | 1.0009 | 77 | 343 |
| Malatya | Malatya, Elazığ, Bingöl, Tunceli | 1.0008 | 120 | 537 |
| Van | Van, Muş, Bitlis, Hakkâri | 1.0004 | 92 | 411 |
| Gaziantep | Gaziantep, Adıyaman, Kilis | 1.0255 | 144 | 642 |
| Şanlıurfa | Şanlıurfa, Diyarbakır | 1.0161 | 177 | 791 |
| Mardin | Mardin, Batman, Şırnak, Siirt | 1.0019 | 159 | 711 |
Table C1
Syrian refugees under temporary protection in Turkey by subregion (NUTS-2), 2017
| Syrian refugees in Turkey | ||||
|---|---|---|---|---|
| Subregion | Provinces | Official | HLFS estimated | Difference |
| İstanbul | İstanbul | 497,135 | 1,148,199 | 651,064 |
| Bursa | Bursa, Eskişehir, Bilecik | 113,989 | 260,277 | 146,288 |
| Konya | Konya, Karaman | 76,744 | 198,198 | 121,454 |
| Kırıkkale | Kırıkkale, Aksaray | 15,055 | 80,724 | 65,669 |
| Niğde, Nevşehir, Kırşehir | ||||
| Adana | Adana, Mersin | 308,641 | 358,830 | 50,189 |
| Antalya | Antalya, Isparta, Burdur | 15,438 | 60,270 | 44,832 |
| Aydın | Aydın, Denizli, Mŭgla | 26,483 | 69,100 | 42,617 |
| Manisa | Manisa, Afyon, Kütahya, Uşak | 13,554 | 54,504 | 40,950 |
| Ankara | Ankara | 75,881 | 111,672 | 35,791 |
| Samsun | Samsun, Tokat, Ç orum, Amasya | 7,579 | 29,328 | 21,749 |
| Erzurum | Erzurum, Erzincan, Bayburt | 950 | 9,483 | 8,533 |
| Kastamonu | Kastamonu, Ç ankırı, Sinop | 1,449 | 8,748 | 7,299 |
| Balıkesir | Balıkesir, Ç anakkale | 6,222 | 11,760 | 5,538 |
| Kocaeli | Kocaeli, Sakarya, Düzce, Bolu, Yalova | 46,533 | 51,336 | 4,803 |
| Ağrı | Ağrı, Kars, Iğdır, Ardahan | 1,333 | 3,696 | 2,363 |
| Zonguldak | Zonguldak, Karabük, Bartın | 883 | 2,892 | 2,009 |
| Tekirdağ | Tekirdağ, Edirne, Kırklareli | 15,719 | 16,730 | 1,011 |
| Van | Van, Muş, Bitlis, Hakkâri | 4,662 | 5,642 | 980 |
| Trabzon | Trabzon, Ordu, Giresun Rize, Artvin, Gümüşhane | 4,027 | 4,352 | 325 |
| İzmir | İzmir | 112,881 | 106,764 | −6,117 |
| Malatya | Malatya, Elazığ, Bingöl, Tunceli | 29,689 | 7,965 | −21,724 |
| Kayseri | Kayseri, Sivas, Yozgat | 67,207 | 42,480 | −24,727 |
| Mardin | Mardin, Batman, Şırnak, Siirt | 136,673 | 12,672 | −124,001 |
| Şanlıurfa | Şanlıurfa, Diyarbakır | 466,811 | 180,728 | −286,083 |
| Gaziantep | Gaziantep, Adıyaman, Kilis | 497,371 | 208,257 | −289,114 |
| Hatay | Hatay, Kahramanmaraş, Osmaniye | 536,986 | 143,244 | −393,742 |
[i] Notes: Official figures on Syrian refugees under temporary protection from the DGMM as of July 2017. Estimated figures are calculated with the help of adjusted survey weights that take into account the proportion of the population sampled in each subregion as well as a correction factor. Differences of less than 20,000 should be disregarded due to the small sample size.
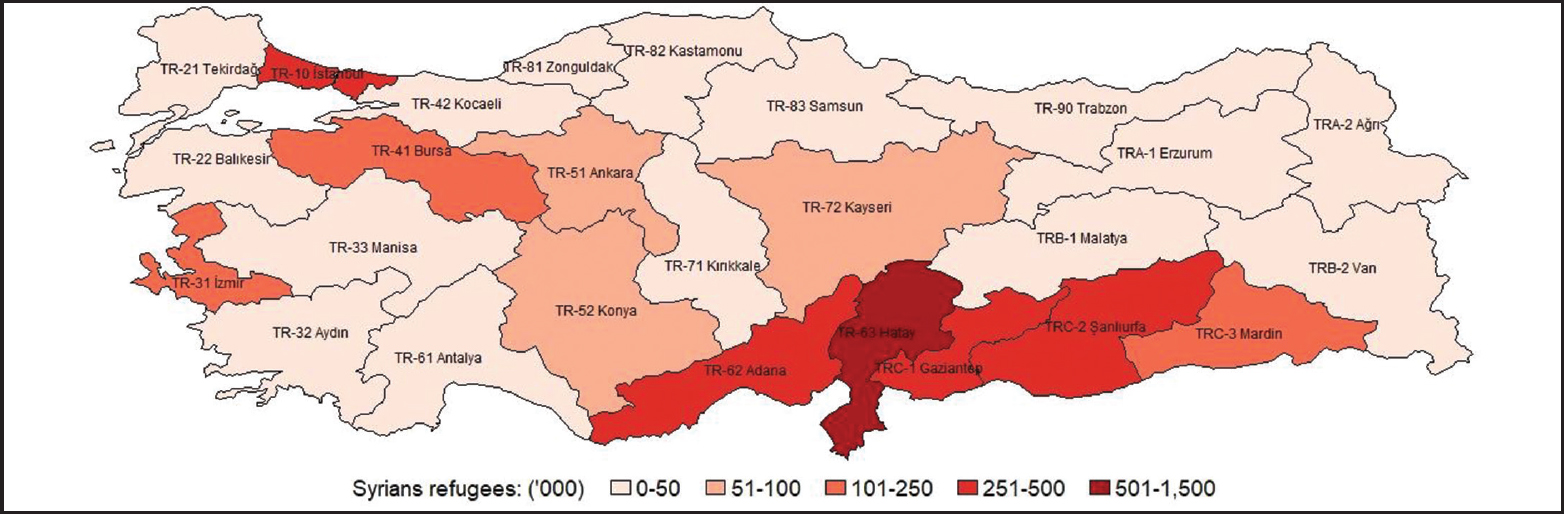
Figure C1
Number of Syrian refugees under temporary protection by subregion, DGMM July 2017.
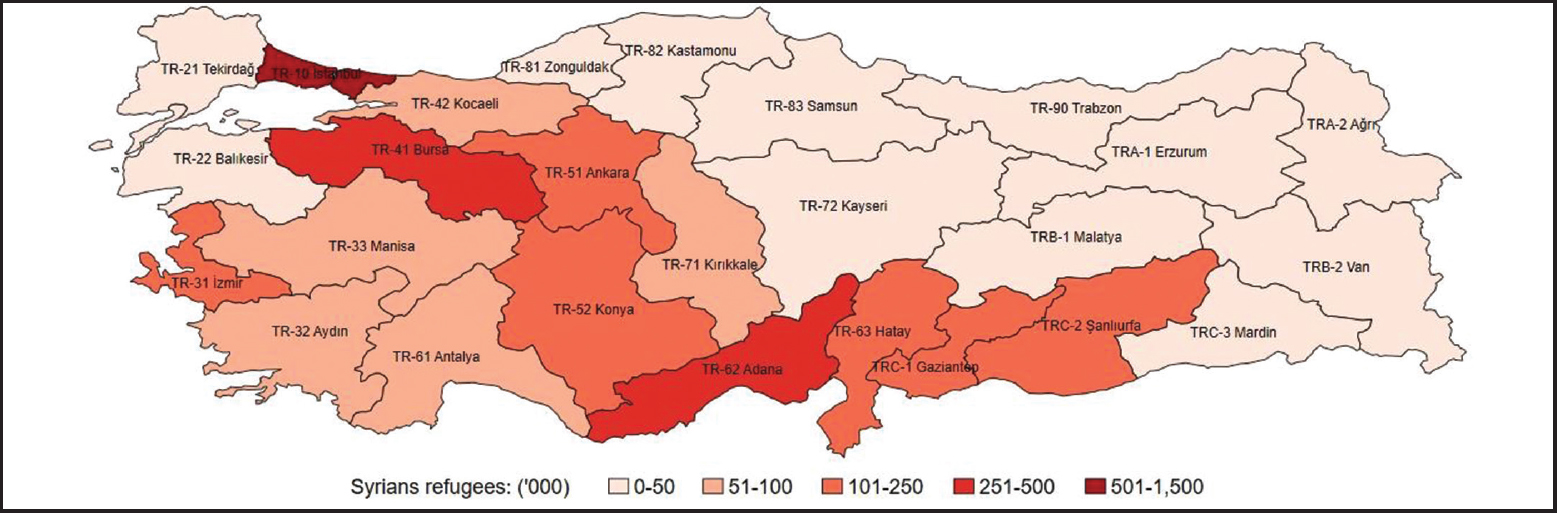
Figure C2
Number of Syrian refugees under temporary protection by subregion, HLFS 2017.
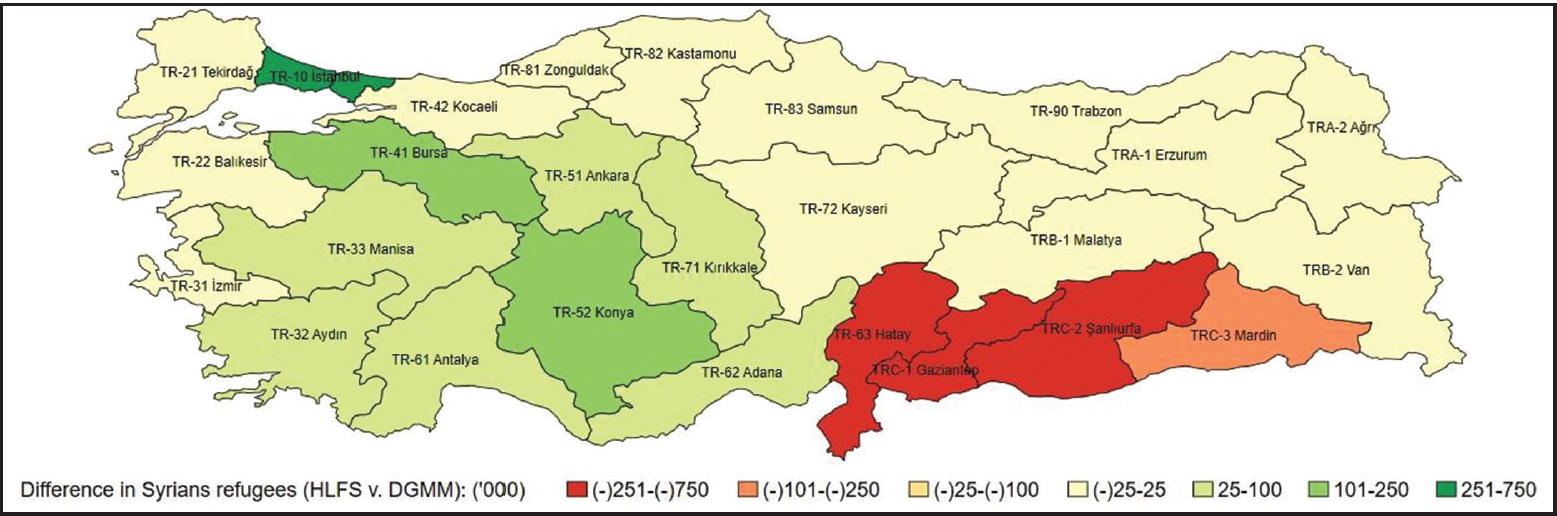
Figure C3
Difference in Syrian refugees under temporary protection by subregion, HLFS vs. DGMM.