
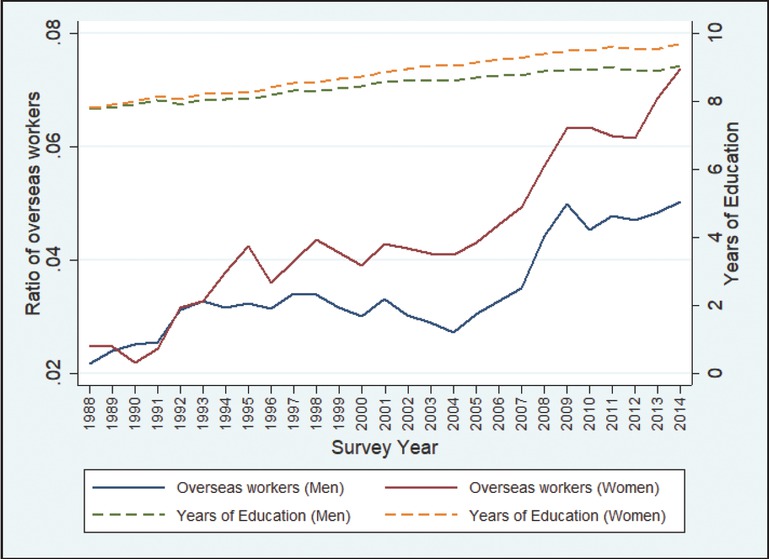
Figure 1
Changes in the share of overseas workers and educational attainment in the Philippines.
Table 1
Number of land-based overseas Filipino workers by occupation, new hires in 2014
| Occupation | N |
|---|---|
| Household service workers | 183,101 |
| Nursing professionals | 19,815 |
| Waiters, bartenders, and related workers | 13,843 |
| Caregivers and caretakers | 12,075 |
| Charworkers, cleaners, and related workers | 11,894 |
| Laborers/helpers general | 11,515 |
| Wiremen and electrical workers | 8,226 |
| Plumbers and pipe fitters | 7,657 |
| Welders and flame-cutters | 7,282 |
| Cooks and related workers | 5,707 |
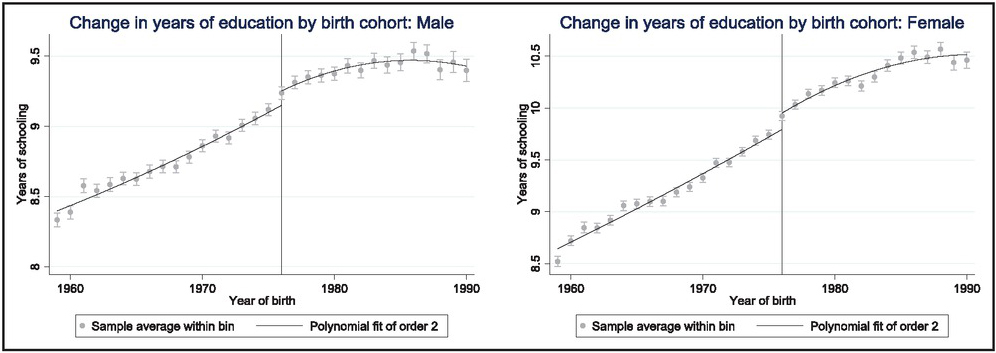
Figure 2
Average years of schooling for different birth cohorts.
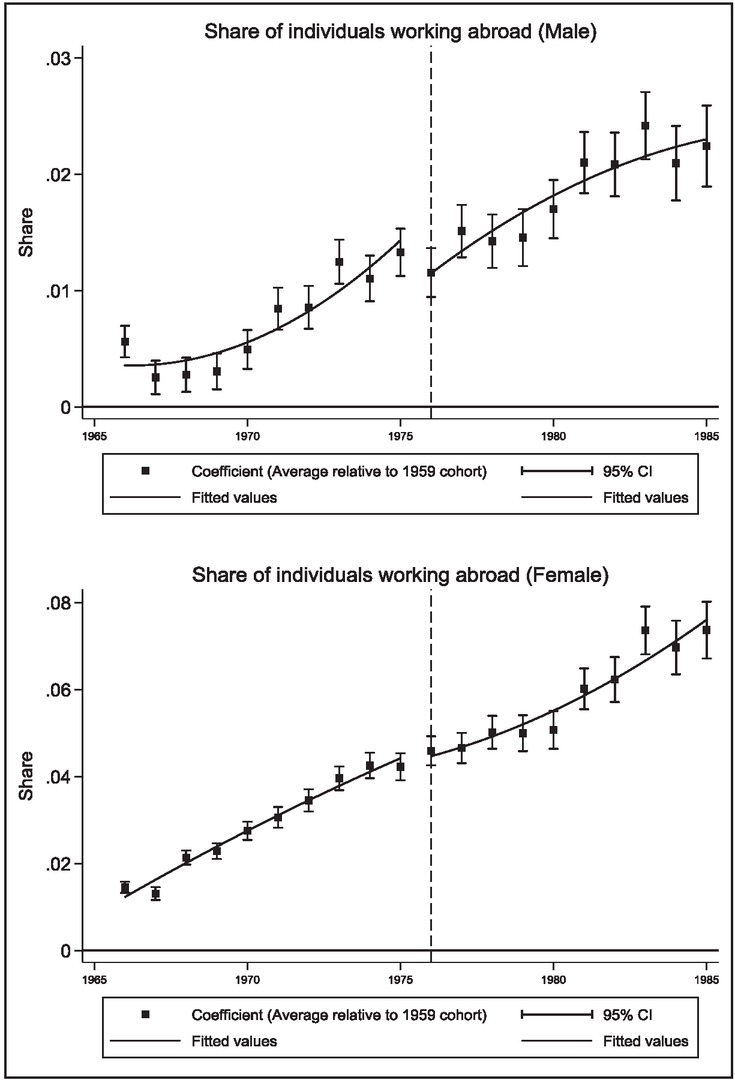
Figure 3
Change in the proportion of overseas workers.
Notes: The coefficients (symbols) and confidence intervals (CIs) (bars) indicate the estimates of birth-year dummies from a regression of indicator for working oversea on birth-year dummies, as well as age fixed effects where reference cohort is 1959 cohort. The curves (thick lines) are quadratic polynomials that are fit separately (on the coefficient estimates) on each side of the cutoff. The sample includes those in the labor force who are ≥21 years of age in the 1995–2014 Labor Force Surveys.
Source: Data are from the 1995–2014 LFS.
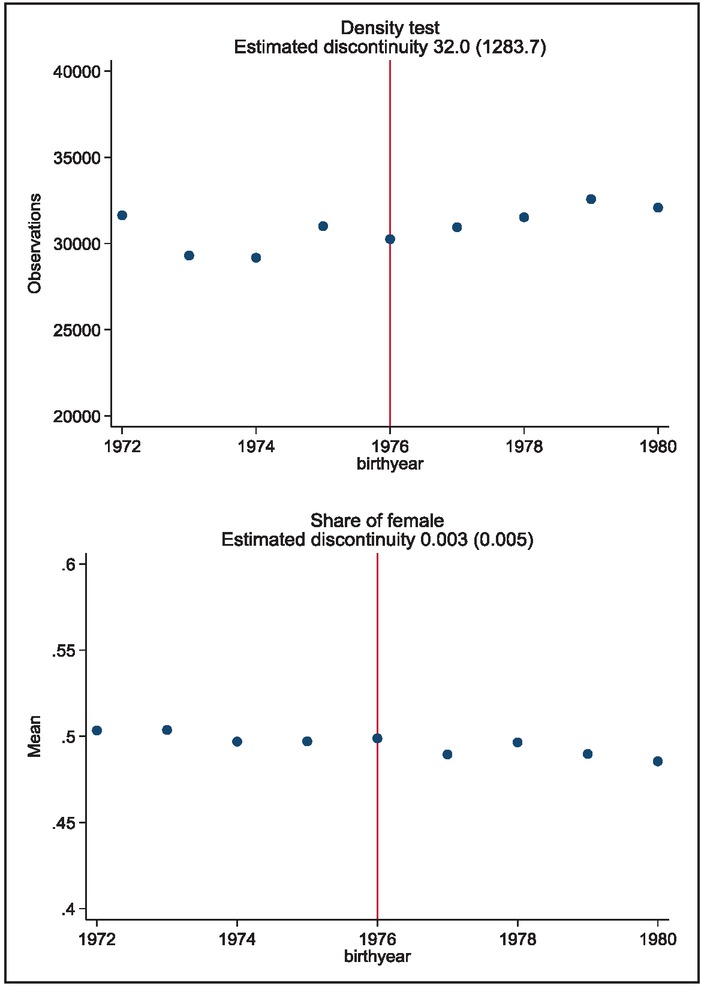
Figure 4
Diagnostics.
Table 2
First stage: the effect of free secondary education on schooling
| Men | Women | Overall | |||||||
|---|---|---|---|---|---|---|---|---|---|
| (1) | (2) | (3) | (4) | (5) | (6) | (7) | (8) | (9) | |
| “1” if born in 1976 or later | 0.070*** | 0.073*** | –0.011 | 0.107*** | 0.109*** | 0.038 | 0.111*** | 0.102*** | 0.019 |
| (0.015) | (0.017) | (0.038) | (0.021) | (0.020) | (0.044) | (0.014) | (0.016) | (0.041) | |
| Survey year fixed effects | No | Yes | Yes | No | Yes | Yes | No | Yes | Yes |
| Optimal bandwidth | 5 | 6 | 7 | 5 | 6 | 7 | 4 | 7 | 8 |
| Cutoff year | 1976 | 1976 | 1971 | 1976 | 1976 | 1971 | 1976 | 1976 | 1971 |
| Effective observations | 210,612 | 252,952 | 370,678 | 249,434 | 292,480 | 371,676 | 207,786 | 589,047 | 742,354 |
[i] Notes: Individuals aged ≥21 years at the time of the interview are included in the sample. We show the coefficients and standard errors for the local linear regression (using bandwidths selected via the procedures of Calonico et al., 2014a, 2014b) with the triangular kernel weight and the covariate being the survey year dummies. The bandwidth is selected to minimize the mean squared errors. Standard errors are clustered at the year of birth. ***p<0.01, **p<0.05, and *p<0.1.
Source: Data are from 1995–2014 LFS.
Table 3
OLS and fuzzy RDD estimates of the effects of schooling on working overseas
| Men | Women | Overall | ||||
|---|---|---|---|---|---|---|
| (1) | (2) | (3) | (4) | (5) | (6) | |
| OLS | Fuzzy RDD | OLS | Fuzzy RDD | OLS | Fuzzy RDD | |
| Years of schooling | 0.009*** | –0.032*** | 0.006*** | –0.007 | 0.009*** | –0.028** |
| (0.000) | (0.016) | (0.000) | (0.016) | (0.000) | (0.011) | |
| Optimal bandwidth | 9 | 9 | 7 | 7 | 9 | 9 |
| Effective observations | 351,222 | 351,222 | 168,696 | 168,696 | 565,870 | 565,870 |
[i] Notes: Individuals aged ≥21 years at the time of the interview are included in the sample. Columns 1 and 3 are estimated using linear probability model using the same sample as Columns 2 and 4 for ease of comparison. In Columns 2 and 4, we show the coefficients and standard errors for the local linear regression (using bandwidths selected using the procedures of Calonico et al., 2014a, 2014b) with the triangular kernel weight and the covariate being the survey year dummies. The bandwidth is selected to minimize the mean squared errors. Standard errors are clustered at the year of birth. ***p<0.01, **p<0.05, and *p<0.1.
Source: Data are from the 1995–2014 LFS.
Table 4
Robustness test: different kernel weights
| Male | Female | Overall | Male | Female | Overall | |
|---|---|---|---|---|---|---|
| (1) | (2) | (3) | (4) | (5) | (6) | |
| Panel A (main specification) | First stage | Fuzzy RDD | ||||
| Triangular kernel | 0.073*** | 0.109*** | 0.102*** | –0.032*** | –0.007 | –0.028** |
| –0.017 | –0.02 | –0.016 | (0.016) | (0.016) | (0.011) | |
| Optimal bandwidth Panel B | 6 | 6 | 7 | 9 | 7 | 9 |
| Rectangular kernel | 0.101*** | 0.093*** | 0.090*** | –0.026* | 0.010 | 0.007 |
| (0.020) | (0.022) | (0.011) | (0.015) | (0.018) | (0.008) | |
| Optimal bandwidth | 6 | 5 | 4 | 6 | 5 | 4 |
| Panel C | ||||||
| Epanechnikov kernel | 0.089*** | 0.094*** | 0.081*** | –0.030* | 0.012 | –0.009 |
| (0.016) | (0.022) | (0.012) | (0.016) | (0.015) | (0.011) | |
| Optimal bandwidth | 8 | 5 | 5 | 8 | 5 | 5 |
[i] Notes: Individuals aged ≥21 years at the time of the interview are included in the sample. We show the coefficients and standard errors for the local linear regression (using bandwidths selected using the procedures of Calonico et al., 2014a, 2014b) with kernel weight explained in each row and the covariate being the survey year dummies. The bandwidth is selected to minimize the mean squared errors. Standard errors are clustered at the year of birth. ***p<0.01, **p<0.05, and *p<0.1.
Source: Data are from the 1995–2014 LFS.
Table A1
The effect of free secondary education on completion of primary school, high school, and college
| Men | Women | |||||||
|---|---|---|---|---|---|---|---|---|
| Primary school | Lower high school | Upper high school | College | Primary school | Lower high school | Upper high school | College | |
| (1) | (2) | (3) | (4) | (5) | (6) | (7) | (8) | |
| “1” if born in 1976 or later | 0.006*** | 0.006*** | 0.006*** | 0.002 | 0.005*** | 0.006* | 0.010*** | 0.016*** |
| –0.001 | –0.002 | –0.002 | –0.002 | –0.002 | –0.004 | –0.002 | –0.003 | |
| Survey year fixed effects | Yes | Yes | Yes | Yes | Yes | Yes | Yes | Yes |
| Bandwidth | 5 | 5 | 7 | 8 | 5 | 5 | 7 | 6 |
| Observation | 252,952 | 252,952 | 252,952 | 376,997 | 207,786 | 249,434 | 292,480 | 292,480 |