
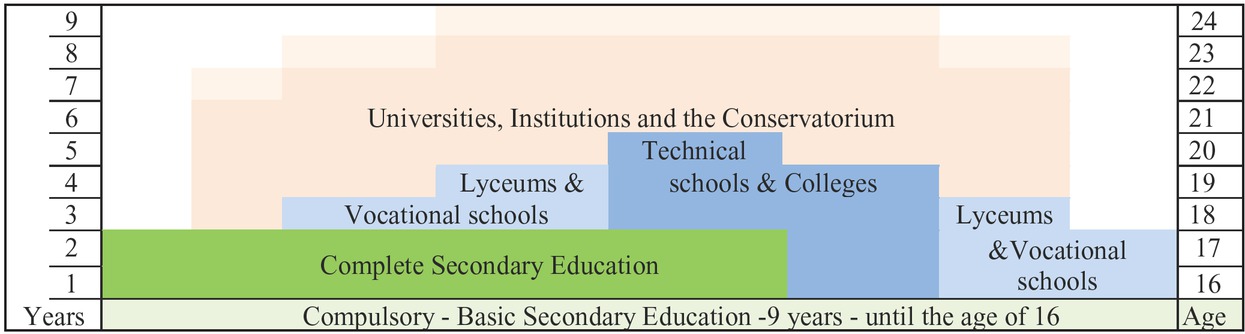
Figure 1
Schooling, age, and degrees in Tajikistan.
Note: This figure lays out the structure of Tajikistan’s educational system, the translation of degrees into years of schooling, and the normal corresponding students’ ages. In this article, professional education starts at years of schooling category “Professional lyceums and Vocational schools” corresponding to age 16 or 9 years of compulsory basic education. These are the lower band for the professional education categories. With professional education from lyceums and vocational schools, people work at lower professional occupations.
Table 1
Description of variables
| Variable name | Description |
|---|---|
| No education | A dummy variable taking a value of 1 if a person has no education and 0 otherwise. |
| Primary education | A dummy variable taking a value of 1 if a person’s highest obtained/acquiring educational level is primary education (grades 1–4) and 0 otherwise. |
| Basic education | A dummy variable taking a value of 1 if a person’s highest obtained/acquiring educational level is basic education (grades 5–8(9)) and 0 otherwise. |
| Secondary general education | A dummy variable taking a value of 1 if a person’s highest obtained/acquiring educational level is secondary general education (grades 9–10(11)) and 0 otherwise. |
| Vocational education | A dummy variable taking a value of 1 if a person’s highest obtained/acquiring educational level is vocational education (secondary special or technical) and 0 otherwise. |
| Tertiary education | A dummy variable taking a value of 1 if a person’s highest obtained/acquiring educational level is tertiary education (higher or graduate) and 0 otherwise. |
| Household head | A dummy variable taking a value of 1 if a person is the head of the household and 0 otherwise. |
| Former or current migrant | A dummy variable taking a value of 1 if a person has ever migrated and 0 otherwise. |
| Married/nikoh | A dummy variable taking a value of 1 if a person is married and 0 otherwise. |
| Age | The age of the person |
| Age-square | The square of the age of the person |
| Male | A dummy variable taking a value of 1 if a person is male and 0 otherwise. |
| Female | A dummy variable taking a value of 1 if a person is female and 0 otherwise. |
| Lives in capital | A dummy variable taking a value of 1 if a person lives in the capital and 0 otherwise. |
| Lives in other urban areas | A dummy variable taking a value of 1 if a person lives in other than capital urban area and 0 otherwise. |
| Lives in a rural area | A dummy variable taking a value of 1 if a person lives in a rural area and 0 otherwise. |
| Lives in Tajikistan | A dummy variable taking a value of 1 if a person lives in Tajikistan and 0 otherwise. |
| Lives in Uzbekistan | A dummy variable taking a value of 1 if a person lives in Uzbekistan and 0 otherwise. |
| Lives in Kyrgyzstan | A dummy variable taking a value of 1 if a person lives in Kyrgyzstan and 0 otherwise. |
| Number of children age <18 | A number of children with ages less than 18 in the household. |
| Female-headed household | A dummy variable taking a value of 1 if the head of household is female and 0 otherwise. |
| Household consumption: first quintile | A dummy variable taking a value of 1 if the household is in the lowest consumption quintile and 0 otherwise. |
| Household consumption: second quintile | A dummy variable taking a value of 1 if the household is in the second consumption quintile and 0 otherwise. |
| Household consumption: third quintile | A dummy variable taking a value of 1 if the household is in the middle consumption quintile and 0 otherwise. |
| Household consumption: fourth quintile | A dummy variable taking a value of 1 if the household is in the fourth consumption quintile and 0 otherwise. |
| Household consumption: fifth quintile | A dummy variable taking a value of 1 if the household is the highest consumption quintile and 0 otherwise. |
| Community’s migrant network age >46 | A share of migrants among the adult population with ages 47 and higher in the survey’s population sampling unit. |
| Household’s share of adults age >46 with professional education | A share of adults with professional education with ages 47 and higher in the household. |
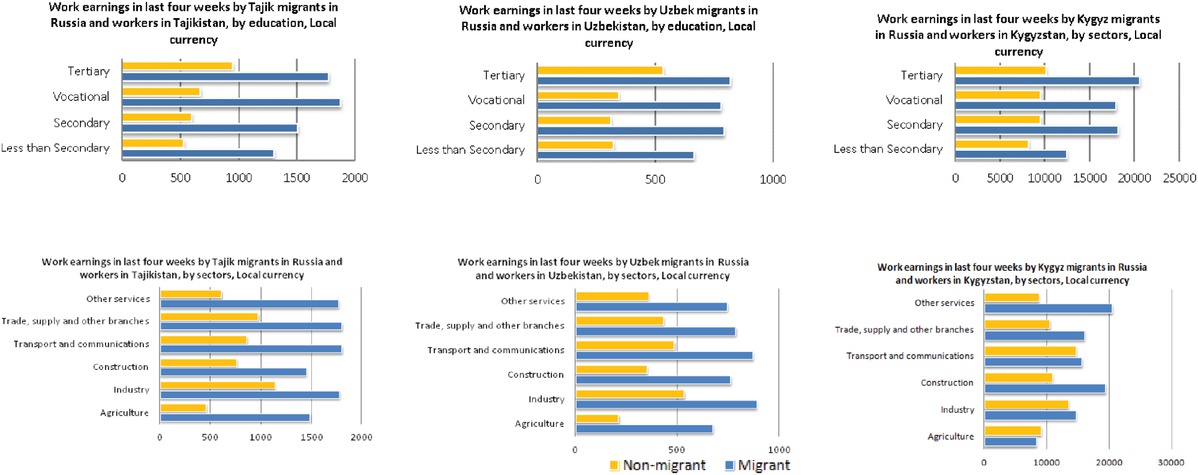
Figure 2
Mean wages between migrants in the Russian Federation and nonmigrants in their home countries (by education and sectors).
Table 2
Summary statistics
| All countries | Tajikistan | Uzbekistan | Kyrgyzstan | |||||||||
|---|---|---|---|---|---|---|---|---|---|---|---|---|
| Men and Women | Current or former migrant | Never migrated | Men and Women | Current or former migrant | Never migrated | Men and Women | Current or former migrant | Never migrated | Men and Women | Current or former migrant | Never migrated | |
| Education variables | ||||||||||||
| No education | 0.0105 [0.0024] | 0.0045 [0.0020] | 0.0122 [0.0028] | 0.0334 [0.0108] | 0.0113 [0.0046] | 0.0421 [0.0138] | 0.0049 [0.0018] | 0.0024 [0.0024] | 0.0055 [0.0022] | 0.0108 [0.0051] | 0.0032 [0.0032] | 0.0127 [0.0061] |
| Primary education | 0.0045 [0.0008] | 0.0036 [0.0010] | 0.0047 [0.0009] | 0.0233 [0.0043] | 0.0164 [0.0043] | 0.0260 [0.0055] | 0 | 0 | 0 | 0.0037 [0.0010] | 0 | 0.0047 [0.0013] |
| Basic education | 0.1094 [0.0096] | 0.0975 [0.0140] | 0.1129 [0.0100] | 0.1937 [0.0183] | 0.1653 [0.0253] | 0.2050 [0.0190] | 0.1019 [0.0125] | 0.0844 [0.0190] | 0.1067 [0.0129] | 0.0290 [0.0095] | 0.0403 [0.0162] | 0.0261 [0.0087] |
| Secondary general education | 0.4542 [0.0165] | 0.5181 [0.0225] | 0.4357 [0.0180] | 0.5265 [0.0198] | 0.5638 [0.0251] | 0.5117 [0.0215] | 0.4338 [0.0214] | 0.4970 [0.0309] | 0.4168 [0.0232] | 0.4709 [0.0460] | 0.5578 [0.0570] | 0.4486 [0.0490] |
| Professional education: | ||||||||||||
| Vocational education | 0.2810 [0.0167] | 0.2831 [0.0231] | 0.2804 [0.0188] | 0.0828 [0.0070] | 0.1119 [0.0141] | 0.0713 [0.0063] | 0.3493 [0.0225] | 0.3612 [0.0329] | 0.3461 [0.0252] | 0.1580 [0.0106] | 0.1408 [0.0250] | 0.1624 [0.0116] |
| Tertiary education | 0.1404 [0.0116] | 0.0931 [0.0119] | 0.1541 [0.0132] | 0.1403 [0.0099] | 0.1312 [0.0120] | 0.1439 [0.0111] | 0.1101 [0.0114] | 0.0550 [0.0138] | 0.1250 [0.0126] | 0.3275 [0.0422] | 0.2578 [0.0494] | 0.3454 [0.0462] |
| Individual characteristics | ||||||||||||
| Household head | 0.1098 [0.0087] | 0.1578 [0.0193] | 0.0959 [0.0091] | 0.1070 [0.0089] | 0.1695 [0.0202] | 0.0822 [0.0074] | 0.0984 [0.0112] | 0.1564 [0.0275] | 0.0827 [0.0116] | 0.1842 [0.0160] | 0.1428 [0.0275] | 0.1949 [0.0157] |
| Former or current migrant | 0.2239 [0.0102] | 1 | 0 | 0.2842 [0.0128] | 1 | 0 | 0.2124 [0.0133] | 1 | 0 | 0.2042 [0.0244] | 1 | 0 |
| Manied/nikoh | 0.8285 [0.0079] | 0.8203 [0.0147] | 0.8308 [0.0092] | 0.8293 [0.0089] | 0.8296 [0.0148] | 0.8291 [0.0092] | 0.8405 [0.0102] | 0.8385 [0.0205] | 0.8411 [0.0119] | 0.7527 [0.0152] | 0.6834 [0.0306] | 0.7705 [0.0164] |
| Age | 31.0152 [0.1093] | 31.0446 [0.1835] | 31.0067 [0.1145] | 31.0055 [0.1049] | 31.1305 [0.1667] | 30.9558 [0.1189] | 31.0061 [0.1496] | 31.1030 [0.2624] | 30.9800 [0.1535] | 31.0854 [0.1487] | 30.4900 [0.2778] | 31.2382 [0.1654] |
| Age-square | 979.9376 [6.9265] | 981.5682 [11.7373] | 979.4672 [7.2430] | 979.6896 [6.7053] | 987.1113 [10.7850] | 976.7430 [7.5436] | 979.2326 [9.4721] | 985.0854 [16.7905] | 977.6544 [9.7142] | 984.6581 [9.4219] | 947.4116 [17.4577] | 994.2160 [10.4717] |
| Male | 0.5069 [0.0055] | 0.8485 [0.0145] | 0.4084 [0.0086] | 0.5018 [0.0057] | 0.8999 [0.0121] | 0.3437 [0.0096] | 0.5110 [0.0073] | 0.8628 [0.0207] | 0.4162 [0.0115] | 0.4896 [0.0126] | 0.6498 [0.0267] | 0.4485 [0.0132] |
| Female | 0.4931 [0.0055] | 0.1515 [0.0145] | 0.5916 [0.0086] | 0.4982 [0.0057] | 0.1001 [0.0121] | 0.6563 [0.0096] | 0.4890 [0.0073] | 0.1372 [0.0207] | 0.5838 [0.0115] | 0.5104 [0.0126] | 0.3502 [0.0267] | 0.5515 [0.0132] |
| Household characteristics | ||||||||||||
| Lives incapital | 0.0968 [0.0154] | 0.0459 [0.0086] | 0.1115 [0.0182] | 0.0926 [0.0052] | 0.0650 [0.0067] | 0.1035 [0.0058] | 0.0908 [0.0064] | 0.0392 [0.0101] | 0.1047 [0.0081] | 0.1403 [0.1208] | 0.0493 [0.0471] | 0.1636 [0.1371] |
| Lives in other urban areas | 0.3877 [0.0227] | 0.3543 [0.0326] | 0.3974 [0.0233] | 0.1940 [0.0147] | 0.2062 [0.0267] | 0.1892 [0.0142] | 0.4602 [0.0271] | 0.4130 [0.0450] | 0.4730 [0.0268] | 0.2319 [0.0427] | 0.2879 [0.0476] | 0.2175 [0.0453] |
| Lives in rural areas | 0.5574 [0.0221] | 0.6161 [0.0321] | 0.5404 [0.0227] | 0.7134 [0.0149] | 0.7289 [0.0269] | 0.7073 [0.0148] | 0.5079 [0.0258] | 0.5720 [0.0445] | 0.4906 [0.0254] | 0.6279 [0.0913] | 0.6628 [0.0554] | 0.6189 [0.1043] |
| Lives in Tajikistan | 0.1734 [0.0084] | 0.2201 [0.0168] | 0.1599 [0.0082] | 1 | 1 | 1 | 0 | 0 | 0 | 0 | 0 | 0 |
| Lives in Uzbekistan | 0.7113 [0.0165] | 0.6747 [0.0222] | 0.7218 [0.0183] | 0 | 0 | 0 | 1 | 1 | 1 | 0 | 0 | 0 |
| Lives in Kyrgyzstan | 0.1153 [0.0156] | 0.1052 [0.0115] | 0.1183 [0.0183] | 0 | 0 | 0 | 0 | 0 | 0 | 1 | 1 | 1 |
| Number of children age<18 | 2.4944 [0.0641] | 2.5309 [0.1091] | 2.4839 [0.0609] | 3.3796 [0.1104] | 3.2119 [0.1175] | 3.4462 [0.1142] | 2.3663 [0.0821] | 2.4004 [0.1575] | 2.3571 [0.0747] | 1.9535 [0.0946] | 1.9429 [0.1151] | 1.9563 [0.1040] |
| Female-headed household | 0.0495 [0.0043] | 0.0514 [0.0067] | 0.0489 [0.0044] | 0.1987 [0.0146] | 0.1860 [0.0188] | 0.2037 [0.0162] | 0.0190 [0.0040] | 0.0110 [0.0047] | 0.0212 [0.0043] | 0.0131 [0.0033] | 0.0292 [0.0125] | 0.0089 [0.0025] |
| Household consumption: first quintile | 0.2297 [0.0156] | 0.2777 [0.0199] | 0.2158 [0.0162] | 0.2180 [0.0175] | 0.2277 [0.0212] | 0.2142 [0.0191] | 0.2342 [0.0211] | 0.3106 [0.0286] | 0.2136 [0.0218] | 0.2191 [0.0216] | 0.1707 [0.0280] | 0.2315 [0.0227] |
| Household consumption: second quintile | 0.2108 [0.0106] | 0.2279 [0.0171] | 0.2059 [0.0119] | 0.2024 [0.0147] | 0.1902 [0.0164] | 0.2073 [0.0155] | 0.2112 [0.0140] | 0.2306 [0.0238] | 0.2059 [0.0157] | 0.2209 [0.0231] | 0.2895 [0.0406] | 0.2033 [0.0229] |
| Household consumption: third quintile | 0.1980 [0.0116] | 0.1793 [0.0161] | 0.2034 [0.0122] | 0.2034 [0.0149] | 0.2072 [0.0206] | 0.2019 [0.0150] | 0.1985 [0.0157] | 0.1754 [0.0222] | 0.2047 [0.0164] | 0.1864 [0.0167] | 0.1457 [0.0330] | 0.1968 [0.0166] |
| Household consumption: fourth quintile | 0.1819 [0.0107] | 0.1490 [0.0150] | 0.1914 [0.0113] | 0.1940 [0.0130] | 0.2095 [0.0213] | 0.1878 [0.0127] | 0.1797 [0.0144] | 0.1283 [0.0206] | 0.1936 [0.0151] | 0.1770 [0.0192] | 0.1547 [0.0342] | 0.1827 [0.0187] |
| Household consumption: fifth quintile | 0.1797 [0.0125] | 0.1662 [0.0156] | 0.1836 [0.0131] | 0.1822 [0.0136] | 0.1655 [0.0167] | 0.1888 [0.0146] | 0.1763 [0.0166] | 0.1550 [0.0204] | 0.1821 [0.0175] | 0.1966 [0.0270] | 0.2393 [0.0618] | 0.1857 [0.0224] |
| Household's share of tertiary educated adults age >46 | 0.2515 [0.0117] | 0.2843 [0.0202] | 0.2420 [0.0120] | 0.1868 [0.0111] | 0.2112 [0.0161] | 0.1771 [0.0110] | 0.2711 [0.0158] | 0.3004 [0.0285] | 0.2632 [0.0161] | 0.2275 [0.0178] | 0.3334 [0.0398] | 0.2003 [0.0178] |
| Community's migrant network age >46 | 0.0660 [0.0045] | 0.0861 [0.0073] | 0.0602 [0.0040] | 0.1018 [0.0079] | 0.1123 [0.0093] | 0.0976 [0.0077] | 0.0598 [0.0057] | 0.0795 [0.0100] | 0.0545 [0.0050] | 0.0504 [0.0102] | 0.0741 [0.0217] | 0.0443 [0.0082] |
| Observations | 8037 | 1893 | 6144 | 4487 | 1157 | 3330 | 2026 | 440 | 1586 | 1524 | 296 | 1228 |
Table 3
Probit and heteroscedastic probit regressions on decision of tertiary education
| Completed tertiary education=1 (=0 if lower education) | Probit model | Heteroscedastic probit model | |||
|---|---|---|---|---|---|
| Coefficients | Marginal effects | Coefficients | Marginal effects | lnsigma2 | |
| Former or current migrant | −0.4482*** [0.0762] | −0.0756*** [0.0118] | −0.1283 [0.1940] | −0.0679*** [0.0092] | 0.0858 [0.0722] |
| Household head | 0.3281*** [0.1098] | 0.0699*** [0.0259] | 0.1382 [0.2092] | 0.0969*** [0.0151] | −0.0458 [0.0907] |
| Married/nikoh | 0.0675 [0.0713] | 0.0126 [0.0128] | 0.0577 [0.0898] | 0.0180* [0.0105] | −0.1217* [0.0684] |
| Age | 0.125 [0.1152] | 0.0237 [0.0221] | 0.0247 [0.0286] | 0.0082 [0.0156] | −0.0544 [0.0959] |
| Age-square | −0.0022 [0.0018] | −0.0004 [0.0003] | −0.0004 [0.0005] | −0.0002 [0.0002] | 0.001 [0.0015] |
| Male | 0.2798*** [0.0662] | 0.0532*** [0.0132] | 0.1333 [0.2006] | 0.0841*** [0.0101] | −0.0501 [0.0738] |
| Lives in rural areas | −0.3144*** [0.0963] | −0.0607*** [0.0192] | −0.3076 [0.4700] | −0.1517*** [0.0089] | 0.3060*** [0.1057] |
| Lives in Tajikistan | −0.5272*** [0.1011] | −0.0859*** [0.0158] | −0.0312 [0.0586] | −0.0976*** [0.0116] | −0.5223*** [0.0926] |
| Lives in Uzbekistan | −0.9129*** [0.1051] | −0.2074*** [0.0254] | −0.3173 [0.4876] | −0.1938*** [0.0098] | −0.1528 [0.1131] |
| Number of children age <18 | −0.0305 [0.0258] | −0.0058 [0.0047] | −0.02 [0.0308] | −0.0141*** [0.0025] | −0.0031 [0.0162] |
| Female headed household | −0.1728 [0.1094] | −0.0305* [0.0177] | −0.1257 [0.1974] | −0.0360** [0.0150] | 0.2324* [0.1264] |
| Household consumption: second quintile | 0.0315 [0.0851] | 0.006 [0.0164] | 0.0792 [0.1248] | 0.0445*** [0.0160] | −0.0773 [0.0883] |
| Household consumption: third quintile | 0.4027*** [0.1096] | 0.0848*** [0.0251] | 0.0946 [0.1458] | 0.0654*** [0.0163] | −0.013 [0.0899] |
| Household consumption: fourth quintile | 0.4420*** [0.1042] | 0.0946*** [0.0255] | 0.1178 [0.1820] | 0.0868*** [0.0169] | 0.0121 [0.0931] |
| Household consumption: fifth quintile | 0.6035*** [0.0939] | 0.1355*** [0.0243] | 0.2009 [0.3044] | 0.1402*** [0.0180] | −0.0907 [0.0915] |
| Household’s share of tertiary educated adults age >46 | 0.7326*** [0.0933] | 0.1391*** [0.0172] | 0.255 [0.3848] | 0.1939*** [0.0119] | 0.1277 [0.0904] |
| Constant | −2.55 [1.8489] | −0.6308 [0.7255] | |||
| Observations | 8037 | 8037 | |||
Table 4
Probit and heteroscedastic probit regressions on decision of migration
| Ever migrated abroad = 1 (=0 if never migrated) | Probit model | Heteroscedastic probit model | |||
|---|---|---|---|---|---|
| Coefficients | Marginal effects | Coefficients | Marginal effects | lnsigma2 | |
| Vocational education | −0.0011 [0.0910] | −0.0003 [0.0221] | −0.0020 [0.0073] | −0.0030 [0.0116] | 0.0860 [0.0591] |
| Tertiary education | −0.4628*** [0.0836] | −0.1013*** [0.0164] | −0.0149 [0.0534] | −0.0880*** [0.0107] | 0.1153* [0.0651] |
| Household head | −0.0986 [0.1020] | −0.0234 [0.0237] | −0.001 [0.0039] | −0.0315** [0.0123] | −0.1843* [0.1009] |
| Married/nikoh | −0.1019 [0.0709] | −0.0252 [0.0180] | 0.0012 [0.0045] | −0.0283** [0.0120] | −0.2578*** [0.0530] |
| Age | 0.0087 [0.1083] | 0.0021 [0.0263] | 0.0002 [0.0020] | 0.0055 [0.0158] | 0.0299 [0.0783] |
| Age-square | 0 [0.0017] | 0 [0.0004] | 0 [0.0000] | 0 [0.0002] | −0.0002 [0.0012] |
| Male | 1.2524*** [0.0650] | 0.3106*** [0.0141] | 1.9879 [2.4548] | 0.3371*** [0.0090] | −4.0126 [3.7482] |
| Lives in rural areas | 0.1726** [0.0808] | 0.0418** [0.0195] | 0.0042 [0.0152] | 0.0334*** [0.0087] | 0.0051 [0.0427] |
| Lives in Tajikistan | 0.0028 [0.1056] | 0.0007 [0.0257] | 0.0152 [0.0549] | 0.0686*** [0.0127] | −0.3484*** [0.0667] |
| Lives in Uzbekistan | −0.1484 [0.1035] | −0.0368 [0.0259] | 0.0098 [0.0356] | 0.0421*** [0.0158] | −0.3623*** [0.0701] |
| Number of children age <18 | 0.0015 [0.0221] | 0.0004 [0.0054] | −0.0002 [0.0008] | −0.0011 [0.0027] | 0.0032 [0.0124] |
| Female headed household | −0.1481* [0.0813] | −0.0346* [0.0181] | −0.001 [0.0040] | 0.0046 [0.0166] | 0.0843 [0.0775] |
| Household consumption: second quintile | −0.1219 [0.0801] | −0.029 [0.0185] | 0.0009 [0.0034] | −0.0027 [0.0133] | −0.0745 [0.0622] |
| Household consumption: third quintile | −0.2335*** [0.0847] | −0.0544*** [0.0184] | −0.0018 [0.0066] | −0.0328** [0.0131] | −0.1411** [0.0626] |
| Household consumption: fourth quintile | −0.2889*** [0.0890] | −0.0663*** [0.0188] | −0.0009 [0.0037] | −0.0286** [0.0137] | −0.1633** [0.0637] |
| Household consumption: fifth quintile | −0.2552*** [0.0805] | −0.0590*** [0.0172] | −0.0016 [0.0060] | −0.0255* [0.0135] | −0.0979 [0.0651] |
| Household’s share of tertiary educated adults age>46 | 0.2103** [0.0898] | 0.0511** [0.0221] | 0.0038 [0.0138] | 0.0612*** [0.0141] | 0.2403*** [0.0615] |
| Community’s migrant network age >46 | 3.7565*** [0.5876] | 0.9130*** [0.1436] | 0.0674 [0.2406] | 0.6373*** [0.0604] | 0.8917*** [0.2780] |
| Constant | −1.8167 [1.6940] | −2.0145 [2.4515] | |||
| Observations | 8037 | 8037 | |||
Table 5
Ordered probit of the choice of education
| Completed or acquiring education | Coefficients | Marginal effects | ||
|---|---|---|---|---|
| Secondary or less | Vocational | Tertiary | ||
| Former or current migrant | −0.2227*** [0.0640] | 0.0765*** [0.0216] | −0.0365*** [0.0112] | −0.0401*** [0.0108] |
| Household head | 0.3708*** [0.0759] | −0.1311*** [0.0273] | 0.0502*** [0.0098] | 0.0809*** [0.0183] |
| Married/nikoh | 0.0788 [0.0544] | −0.0272 [0.0186] | 0.0125 [0.0088] | 0.0147 [0.0099] |
| Age | −0.0248 [0.0966] | 0.0086 [0.0336] | −0.0039 [0.0152] | −0.0048 [0.0184] |
| Age-square | 0.0003 [0.0015] | −0.0001 [0.0005] | 0.0000 [0.0002] | 0.0001 [0.0003] |
| Male | 0.1259* [0.0488] | −0.0439*** [0.0170] | 0.0198*** [0.0077] | 0.0241** [0.0095] |
| Lives in rural area | −0.2881*** [0.0730] | 0.1017*** [0.0261] | −0.0458*** [0.0119] | −0.0559*** [0.0147] |
| Lives in Tajikistan | −0.6874*** [0.1009] | 0.2247*** [0.0300] | −0.1213*** [0.0172] | −0.1034*** [0.0147] |
| Lives in Uzbekistan | −0.3987*** [0.0969] | 0.1372*** [0.0323] | −0.0534*** [0.0101] | −0.0837*** [0.0231] |
| Number of children age <18 | −0.0392* [0.0196] | 0.0136** [0.0068] | −0.0061* [0.0032] | −0.0075** [0.0036] |
| Female headed household | −0.1485 [0.1113] | 0.0510 [0.0375] | −0.0244 [0.0190] | −0.0265 [0.0186] |
| Household consumption: second quintile | 0.1441 [0.0864] | −0.0501* [0.0299] | 0.0214* [0.0125] | 0.0287 [0.0176] |
| Household consumption: third quintile | 0.3901*** [0.0670] | −0.1365*** [0.0233] | 0.0534*** [0.0087] | 0.0831*** [0.0158] |
| Household consumption: fourth quintile | 0.4938*** [0.0794] | −0.1740*** [0.0277] | 0.0653*** [0.0082] | 0.1087*** [0.0211] |
| Household consumption: fifth quintile | 0.5948*** [0.0740] | −0.2113*** [0.0255] | 0.0761*** [0.0079] | 0.1352*** [0.0205] |
| Household’s share of tertiary educated adults age>46 | 0.7435*** [0.0834] | −0.2584*** [0.0269] | 0.1162*** [0.0136] | 0.1422*** [0.0164] |
| cut1 | −0.3322 [1.5271] | |||
| cut2 | 0.6924 [1.5255] | |||
| Observations | 8037 | |||
Table 6
Instrumented bivariate probit and two-stage least squares IV regressions on choices of migration and tertiary education
| Instrumented bivariate probit | Two-stage least squares | ||||
|---|---|---|---|---|---|
| Tertiary education | Former or current migrant | 2nd stage: Tertiary education | 1st stage: former or current migrant | ||
| Coefficients | Marginal effectsa | Coefficients | Coefficients | Coefficients | |
| Former migrant or current | −0.7078* [0.3674] | −0.1417 [0.1027] | −0.2190*** [0.0726] | ||
| Household head | 0.3127*** [0.1118] | 0.0849** [0.0362] | −0.1319 [0.0984] | 0.0665*** [0.0205] | −0.0484* [0.0269] |
| Married/nikoh | 0.0604 [0.0709] | 0.0171 [0.0174] | −0.1107 [0.0724] | 0.0093 [0.0153] | −0.0217 [0.0183] |
| Age | 0.1215 [0.1130] | 0.0287 [0.0279] | −0.0025 [0.1154] | 0.0288 [0.0213] | −0.0040 [0.0253] |
| Age-square | −0.0021 [0.0018] | −0.0005 [0.0004] | 0.0002 [0.0018] | −0.0005 [0.0003] | 0.0001 [0.0004] |
| Male | 0.3619*** [0.1318] | 0.0485*** [0.0187] | 1.2351*** [0.0643] | 0.0964*** [0.0255] | 0.315*** [0.0146] |
| Lives in rural areas | −0.3004*** [0.0972] | −0.0776** [0.0330] | 0.1928** [0.0800] | −0.0599*** [0.0112] | 0.0516*** [0.0138] |
| Lives in Tajikistan | −0.5038*** [0.1128] | −0.1052*** [0.0271] | 0.0370 [0.1111] | −0.1370*** [0.0158] | 0.0248 [0.0161] |
| Lives in Uzbekistan | −0.9079*** [0.1042] | −0.2404*** [0.0467] | −0.0695 [0.1035] | −0.2230*** [0.0138] | −0.0063 [0.0137] |
| Number of children age <18 | −0.0298 [0.0254] | −0.0071 [0.0061] | 0.0040 [0.0229] | −0.0084** [0.0035] | 0.0005 [0.0049] |
| Female headed house-hold | −0.1845* [0.1112] | −0.0372 [0.0246] | −0.1361* [0.0812] | −0.0348* [0.0181] | −0.0362* [0.0216] |
| Household consumption: second quintile | 0.0214 [0.0829] | 0.0088 [0.0214] | −0.1237 [0.0796] | −0.0084 [0.0128] | −0.0269 [0.0212] |
| Household consumption: third quintile | 0.3813*** [0.1174] | 0.1056*** [0.0368] | −0.2615*** [0.0831] | 0.0556*** [0.0167] | −0.0644*** [0.0205] |
| Household consumption: fourth quintile | 0.4161*** [0.1088] | 0.1186*** [0.0436] | −0.3313*** [0.0893] | 0.0613*** [0.0179] | −0.0802*** [0.0211] |
| Household consumption: fifth quintile | 0.5806*** [0.1061] | 0.1671*** [0.0432] | −0.3149*** [0.0793] | 0.1070*** [0.0185] | −0.0771*** [0.0217] |
| Household’s share of tertiary educated adults age>46 | 0.7379*** [0.0936] | 0.1696*** [0.0453] | 0.1354 [0.0848] | 0.1700*** [0.0184] | 0.0293 [0.0195] |
| Community’s migrant network age >46 | −0.1122 [0.1855] | 3.8201*** [0.6203] | 1.0310*** [0.0982] | ||
| Constant | −0.1330 [0.3340] | 0.0529 [0.3960] | |||
| R-squared | 0.1050 | 0.1750 | |||
| atanh ρ | 0.1636 [0.2225] | ||||
| ρ | 0.1621 [0.2166] | ||||
| Observations | 8037 | 8037 | |||