
Table 1
The effect of migration on loans for developed versus developing countries
| Dependent variables | log(Loans) (1) | Loans (2) |
|---|---|---|
| log migrationij | 0.100** | 0.125*** |
| (0.047) | (0.038) | |
| log migrationij * (non-developed country)j | 0.058 | 0.145*** |
| (0.042) | (0.038) | |
| log Distanceij | -0.744*** | -0.265*** |
| (0.110) | (0.050) | |
| Obs. | 1,451 | 1,588 |
| Obs. with developed borrowing countries | 427 | 431 |
| No. of lending countries | 17 | 17 |
| No. of borrowing countries | 158 | 158 |
| R2 | 0.86 | 0.94 |
| Estimator | OLS | Poisson |
[i] Notes: This table estimates the effect of migration on loans with interaction with non-developed countries. N, L, and B denote the number of observations, number of lending (investing) countries, and number of borrowing (issuing) countries, respectively. Regressions are estimated by OLS and Poisson.
Standard errors are clustered at the borrowing country level. All columns include country fixed effects, colonial link, language, and legal origin as additional controls.
Source: Kugler et al. (2018).
Table 2
The effect of South-South migration on exports
| Panel A: extensive | OLS | IV | |||
|---|---|---|---|---|---|
| margin | (1) | (2) | (3) | (4) | (5) |
| Immigrants | 0.0030 | 0.0024 | 0.0080 | ||
| (0.001}*** | (0.001)** | (0.003)** | |||
| Emigrants | 0.0022 | 0.0011 | 0.0070 | ||
| (0.001)*** | (0.001)* | (0.003)** | |||
| Total FDI | -0.0001 | -0.0001 | -0.0001 | -0.0003 | -0.0003 |
| (0.000) | (0.000) | (0.000) | (0.000) | (0.000)* | |
| Total trade | -0.0005 | -0.0004 | -0.0005 | -0.0011 | -0.0003 |
| (0.000) | (0.000) | (0.000) | (0.000)** | (0.000)** | |
| Product imports | -0.0008 | -0.0008 | -0.0008 | -0.0009 | -0.0008 |
| (0.000)* | (0.000)* | (0.000)* | (0.000)* | (0.000)* | |
| N | 83230 | 83230 | 83230 | 83230 | 83230 |
| R2 | 0.15 | 0.15 | 0.15 | 0.14 | 0.14 |
| KP F Stat | 89.61 | 72.78 | |||
| Panel B: intensive margin | |||||
|---|---|---|---|---|---|
| OLS | IV | ||||
| (1) | (2) | (3) | (4) | (5) | |
| Immigrants | 0.0058 | 0.0030 | 0.0101 | ||
| (0.001)*** | (0.001)*** | (0.003)*** | |||
| Emigrants | 0.0082 | 0.0067 | 0.0107 | ||
| (0.001)*** | (0.001)*** | (0.003)*** | |||
| Total FDI | -0.0011 | -0.0011 | -0.0012 | -0.0013 | -0.0012 |
| (0.000)*** | (0.000)*** | (0.000)*** | (0.000)*** | (0.000)*** | |
| Total trade | 0.0026 | 0.0023 | 0.0018 | 0.0016 | 0.0017 |
| (0.001)*** | (0.001)*** | (0.001)*** | (0.001) | (0.001)* | |
| Baseline exports | -0.0453 | -0.0456 | -0.0459 | -0.0460 | -0.0460 |
| (0.002)*** | (0.002)*** | (0.002)*** | (0.002)*** | (0.002)*** | |
| Product imports | 0.0038 | 0.0039 | 0.0039 | 0.0039 | 0.0040 |
| (0.001)*** | (0.001)*** | (0.001)*** | (0.001)*** | (0.001)*** | |
| Previous exports | -0.0045 | -0.0045 | -0.0044 | -0.0043 | -0.0045 |
| growth | (0.001)*** | (0.001)*** | (0.001)*** | (0.001)*** | (0.001)*** |
| Zero exports in t-1 | -0.0884 | -0.0879 | -0.0881 | -0.0886 | -0.0879 |
| (0.007)*** | (0.007)*** | (0.007)*** | (0.007)*** | (0.007)*** | |
| N | 95656 | 95656 | 95656 | 95656 | 95656 |
| R2 | 0.35 | 0.35 | 0.35 | 0.35 | 0.35 |
| KP F Stat | 58.21 | 78.93 | |||
[i] *p < 0.10, **p < 0.05, ***p < 0.01.
Notes: Standard errors clustered at the partner country level reported in parenthesis.
Source: Bahar and Rapoport (2018).
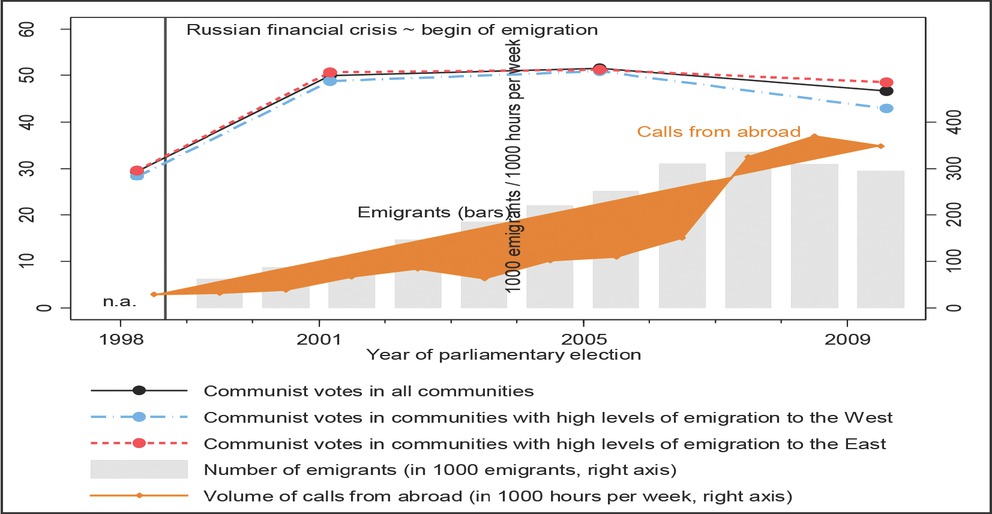
Fig. 1
Emigration and political change in Moldova, 1998–2009
Source: Barsbai et al. (2017).
Table 3
East/west migration and general election results in Moldova, July 2009
| Share of votes the for Communist Party (%) | Share of votes for the opposition parties (%) | ||||||
|---|---|---|---|---|---|---|---|
| Basic controls | Plus pre- migration election results | Plus night-time light (full model) | Liberal Democratic Party | Liberal Party | Democratic Party | Party Alliance Our Moldova | |
| (1) | (2) | (3) | (4) | (5) | (6) | (7) | |
| Prevalence of | -0.70*** | -0.63*** | -0.63*** | 0.40*** | 0.24** | 0.08 | -0.16 |
| emigration to the west (%) | (0.20) | (0.18) | (0.18) | (0.13) | (0.11) | (0.12) | (0.15) |
| Prevalence of | 0.44** | 0.39** | 0.39** | -0.07 | -0.17** | -0.07 | -0.01 |
| emigration to the east (%) | (0.17) | (0.16) | (0.16) | (0.09) | (0.07) | (0.08) | (0.11) |
| Basic controls | yes | Yes | Yes | yes | yes | yes | yes |
| Pre-election migration results | - | Yes | Yes | yes | yes | yes | yes |
| Night-time light | - | - | Yes | yes | yes | yes | yes |
| District fixed effects | yes | yes | Yes | yes | yes | yes | yes |
| Number of observations | 848 | 848 | 848 | 848 | 848 | 848 | 848 |
| R2 | 0.78 | 0.82 | 0.82 | 0.56 | 0.66 | 0.42 | 0.37 |
[i] Notes: The table reports OLS estimates for 848 Moldovan communities. The dependent variables are the vote shares of different parties in the July 2009 parliamentary election at the community level (in percent). Table A3 in the appendix shows the full regression results. Standard errors clustered at the district level in parentheses. *** denotes statistical significance at the 1% level, ** at the 5% level, and * at the 10% level.
Source: Barsbai et al. (2017).
Table 4
Bilateral migration and cultural convergence by development status
| North-North | South-North | South-South | |||||||
|---|---|---|---|---|---|---|---|---|---|
| Euclidean | Herfindahl | Canberra | Euclidean | Herfindahl | Canberra | Euclidean | Herfindahl | Canberra | |
| (1) | (2) | (3) | (4) | (5) | (6) | (7) | (8) | (9) | |
| Migration | -0.00334 | -0.0564* | -0.209*** | 0.0541*** | 0.0367*** | 0.0616*** | 0.0111 | 0.0121 | 0.0129 |
| (0.0384) | (0.0316) | (0.0595) | (0.0151) | (0.0124) | (0.0192) | (0.0146) | (0.0112) | (0.0162) | |
| Trade | 0.0484 | 0.00482 | 0.0660 | 0.0120 | -0.0199 | -0.0394 | -0.0392* | -0.0220 | 0.00725 |
| (0.0971) | (0.0798) | (0.150) | (0.0256) | (0.0210) | (0.0326) | (0.0228) | (0.0175) | (0.0252) | |
| Constant | -0.360 | 1.412 | 4.312 | -0.540 | -0.145 | 0.0573 | 0.909** | 0.324 | -0.0141 |
| (2.159) | (1.774) | (3.345) | (0.521) | (0.428) | (0.662) | (0.448) | (0.344) | (0.496) | |
| Observations | 702 | 702 | 702 | 3,108 | 3,108 | 3,108 | 3,173 | 3,173 | 3,173 |
| R2 | 0.953 | 0.991 | 0.944 | 0.983 | 0.982 | 0.966 | 0.958 | 0.981 | 0.960 |
[i] Notes: Standard errors in parentheses, *** p<0.01, ** p<0.05, * p<0.1. OLS regression with full set of fixed effects (bilateral fixed effect, destination-year fixed effect, origin-year fixed effect). Sample split into three categories: North-North for bilateral migration between OECD countries (members in 2014). South-South. Source: Rapoport et al. (2017).