
Table 1
Parental co-residence with children, 1993–2017
| Child lives with | 1993 | 2008 | 2017 |
|---|---|---|---|
| Both parents | 34.6 (1.06) | 27.1 (1.37) | 30.4 (0.60) |
| Mother, not father | 43.4 (0.90) | 44.7 (1.17) | 45.4 (0.59) |
| Father, not mother | 2.7 (0.23) | 2.5 (0.31) | 3.1 (0.18) |
| Neither parent | 19.3 (0.72) | 25.8 (0.99) | 21.1 (0.45) |
[i] Notes: The sample includes African children under 15 years. Standard errors are in parentheses.
Source: PSLSD 1993; NIDS 2008; GHS 2017.
GHS, General Household Survey; NIDS, National Income Dynamics Study; PSLSD, Project for Statistics on Living Standards and Development.
Table 2
Contribution of orphaning to parental absence
| 1993 | 2017 | |
|---|---|---|
| Number of children without a coresident mother | 2.6million | 3.4million |
| Mother deceased (as a percentage of children without coresident mother) | 8% | 18% |
| Number of children without a coresident father | 7.4million | 9.4million |
| Father deceased (as a percentage of children without coresident father) | 11% | 15% |
[i] Note: The sample includes African children under 15 years.
Source: PSLSD 1993; GHS 2017.
GHS, General Household Survey; PSLSD, Project for Statistics on Living Standards and Development.
Table 3
Parental contact and financial support to children
| How frequently does (parent) see the child? | Mother | Father | ||
|---|---|---|---|---|
| Non-resident household member | Absent: lives elsewhere | Non-resident household member | Absent: lives elsewhere | |
| Every day | 0.4 (0.32) | 4.3 (0.89) | 0.0 | 5.4 (0.56) |
| Several times a week | 9.9 (2.97) | 13.8 (1.77) | 16.5 (6.29) | 13.0 (0.99) |
| Several times a month | 55.3 (5.08) | 39.4 (2.52) | 49.5 (5.88) | 24.8 (1.07) |
| Several times a year | 32.1 (2.73) | 34.6 (2.56) | 32.7 (5.67) | 26.2 (1.26) |
| Never | 2.4 (1.06) | 8.0 (1.05) | 1.2 (0.71) | 30.6 (1.05) |
| (Parent) supports the child financially | 70.3 (5.03) | 50.4 (2.33) | 82.5 (3.99) | 38.3 (1.44) |
[i] Notes: The sample includes African children under 15 years. Standard errors are in parentheses.
Source: NIDS 2008.
NIDS, National Income Dynamics Study.
Table 4
Sending and receiving geotypes for child migrants
| Sending destination (2008) | Receiving destination (2014–2015) | |||
|---|---|---|---|---|
| Urban | Rural (traditional authority) | Rural (farms) | Total | |
| Urban | 63.62 | 36.38 | – | 100 |
| Rural (traditional authority) | 46.71 | 51.64 | 1.65 | 100 |
| Rural (farms) | 24.21 | 73.85 | 1.94 | 100 |
| Total | 53.14 | 45.96 | 0.90 | 100 |
[i] Notes: The sample is based on the balanced panel of African children aged 0–8 years in wave
1 who moved across district municipality boundaries at least once over waves 1–4. Only the final (wave 4) destination is recorded here, although there may have been multiple moves between waves. Panel weights are used.
Source: NIDS waves 1 and 4.
NIDS, National Income Dynamics Study.
Table 5
Likelihood of child migration by mother’s migration and employment status
| Odds ratio | Standard error | |
|---|---|---|
| Mother migrated | 42.952*** | 0.178 |
| Mother’s employment status (wave 1) | ||
| Unemployed: not actively searching | 1.090*** | 0.007 |
| Unemployed: actively seeking work | 2.386*** | 0.012 |
| Employed | 1.420*** | 0.007 |
| Child’s age (wave 1) | 1.224*** | 0.003 |
| (Child’s age)2 (wave 1) | 0.965*** | 0.000 |
| Child’s geotype (wave 1) | ||
| Urban areas | 2.918*** | 0.012 |
| Commercial farms | 8.850*** | 0.065 |
| Number of observations = 2,433 | ||
| Log pseudo-likelihood = −1,143,443.9 |
[i] Notes: The sample consists of African children who were aged 0–8 years in wave 1 and initially coresident with their mothers, and whose mothers were still alive at wave 4. The data are weighted to be nationally representative. Omitted categories: not economically active and traditional authority rural areas.
***Significant at the 1% level.
Source: NIDS waves 1–4.
NIDS, National Income Dynamics Study.
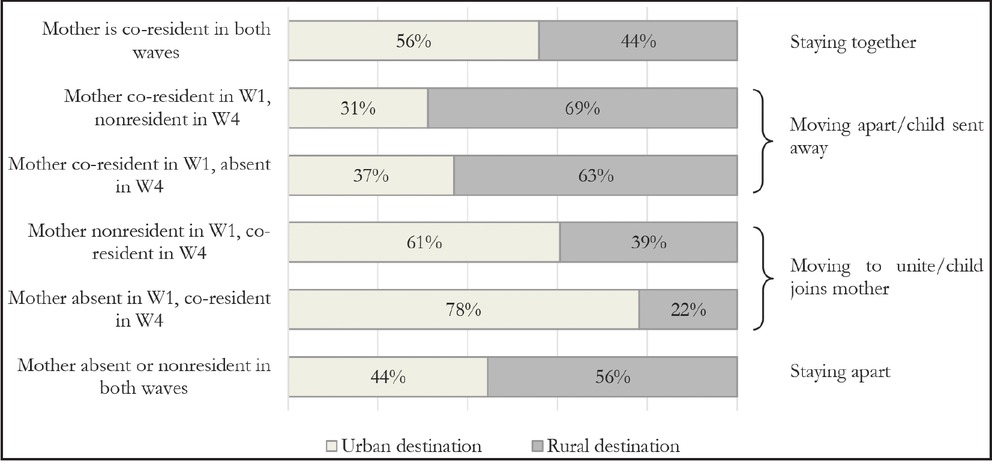
Figure 1
Urban/rural location of receiving households for child migrants in wave 4, by change in maternal co-residence status over waves 1–4
Notes: The sample is based on African children aged 0–8 years in wave 1 who experienced a migration event over the panel and whose mothers were alive in wave 4. Panel weights are used. Source: NIDS waves 1 and 4 (mother and child co-residence status); waves 1–4 (child migrant status). NIDS, National Income Dynamics Study.
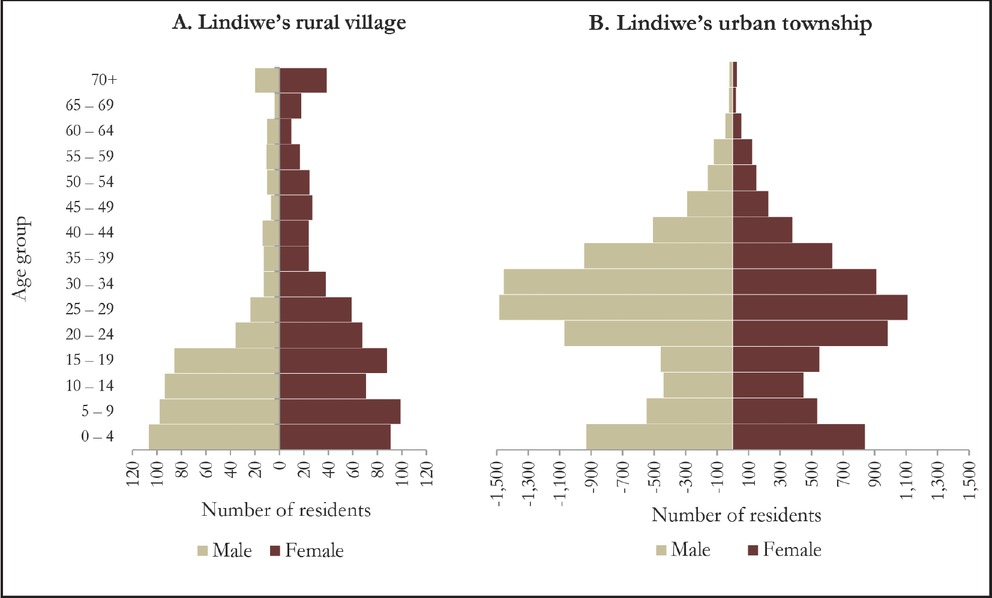
Figure 2
Population pyramids for the rural and urban sites
Source: Population Census 2011.