
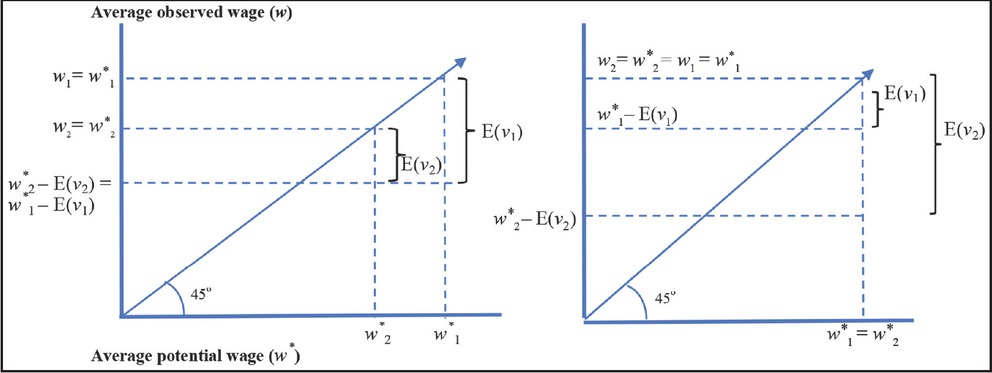
Figure 1
Differences between observed and potential wage gaps
Notes: The horizontal axis in both graphs shows the average potential wage (w*) for workers in Group 1 and Group 2. The vertical axis reflects the realized wages (w) observed in the market for the same groups. Under ideal circumstances, there is no market inefficiency (E(v) = 0) and potential wages are equal to observed wages on the 45-degree line.
Table 1
Distribution of native-born and immigrant workers by NHRI and education degrees – 2006 (weighted)
| NHRI (for native-born workers) | |||||||||
|---|---|---|---|---|---|---|---|---|---|
| Native-born workers | Immigrants (Canadian educated) | Immigrants (internationally educated) | |||||||
| Degree | 1.0–0.2 | 0.2–0.0 | Total | 1.0–0.2 | 0.2–0.0 | Total | 1.0–0.2 | 0.2–0.0 | Total |
| Apprenticeship | 38.1% | 61.9% | 883,215 | 36.3% | 63.7% | 104,895 | 23.9% | 76.1% | 47,865 |
| Trades | 46.8% | 53.2% | 449,475 | 41.8% | 58.2% | 66,635 | 26.2% | 73.8% | 30,210 |
| College <1 year | 38.8% | 61.2% | 301,460 | 38.1% | 61.9% | 51,700 | 23.5% | 76.5% | 11,375 |
| College 1–2 years | 41.5% | 58.5% | 1,199,525 | 39.7% | 60.3% | 173,530 | 22.6% | 77.4% | 52,470 |
| College >2 years | 49.5% | 51.5% | 916,480 | 44.3% | 55.7% | 147,055 | 23.6% | 76.4% | 78,770 |
| University <bachelors | 44.2% | 56.8% | 430,945 | 37.9% | 62.1% | 115,940 | 20.1% | 79.9% | 105,135 |
| Bachelors | 47.3% | 53.7% | 1,504,535 | 42.2% | 57.8% | 279,505 | 24.3% | 75.7% | 270,605 |
| University >bachelors | 57.2% | 43.8% | 220,400 | 51.1% | 48.9% | 44,485 | 26.0% | 74.0% | 51,915 |
| Degrees in medicine | 77.6% | 23.4% | 20,605 | 70.0% | 30.0% | 6,360 | 26.8% | 73.2% | 13,355 |
| Total | 44.9% | 55.1% | 5,926,640 | 41.3% | 58.7% | 990,105 | 23.7% | 76.3% | 661,700 |
[i] Notes: (i) The highest degrees associated with a field of study reported here are based on the Statistics Canada classification in the 2006 census. These are apprenticeship certificate or diploma; other trades certificate or diploma; college, CEGEP (Collège d’enseignement général et professionnel) or other non-university certificate, or diploma from a program of 3 months to less than 1 year duration; college, CEGEP or other nonuniversity certificate or diploma from a program of 1 year to 2 years duration; college, CEGEP or other nonuniversity certificate, or diploma from a program of more than 2 years duration; university certificate or diploma below the bachelor level; bachelor’s degree; university certificate or diploma above the bachelor level; and degree in medicine, dentistry, veterinary medicine, or optometry. (ii) The middle three columns for Canadian-educated immigrants include immigrants whose location of study is the US or the UK. NHRI.
Table 2
The wage gap across workers by nativity, NHRIC, education degrees, and location of study – 2006 and 2011
| OLS | SWF | |||||||
|---|---|---|---|---|---|---|---|---|
| 2006 | 2011 | 2006 | 2011 | |||||
| Trades X | Coefficient | SE | Coefficient | SE | Coefficient | SE | Coefficient | SE |
| N X CE X (NHRIC = 1) | Base | Base | ||||||
| N X CE X (NHRIC = 0) | -0.146 | 0.018 | -0.110 | 0.024 | -0.088 | 0.016 | -0.126 | 0.015 |
| I X CE X (NHRIC = 0) | -0.405 | 0.081 | -0.192 | 0.083 | -0.272 | 0.059 | -0.182 | 0.070 |
| I X CE X (NHRIC = 1) | -0.142 | 0.063 | -0.165 | 0.074 | -0.125 | 0.073 | -0.077 | 0.068 |
| I X FE X (NHRIC = 0) | -0.386 | 0.115 | -0.378 | 0.126 | -0.301 | 0.059 | -0.333 | 0.077 |
| I X FE X (NHRIC = 1) | -0.637 | 0.296 | -0.071 | 0.075 | -0.486 | 0.102 | -0.055 | 0.100 |
| College and below bachelor’s X | ||||||||
| N X CE X (NHRIC = 1) | Base | Base | ||||||
| N X CE X (NHRIC = 0) | -0.134 | 0.008 | -0.061 | 0.012 | -0.090 | 0.007 | -0.083 | 0.008 |
| I X CE X (NHRIC = 0) | -0.294 | 0.030 | -0.147 | 0.034 | -0.219 | 0.020 | -0.103 | 0.023 |
| I X CE X (NHRIC = 1) | -0.120 | 0.036 | -0.279 | 0.247 | -0.110 | 0.032 | 0.020 | 0.036 |
| I X FE X (NHRIC = 0) | -0.478 | 0.027 | -0.313 | 0.030 | -0.396 | 0.019 | -0.247 | 0.022 |
| I X FE X (NHRIC = 1) | -0.345 | 0.063 | -0.055 | 0.045 | -0.239 | 0.040 | 0.039 | 0.045 |
| Bachelor’s X | ||||||||
| N X CE X (NHRIC = 1) | Base | Base | ||||||
| N X CE X (NHRIC = 0) | -0.099 | 0.010 | -0.064 | 0.012 | -0.090 | 0.009 | -0.114 | 0.009 |
| I X CE X (NHRIC = 0) | -0.322 | 0.030 | -0.222 | 0.034 | -0.287 | 0.024 | -0.259 | 0.024 |
| I X CE X (NHRIC = 1) | -0.117 | 0.036 | -0.083 | 0.037 | -0.105 | 0.035 | -0.053 | 0.035 |
| I X FE X (NHRIC = 0) | -0.595 | 0.025 | -0.421 | 0.027 | -0.534 | 0.017 | -0.430 | 0.020 |
| I X FE X (NHRIC = 1) | -0.341 | 0.050 | -0.199 | 0.039 | -0.286 | 0.031 | -0.157 | 0.037 |
| Graduate X | ||||||||
| N X CE X (NHRIC = 1) | Base | Base | ||||||
| N X CE X (NHRIC = 0) | -0.042 | 0.015 | -0.049 | 0.018 | -0.049 | 0.012 | -0.072 | 0.012 |
| I X CE X (NHRIC = 0) | -0.360 | 0.036 | -0.291 | 0.038 | -0.275 | 0.026 | -0.179 | 0.026 |
| I X CE X (NHRIC = 1) | 0.109 | 0.061 | -0.137 | 0.052 | -0.132 | 0.039 | -0.029 | 0.039 |
| I X FE X (NHRIC = 0) | -0.636 | 0.032 | -0.456 | 0.038 | -0.571 | 0.021 | -0.372 | 0.023 |
| I X FE X (NHRIC = 1) | -0.143 | 0.047 | -0.241 | 0.047 | -0.352 | 0.035 | -0.191 | 0.041 |
[i] Notes: N, I, CE, FE, NHRIC = 1, and NHRIC = 0 denote native born, immigrant, Canadian educated, foreign educated, NHRIC 1 (i.e. NHRI is between 1 and 0.8), and NHRIC 2 (i.e. NHRI is between 0.8 and 0), respectively. The dependent variable in all specifications is log weekly wage. In each specification we control for age, age square, marital status, primary earner status, spoken language, a binary variable that identifies visible minority status in detail, regional fixed effects for 10 provinces, field of study and occupation fixed effects, and years since migration interacted as reported in Table 3. Standard errors are corrected for heteroscedasticity in specifications estimated by OLS. NHRIC, normalized horizontal relatedness index category; OLS, ordinary least squares; SWF, stochastic wage frontier; SE, standard error; NHRI, normalized horizontal relatedness index.
Table 3
The effect of YSM on the wage gap between native-born and immigrant workers by NHRIC, education degrees, and location of study – 2006 and 2011
| OLS | SWF | |||||||
|---|---|---|---|---|---|---|---|---|
| 2006 | 2011 | 2006 | 2011 | |||||
| Coefficient | SE | Coefficient | SE | Coefficient | SE | Coefficient | SE | |
| Trades X | ||||||||
| I X CE X (NHRIC = 0) X YSM | 0.007 | 0.002 | 0.002 | 0.003 | 0.004 | 0.002 | 0.003 | 0.002 |
| I X CE X (NHRIC = 1) X YSM | 0.004 | 0.002 | 0.003 | 0.002 | 0.004 | 0.002 | 0.001 | 0.002 |
| I X FE X (NHRIC = 0) X YSM | 0.003 | 0.007 | 0.005 | 0.006 | 0.002 | 0.003 | 0.005 | 0.004 |
| I X FE X (NHRIC = 1) X YSM | 0.016 | 0.014 | -0.004 | 0.005 | 0.014 | 0.005 | 0.000 | 0.005 |
| College and below | ||||||||
| bachelor’s X | ||||||||
| I X CE X (NHRIC = 0) X YSM | 0.004 | 0.001 | 0.002 | 0.001 | 0.003 | 0.001 | 0.002 | 0.001 |
| I X CE X (NHRIC = 1) X YSM | 0.003 | 0.002 | 0.000 | 0.002 | 0.003 | 0.001 | 0.002 | 0.001 |
| I X FE X (NHRIC = 0) X YSM | 0.011 | 0.002 | 0.006 | 0.001 | 0.010 | 0.001 | 0.004 | 0.001 |
| I X FE X (NHRIC = 1) X YSM | 0.012 | 0.003 | -0.001 | 0.004 | 0.009 | 0.002 | -0.002 | 0.002 |
| Bachelor’s X | ||||||||
| I X CE X (NHRIC = 0) X YSM | 0.008 | 0.001 | 0.006 | 0.001 | 0.007 | 0.001 | 0.005 | 0.001 |
| I X CE X (NHRIC = 1) X YSM | 0.004 | 0.001 | 0.004 | 0.001 | 0.003 | 0.001 | 0.004 | 0.001 |
| I X FE X (NHRIC = 0) X YSM | 0.013 | 0.002 | 0.010 | 0.002 | 0.012 | 0.001 | 0.007 | 0.001 |
| I X FE X (NHRIC = 1) X YSM | 0.009 | 0.005 | 0.004 | 0.003 | 0.006 | 0.002 | 0.001 | 0.003 |
| Graduate X | ||||||||
| I X CE X (NHRIC = 0) X YSM | 0.010 | 0.001 | 0.008 | 0.001 | 0.007 | 0.001 | 0.008 | 0.001 |
| I X CE X (NHRIC = 1) X YSM | 0.006 | 0.002 | 0.004 | 0.002 | 0.005 | 0.001 | 0.004 | 0.002 |
| I X FE X (NHRIC = 0) X YSM | 0.018 | 0.002 | 0.009 | 0.002 | 0.016 | 0.001 | 0.009 | 0.001 |
| I X FE X (NHRIC = 1) X YSM | 0.014 | 0.006 | 0.003 | 0.005 | 0.014 | 0.003 | 0.005 | 0.003 |
[i] Notes: N, I, CE, FE, YSM, NHRIC = 1, and NHRIC = 0 denote native born, immigrant, Canadian educated, foreign educated, years since migration, NHRIC 1 (i.e. NHRI is between 1 and 0.8), and NHRIC 2 (i.e. NHRI is between 0.8 and 0), respectively. The results reported here are a part of the same estimations reported in Table 2. Please see the notes to Table 2. NHRIC, normalized horizontal relatedness index category; OLS, ordinary least squares; SWF, stochastic wage frontier; SE, standard error; NHRI, normalized horizontal relatedness index.
Table 4
SWF estimates of the wage gap across workers by nativity, NHRIC, education degrees, and location of study with heteroskedastic inefficiency – 2006 and 2011
| 2006 | 2011 | |||
|---|---|---|---|---|
| Coefficient | SE | Coefficient | SE | |
| Trades X | ||||
| N X CE X (NHRIC = 1) | Base | |||
| N X CE X (NHRIC = 0) | -0.090 | 0.014 | -0.135 | 0.011 |
| I X CE X (NHRIC = 0) | -0.278 | 0.061 | -0.214 | 0.050 |
| I X CE X (NHRIC = 1) | -0.145 | 0.067 | -0.137 | 0.047 |
| I X FE X (NHRIC = 0) | -0.405 | 0.064 | -0.335 | 0.057 |
| I X FE X (NHRIC = 1) | -0.193 | 0.108 | -0.105 | 0.069 |
| College and below bachelor’s X | ||||
| N X CE X (NHRIC = 1) | Base | |||
| N X CE X (NHRIC = 0) | -0.096 | 0.006 | -0.083 | 0.008 |
| I X CE X (NHRIC = 0) | -0.178 | 0.016 | -0.103 | 0.023 |
| I X CE X (NHRIC = 1) | -0.080 | 0.026 | 0.020 | 0.036 |
| I X FE X (NHRIC = 0) | -0.331 | 0.016 | -0.247 | 0.022 |
| I X FE X (NHRIC = 1) | -0.090 | 0.032 | 0.039 | 0.045 |
| Bachelor’s X | ||||
| N X CE X (NHRIC = 1) | Base | |||
| N X CE X (NHRIC = 0) | -0.070 | 0.007 | -0.135 | 0.007 |
| I X CE X (NHRIC = 0) | -0.267 | 0.023 | -0.283 | 0.018 |
| I X CE X (NHRIC = 1) | -0.082 | 0.033 | -0.099 | 0.026 |
| I X FE X (NHRIC = 0) | -0.464 | 0.018 | -0.504 | 0.015 |
| I X FE X (NHRIC = 1) | -0.298 | 0.031 | -0.218 | 0.028 |
| Postsecondary X | ||||
| N X CE X (NHRIC = 1) | Base | |||
| N X CE X (NHRIC = 0) | -0.039 | 0.010 | -0.107 | 0.009 |
| I X CE X (NHRIC = 0) | -0.237 | 0.024 | -0.299 | 0.019 |
| I X CE X (NHRIC = 1) | -0.149 | 0.034 | -0.142 | 0.027 |
| I X FE X (NHRIC = 0) | -0.487 | 0.021 | -0.504 | 0.017 |
| I X FE X (NHRIC = 1) | -0.323 | 0.035 | -0.298 | 0.030 |
[i] Notes: N, I, CE, FE, NHRIC = 1, and NHRIC = 0 denote native born, immigrant, Canadian educated, foreign educated, NHRIC 1 (i.e. NHRI is between 1 and 0.8), and NHRIC 2 (i.e. NHRI is between 0.8 and 0), respectively. The dependent variable in both specifications is log weekly wage. In each specification, we control for age, age square, marital status, primary earner status, spoken language, a binary variable that identifies visible minority status in detail, regional fixed effects for 10 provinces, field of study and occupation fixed effects, and years since migration interacted as reported in Table 3. SWF, stochastic wage frontier; NHRIC, normalized horizontal relatedness index category; SE, standard error; NHRI, normalized horizontal relatedness index.
Table 5
Average marginal effects of visible minority status on E(vi) and V(vi) (%) – 2006 and 2011
| 2006 | 2011 | |||
|---|---|---|---|---|
| E(v) | V(v) | E(v) | V(v) | |
| South Asian | 7.00 | 2.07 | 11.54 | 4.24 |
| Chinese | 5.35 | 1.83 | 8.06 | 2.96 |
| Black | 1.13 | 0.37 | 2.99 | 1.10 |
| Filipino | -2.64 | -1.91 | -6.67 | -2.45 |
| Latin American | 6.04 | 1.22 | 5.81 | 2.13 |
| Arab | 16.38 | 4.93 | 8.07 | 2.96 |
| Southeast Asian | 2.59 | 1.60 | 4.26 | 1.57 |
| West Asian | 19.97 | 5.62 | 20.90 | 7.68 |
| Korean | 12.13 | 4.59 | 20.55 | 7.55 |
| Japanese | 7.22 | 1.78 | 2.74 | 1.01 |
| Visible minority, n.i.e | -0.49 | -8.03 | 3.62 | 1.33 |
| Multiple visible minority | 3.35 | 0.45 | 4.57 | 1.68 |
[i] n.i.e, Not included elsewehere.