
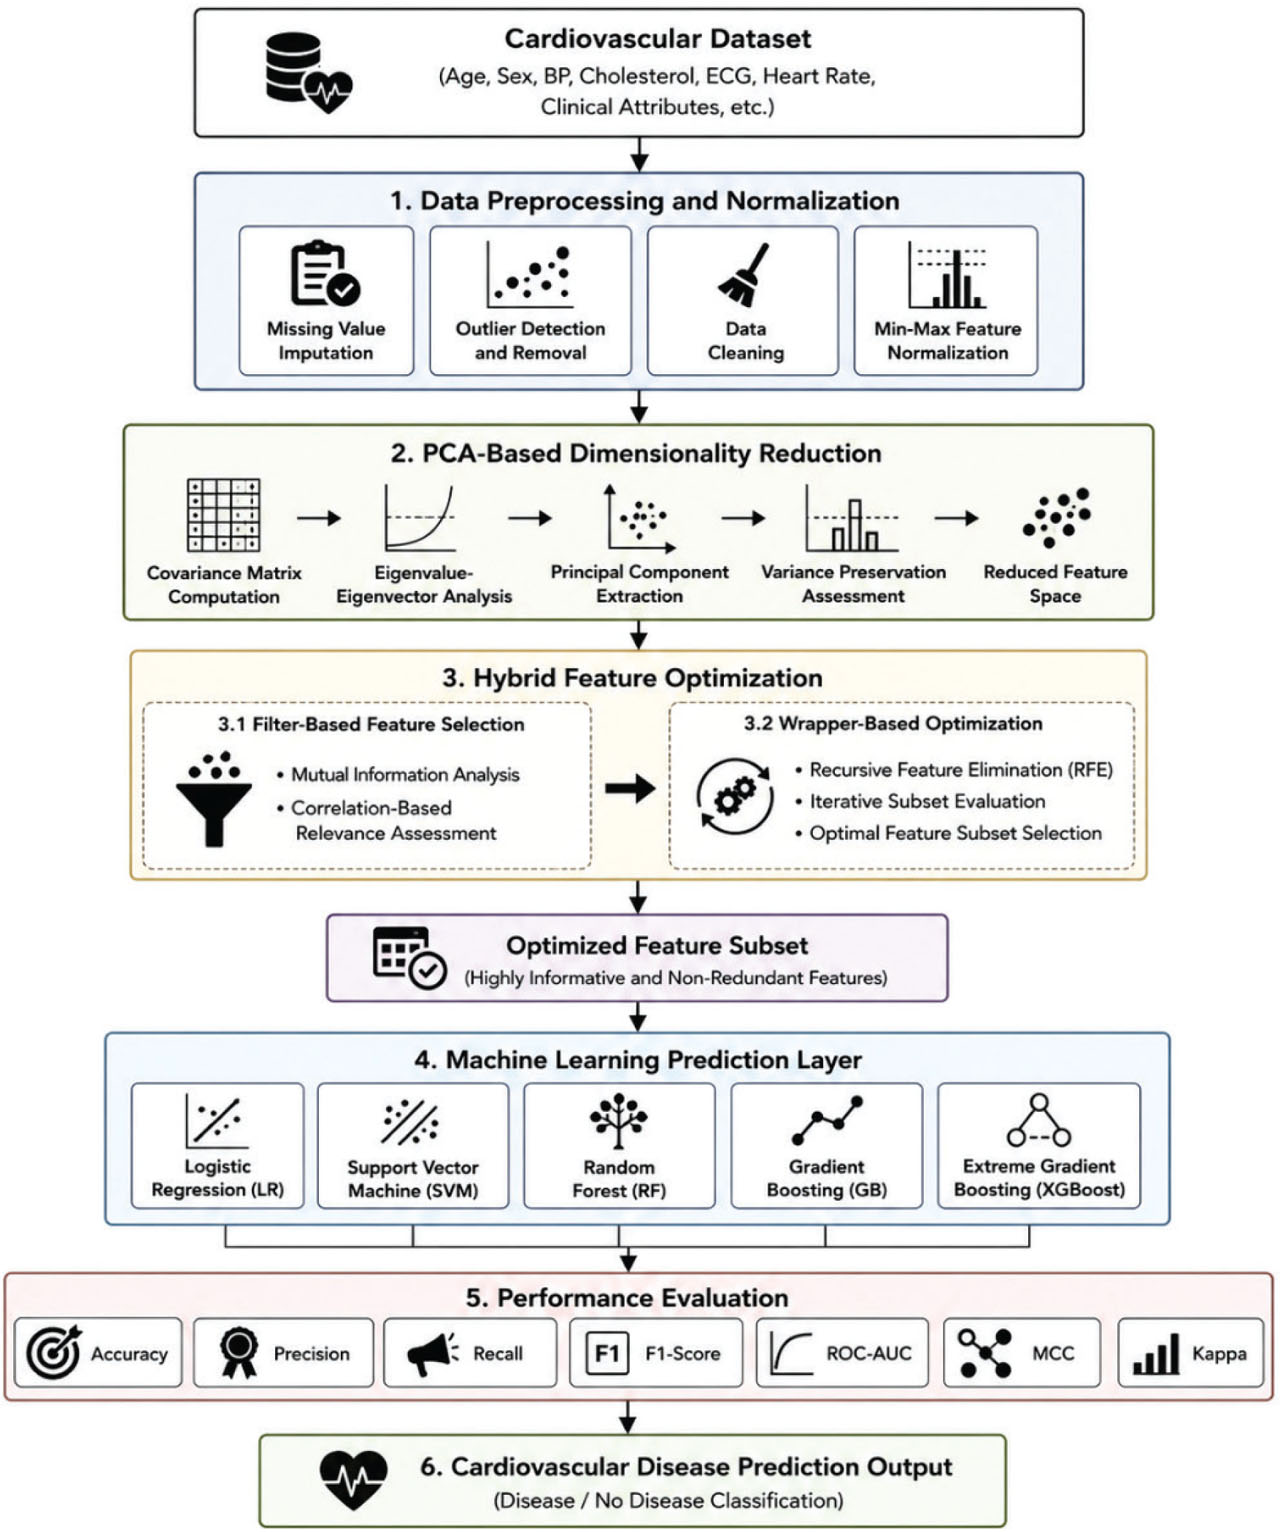
Figure 1:
Model architecture. GB, gradient boosting; LR, logistic regression; PCA, principal component analysis; RF, random forest; RFE, recursive feature elimination; SVM, support vector machine; XGBoost, extreme gradient boosting.
Table 1:
CVD dataset characteristics
| Parameter | Description | Value |
|---|---|---|
| Dataset name | CVD dataset | UCI/Kaggle |
| Total records | Number of patient instances | 70,000 |
| Total features | Clinical attributes | 13 |
| Numerical features | Continuous variables | 10 |
| Categorical features | Discrete variables | 3 |
| Positive cases | CVD present | 34,979 |
| Negative cases | CVD absent | 35,021 |
| Training samples | 80% of dataset | 56,000 |
| Testing samples | 20% of dataset | 14,000 |
| Validation strategy | Cross validation | 5-Fold |
Table 2:
Preprocessing statistics
| Operation | Before processing | After processing |
|---|---|---|
| Missing values | 1,245 | 0 |
| Outliers detected | 873 | 0 |
| Duplicate records | 214 | 0 |
| Invalid entries | 127 | 0 |
| Feature scale range | Heterogeneous | Uniform |
| Data consistency | Moderate | High |
Table 3:
PCA variance preservation analysis
| Principal components | Individual variance (%) | Cumulative variance (%) |
|---|---|---|
| PC1 | 31.25 | 31.25 |
| PC2 | 18.41 | 49.66 |
| PC3 | 14.62 | 64.28 |
| PC4 | 10.73 | 75.01 |
| PC5 | 8.11 | 83.12 |
| PC6 | 5.49 | 88.61 |
| PC7 | 3.94 | 92.55 |
| PC8 | 2.67 | 95.22 |
| PC9 | 1.96 | 97.18 |
| PC10 | 1.32 | 98.50 |
Table 4:
Feature importance ranking
| Rank | Feature | MI score | RFE score |
|---|---|---|---|
| 1 | Chest pain type | 0.912 | 0.934 |
| 2 | Maximum heart rate | 0.895 | 0.918 |
| 3 | ST depression | 0.873 | 0.904 |
| 4 | Cholesterol | 0.846 | 0.881 |
| 5 | Age | 0.831 | 0.867 |
| 6 | Resting blood pressure | 0.794 | 0.842 |
| 7 | Fasting blood sugar | 0.752 | 0.801 |
| 8 | Exercise angina | 0.721 | 0.783 |
| 9 | ECG result | 0.693 | 0.748 |
| 10 | Sex | 0.651 | 0.701 |
Table 5:
Feature reduction analysis
| Stage | Number of features | Reduction (%) |
|---|---|---|
| Original dataset | 13 | 0 |
| After PCA | 10 | 23.08 |
| After MI ranking | 8 | 38.46 |
| After RFE | 6 | 53.85 |
Table 6:
Performance comparison of ML models
| Model | Accuracy (%) | Precision (%) | Recall (%) | F1-score (%) | ROC-AUC (%) |
|---|---|---|---|---|---|
| LR | 92.14 | 91.63 | 91.52 | 91.57 | 93.01 |
| SVM | 94.27 | 93.88 | 93.64 | 93.76 | 95.18 |
| RF | 96.12 | 95.89 | 95.74 | 95.81 | 97.04 |
| GB | 96.84 | 96.42 | 96.18 | 96.30 | 97.61 |
| XGBoost | 98.31 | 98.06 | 97.95 | 98.00 | 99.02 |
Table 7:
Training time comparison
| Model | Training time (s) | Testing time (s) |
|---|---|---|
| LR | 1.34 | 0.12 |
| SVM | 4.86 | 0.44 |
| RF | 8.91 | 0.38 |
| GB | 12.37 | 0.52 |
| XGBoost | 10.18 | 0.29 |
Table 8:
Comparison with existing studies
| Method | Feature optimization | Classifier | Accuracy (%) | Precision (%) | Recall (%) |
|---|---|---|---|---|---|
| Mienye and Sun [10] | PSO-based optimization | SSAE | 93.20 | 92.50 | 92.10 |
| Jayasudha et al. [5] | Hybrid optimization | Deep ensemble | 95.70 | 95.12 | 94.83 |
| Raman et al. [14] | Hybrid feature selection | ML models | 96.45 | 95.88 | 95.74 |
| Proposed HFSDR-CVD | PCA + MI + RFE | XGBoost | 98.31 | 98.06 | 97.95 |
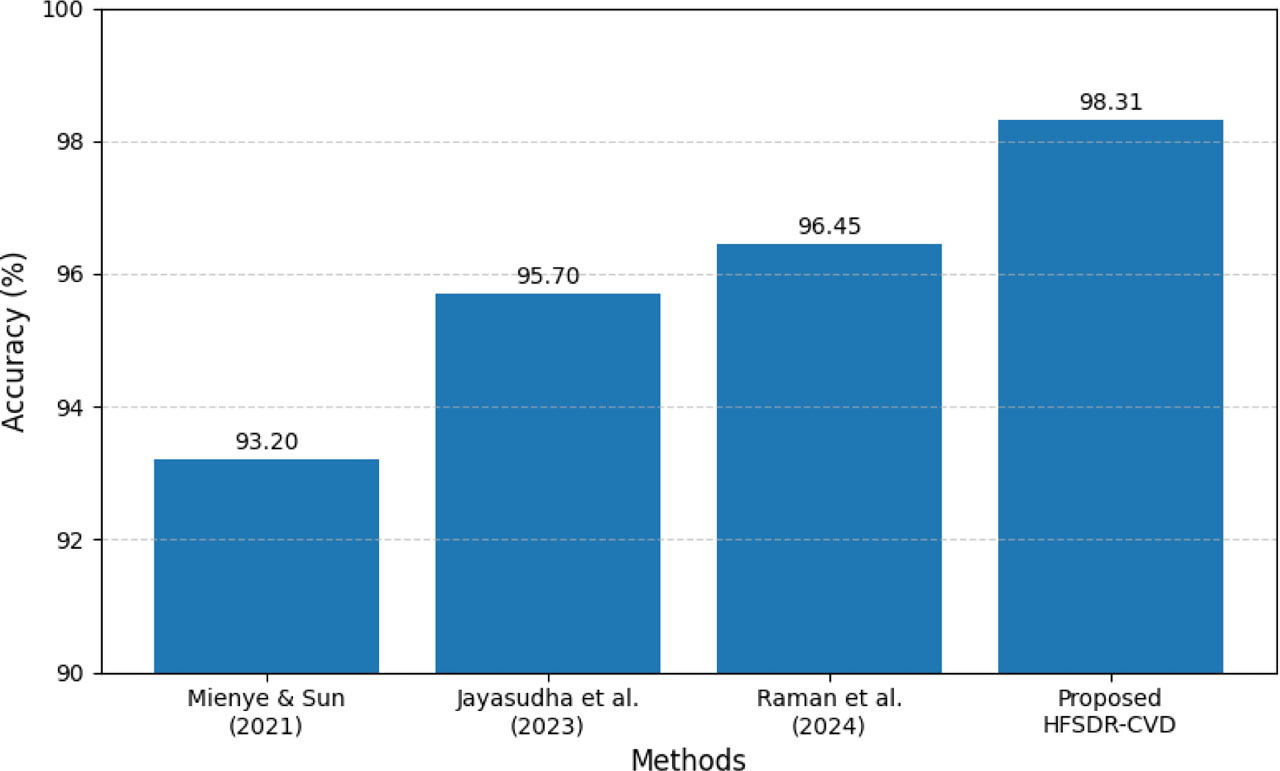
Figure 2:
Accuracy analysis. HFSDR-CVD, hybrid feature selection with dimensionality reduction framework for cardiovascular disease detection.
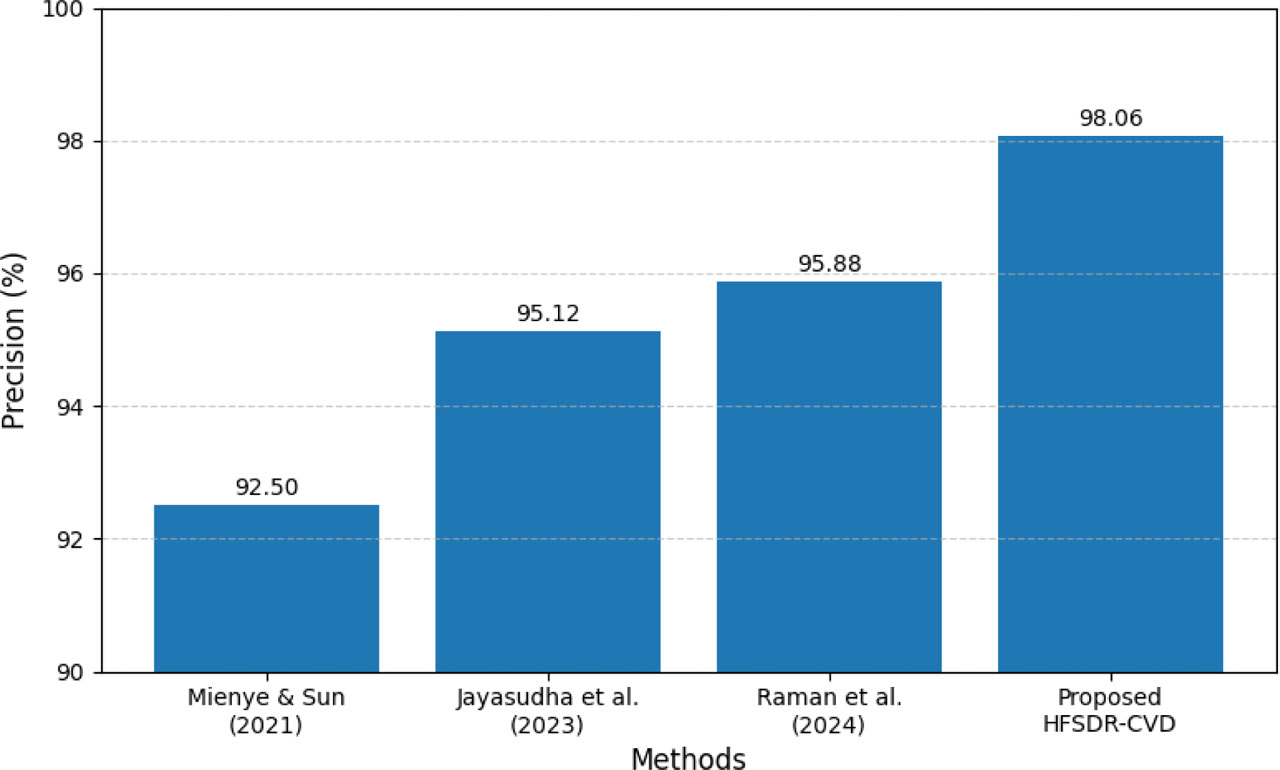
Figure 3:
Precision analysis. HFSDR-CVD, hybrid feature selection with dimensionality reduction framework for cardiovascular disease detection.
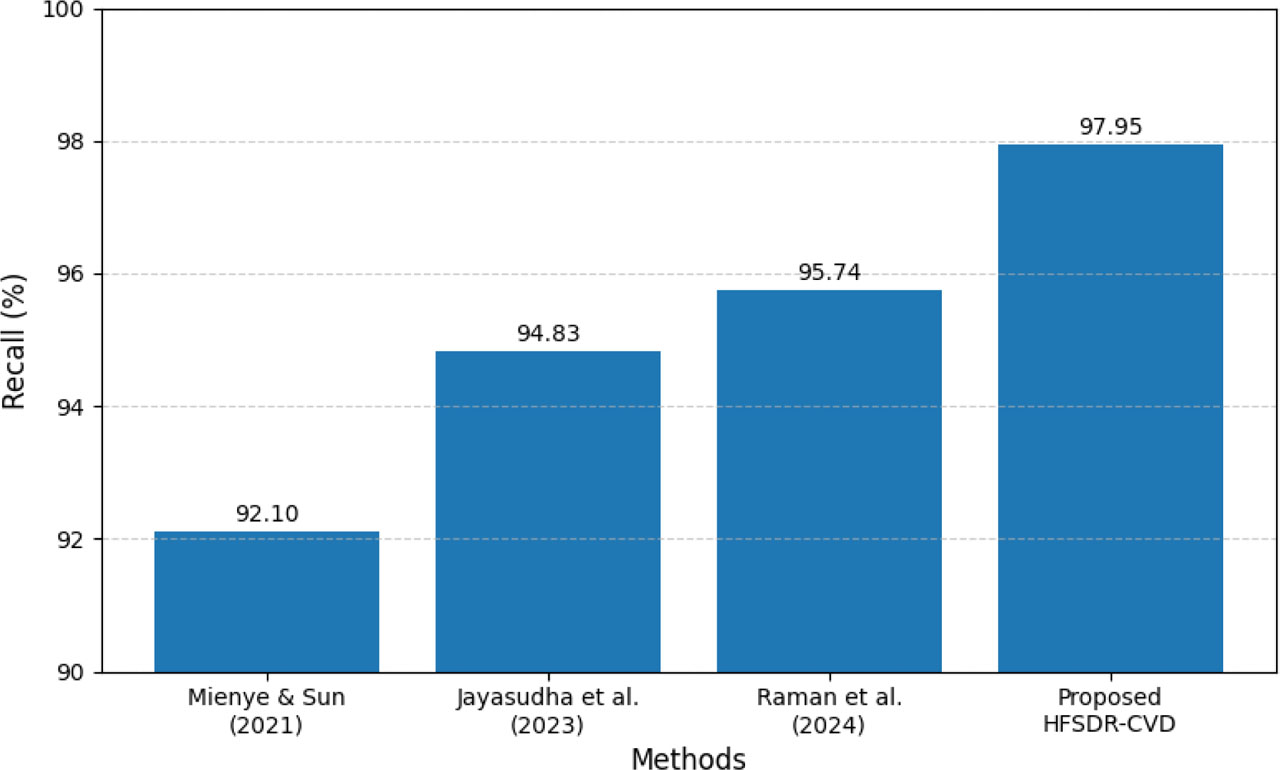
Figure 4:
Recall analysis. HFSDR-CVD, hybrid feature selection with dimensionality reduction framework for cardiovascular disease detection.