
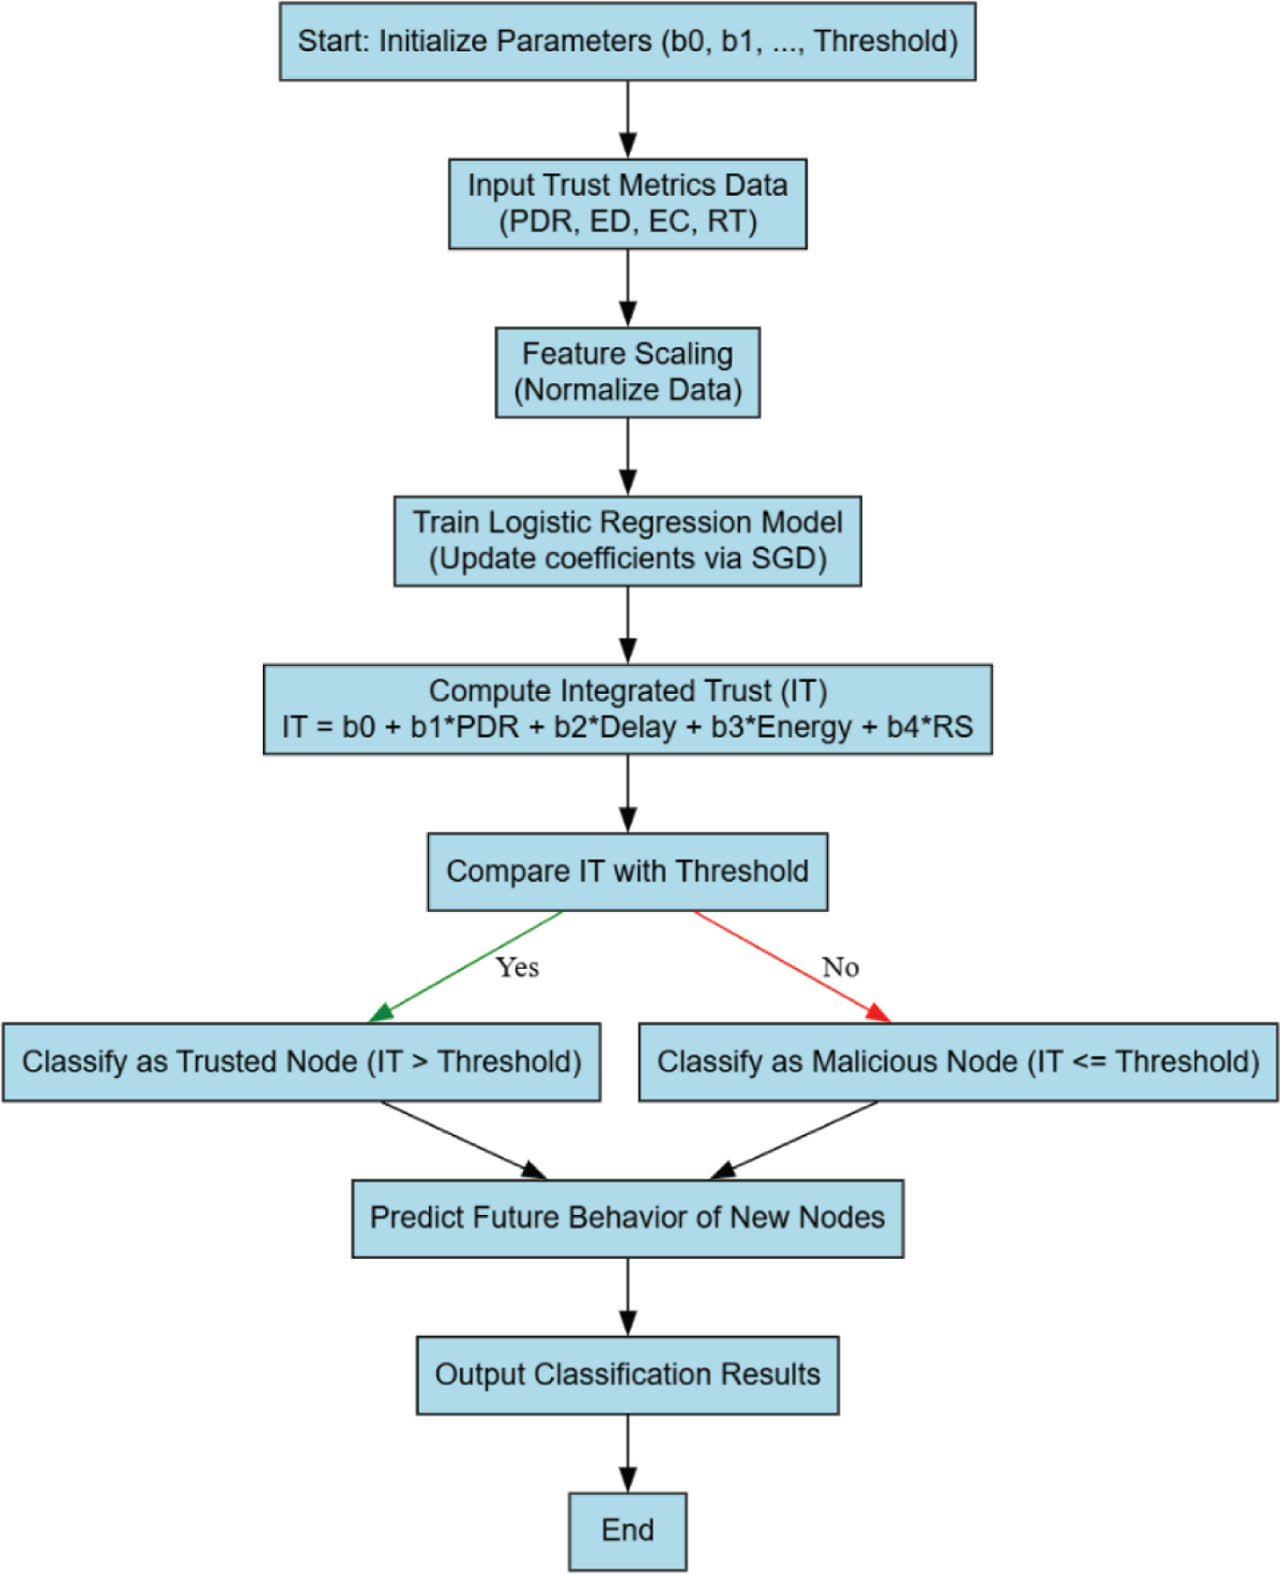
Figure 1:
Overview of proposed work. EC, energy consumption; ED, end-to-end delay; IT, integrated trust; PDR, packet delivery ratio; RT, reputation trust; SGD, stochastic gradient descent.
Table 1:
Simulation parameters
| Parameter | Value |
|---|---|
| Simulator | NS3 |
| Duration | 1000 s |
| Routing protocols | RPL, TRLS, David Airehrour et al. (2019) |
| No. of Nodes | 100 |
| No. of untrusted nodes | 10%, 20%….80% |
| Traffic type | CBR |
| Propagation model | Nakagami Model |
| Mobility model | Random Waypoint |
| MAC type | IEEE 802.11 |
| Mode of channel | Wireless |
| Data payload | 512 B/packet |
| Simulation area | 1000 m × 1000 m |
| Nodes’ speed | 5 – 10 – 15 – 20 – 25 (m/s) |
| Data rate | 10.4 Mbps |
| RPL parameter | MinHopRankIncrease = 256 |
| LR learning rate | 0.01 |
| Number of iterations (training) | 1,000 |
| Threshold | 0.5 |
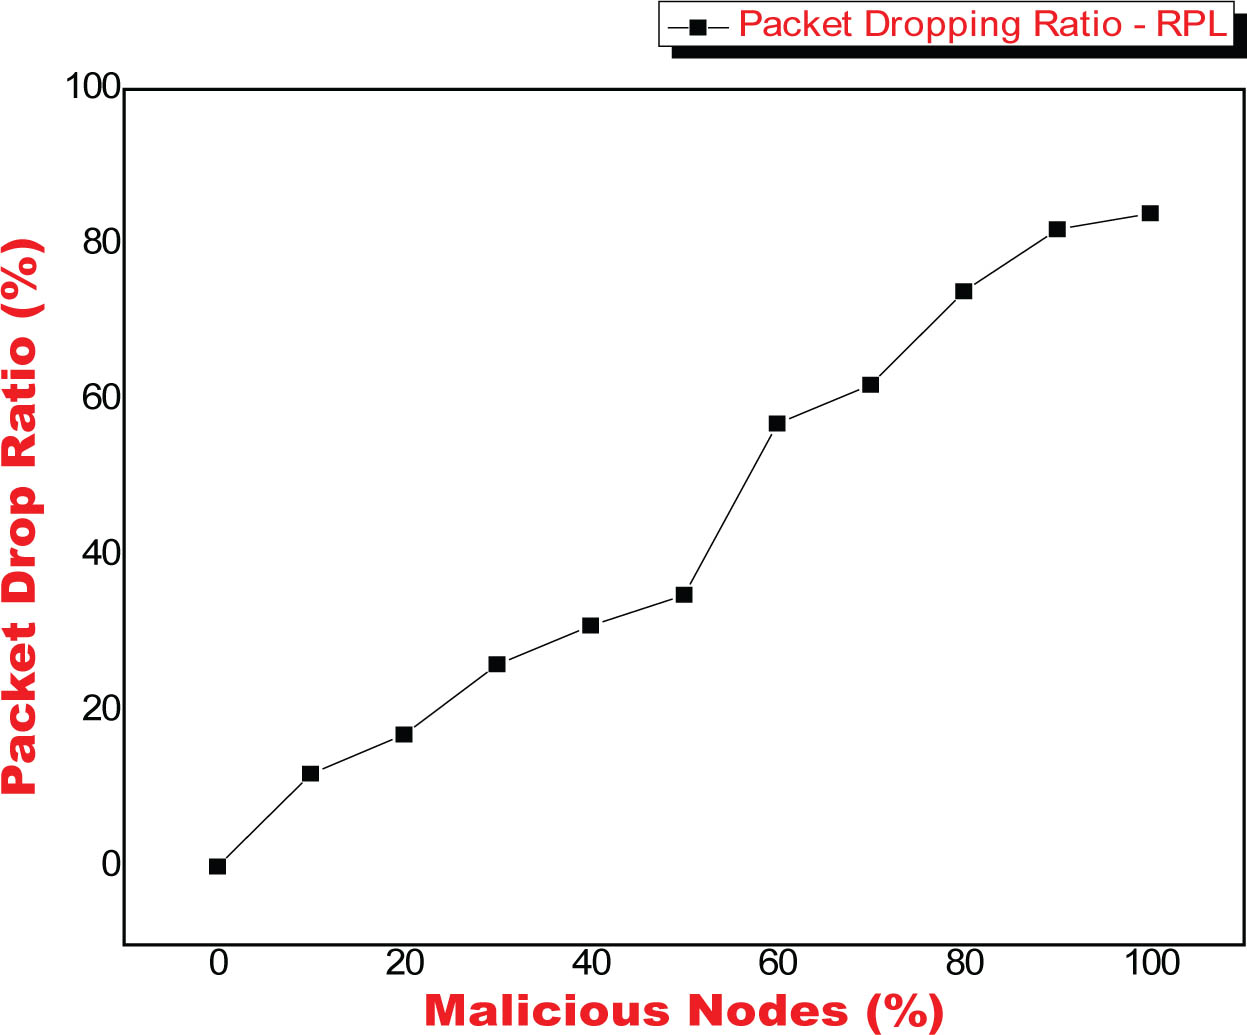
Figure 2:
Influence of black hole nodes under normal RPL routing protocol. RPL, routing protocol for low-power lossy network.
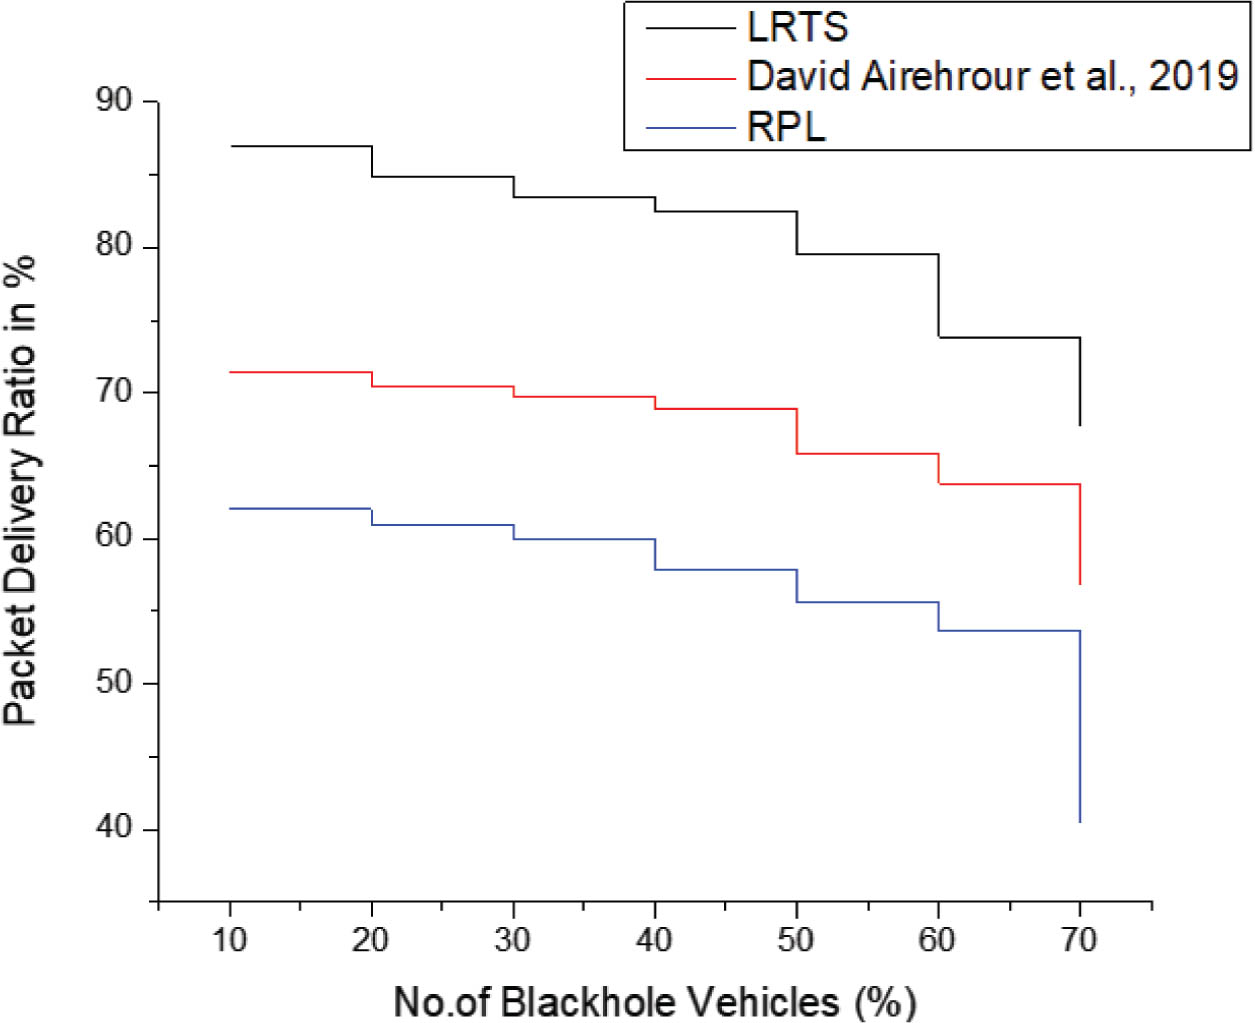
Figure 3:
PDR versus % of blackhole nodes. LRTS, logistic regression-based trust-based security; PDR, packet delivery ratio; RPL, routing protocol for low power lossy networks.
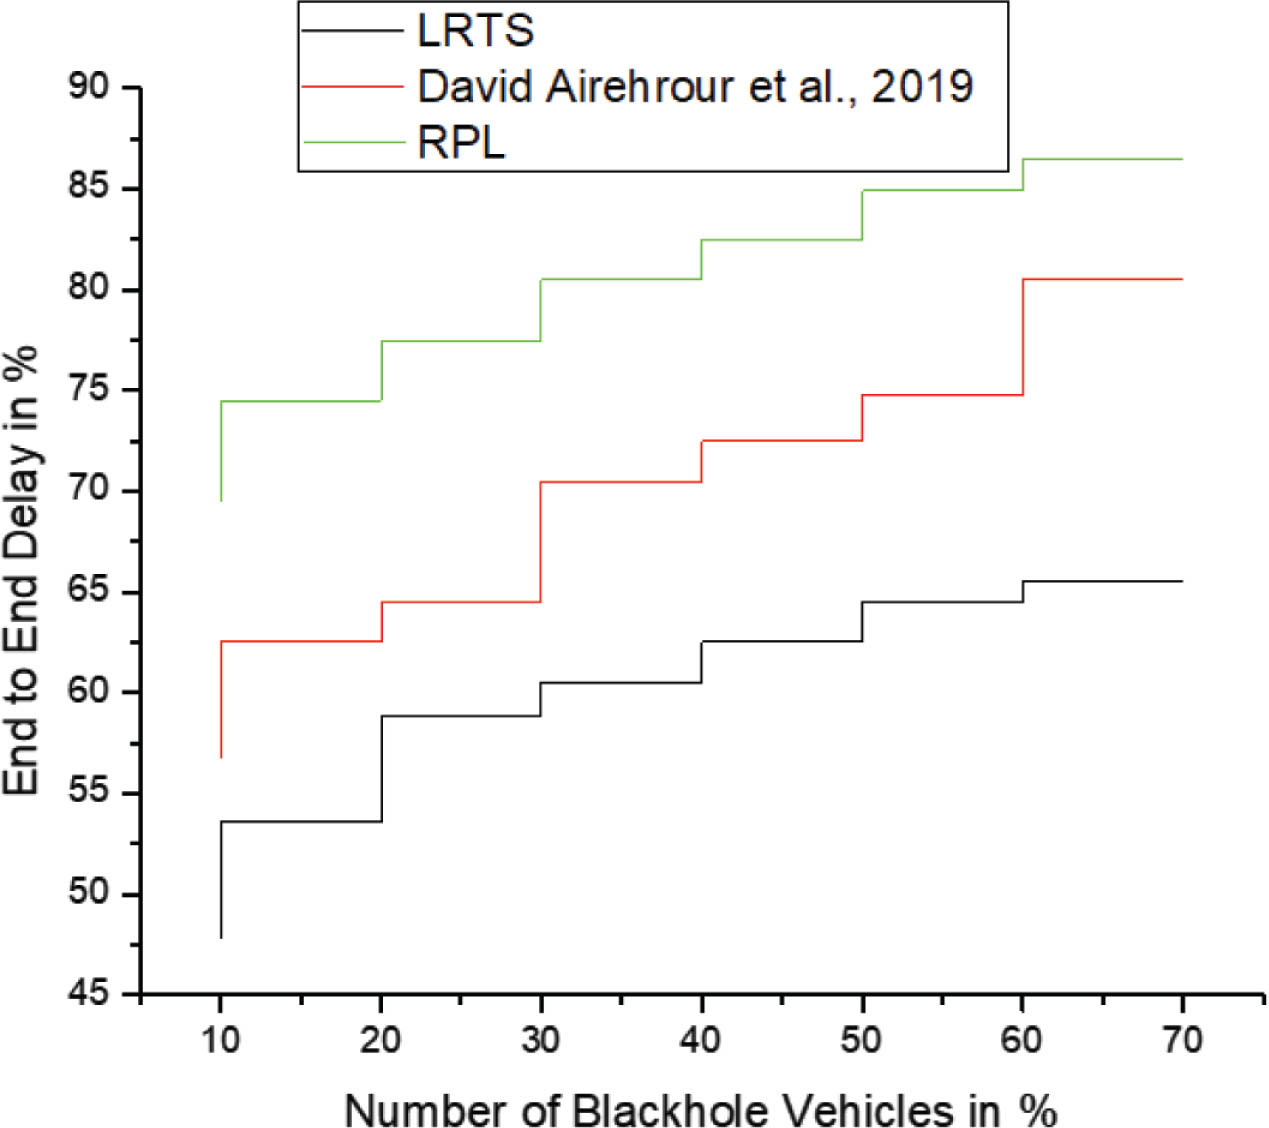
Figure 4:
Average delay versus % blackhole nodes. LRTS, logistic regression-based trust-based security; RPL, routing protocol for low-power lossy networks.
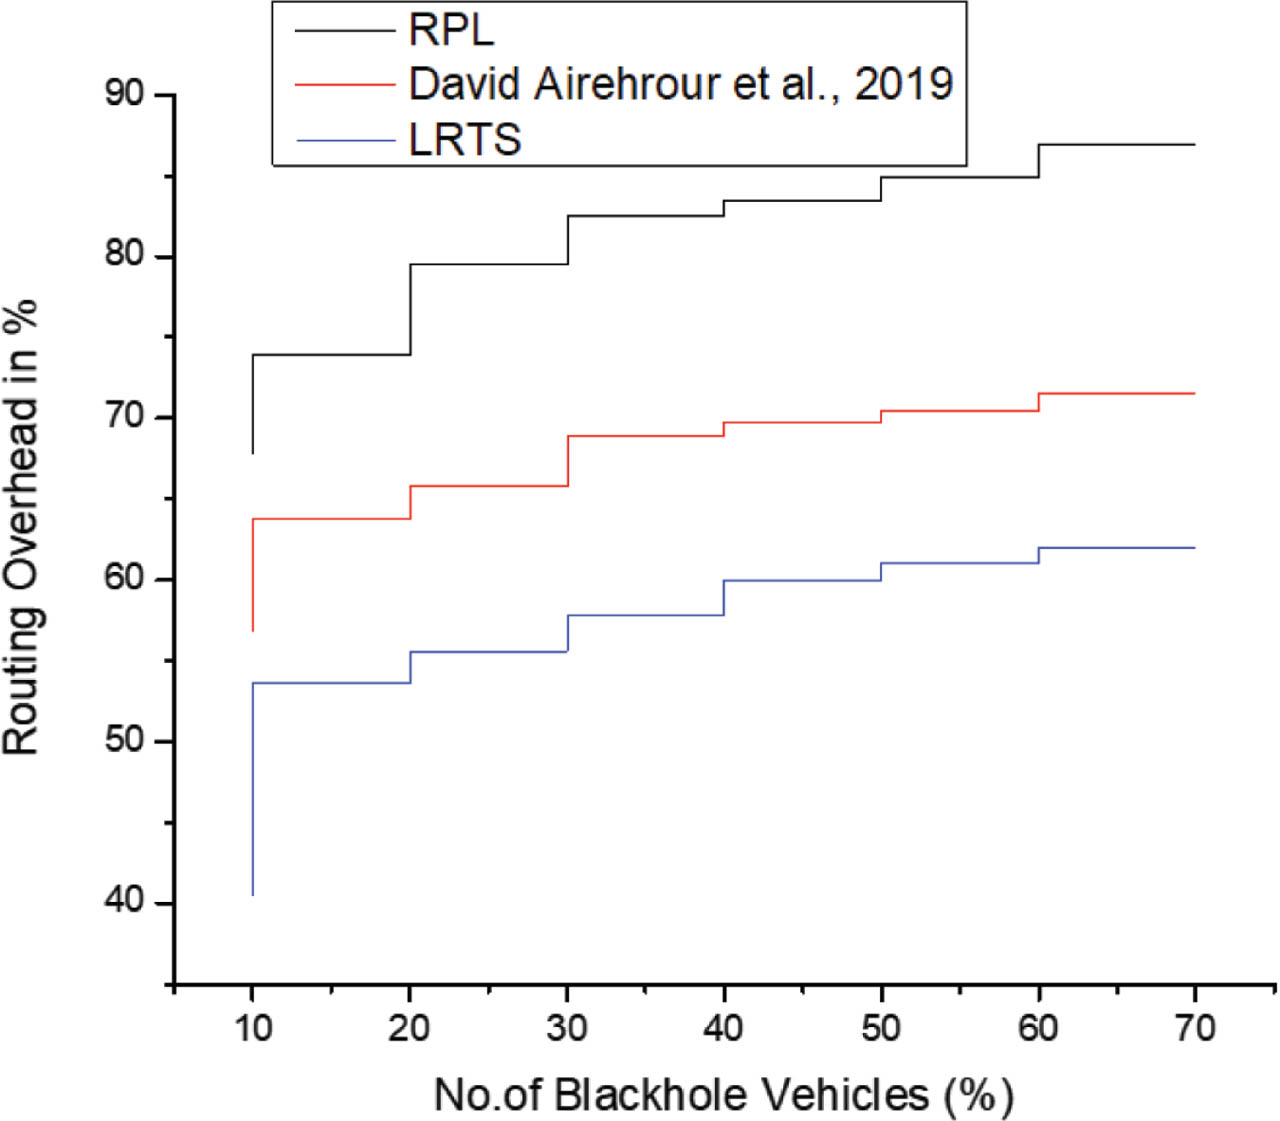
Figure 5:
Routing overhead versus % of blackhole nodes. LRTS, logistic regression-based trust-based security; RPL, routing protocol for low power lossy networks.
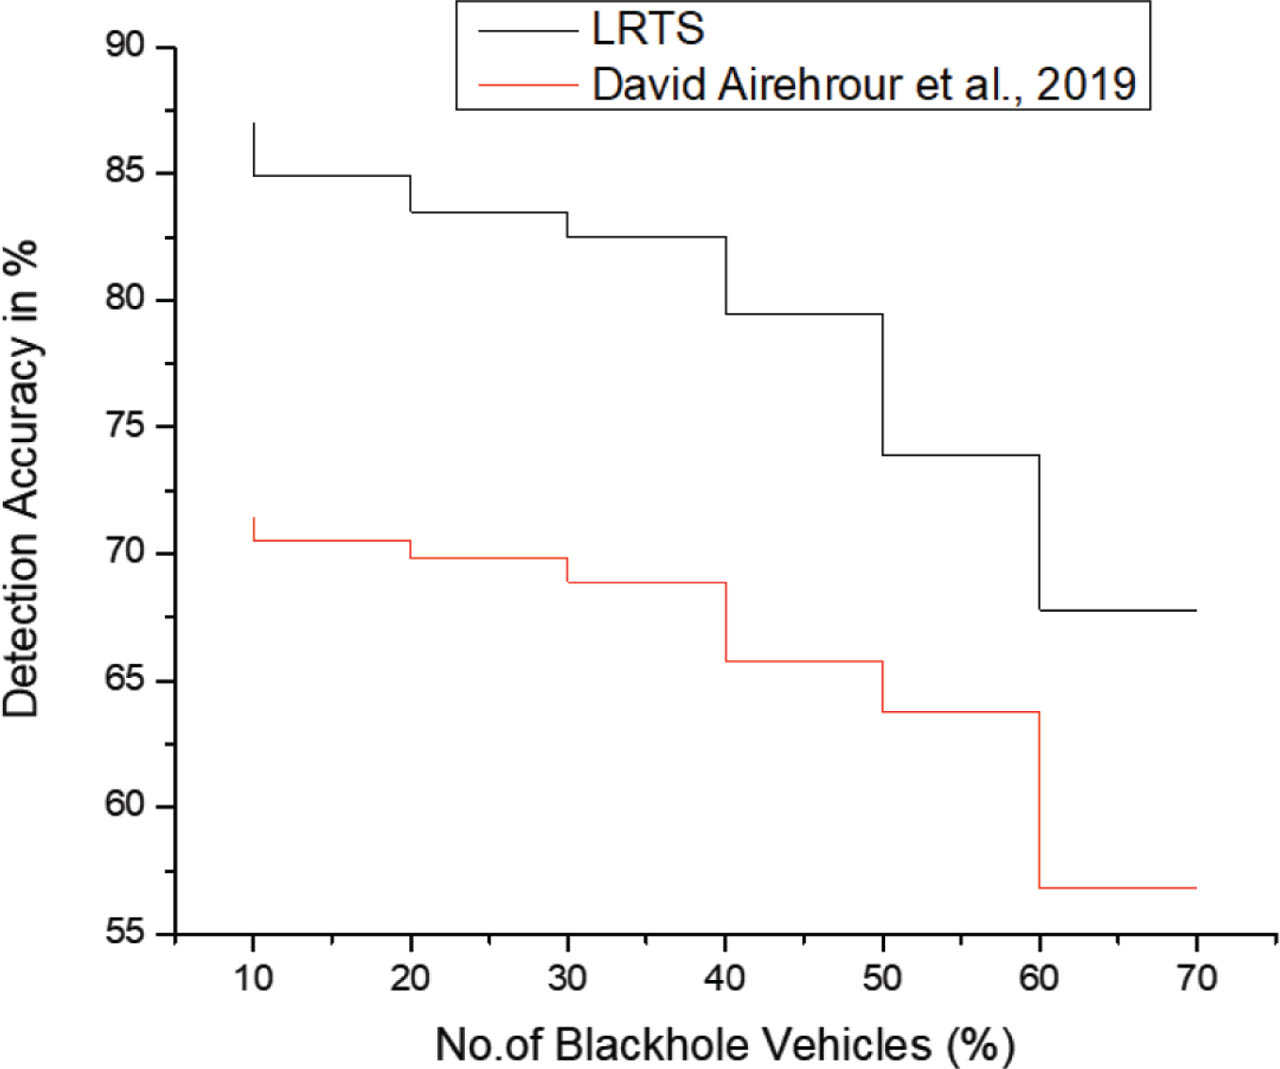
Figure 6:
Detection accuracy versus % of blackhole nodes. LRTS, logistic regression-based trust-based security.