
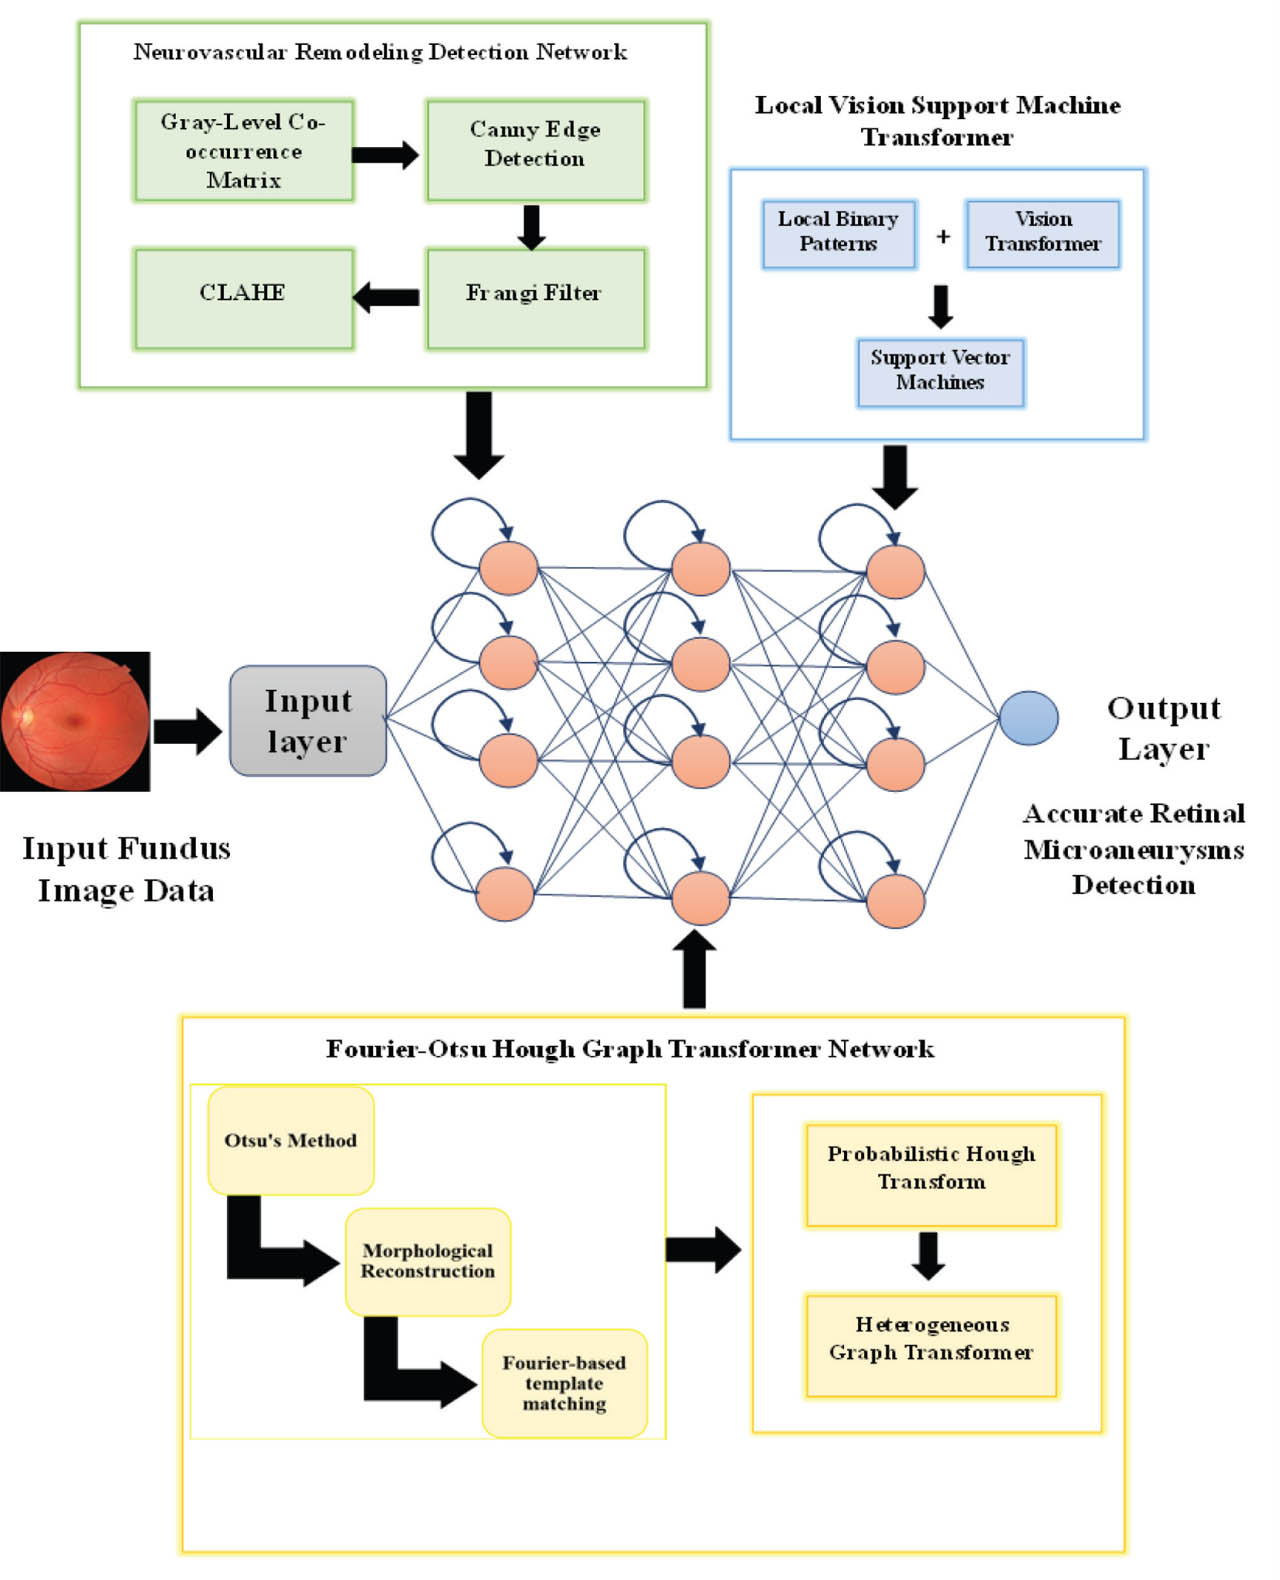
Figure 1:
Block diagram of proposed NFOVSTN-LSTM. NFOVSTN-LSTM, Neurovascular Fourier-Otsu Vision Support Transformer Network with Long Short-Term Memory.
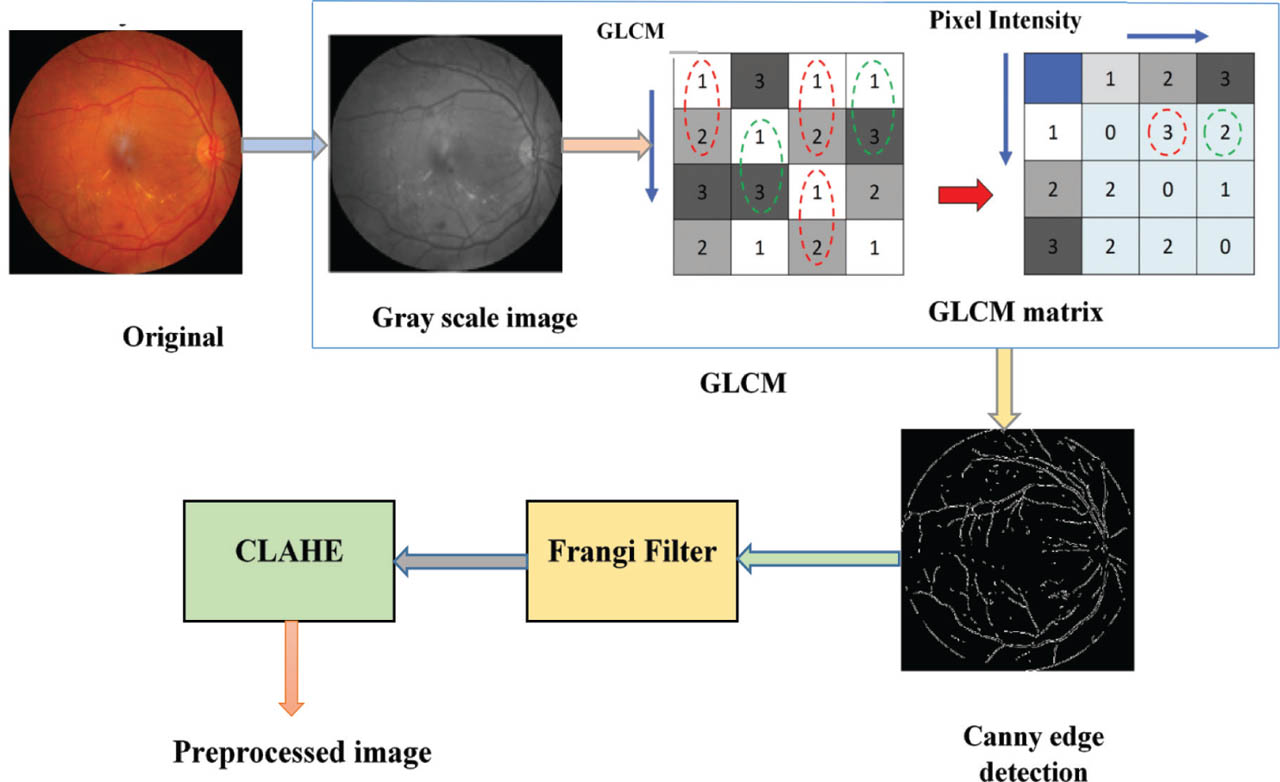
Figure 2:
Preprocessing of the retinal fundus image. CLAHE, contrast-limited adaptive histogram equalization; GLCM, Gray-Level Co-occurrence Matrix.
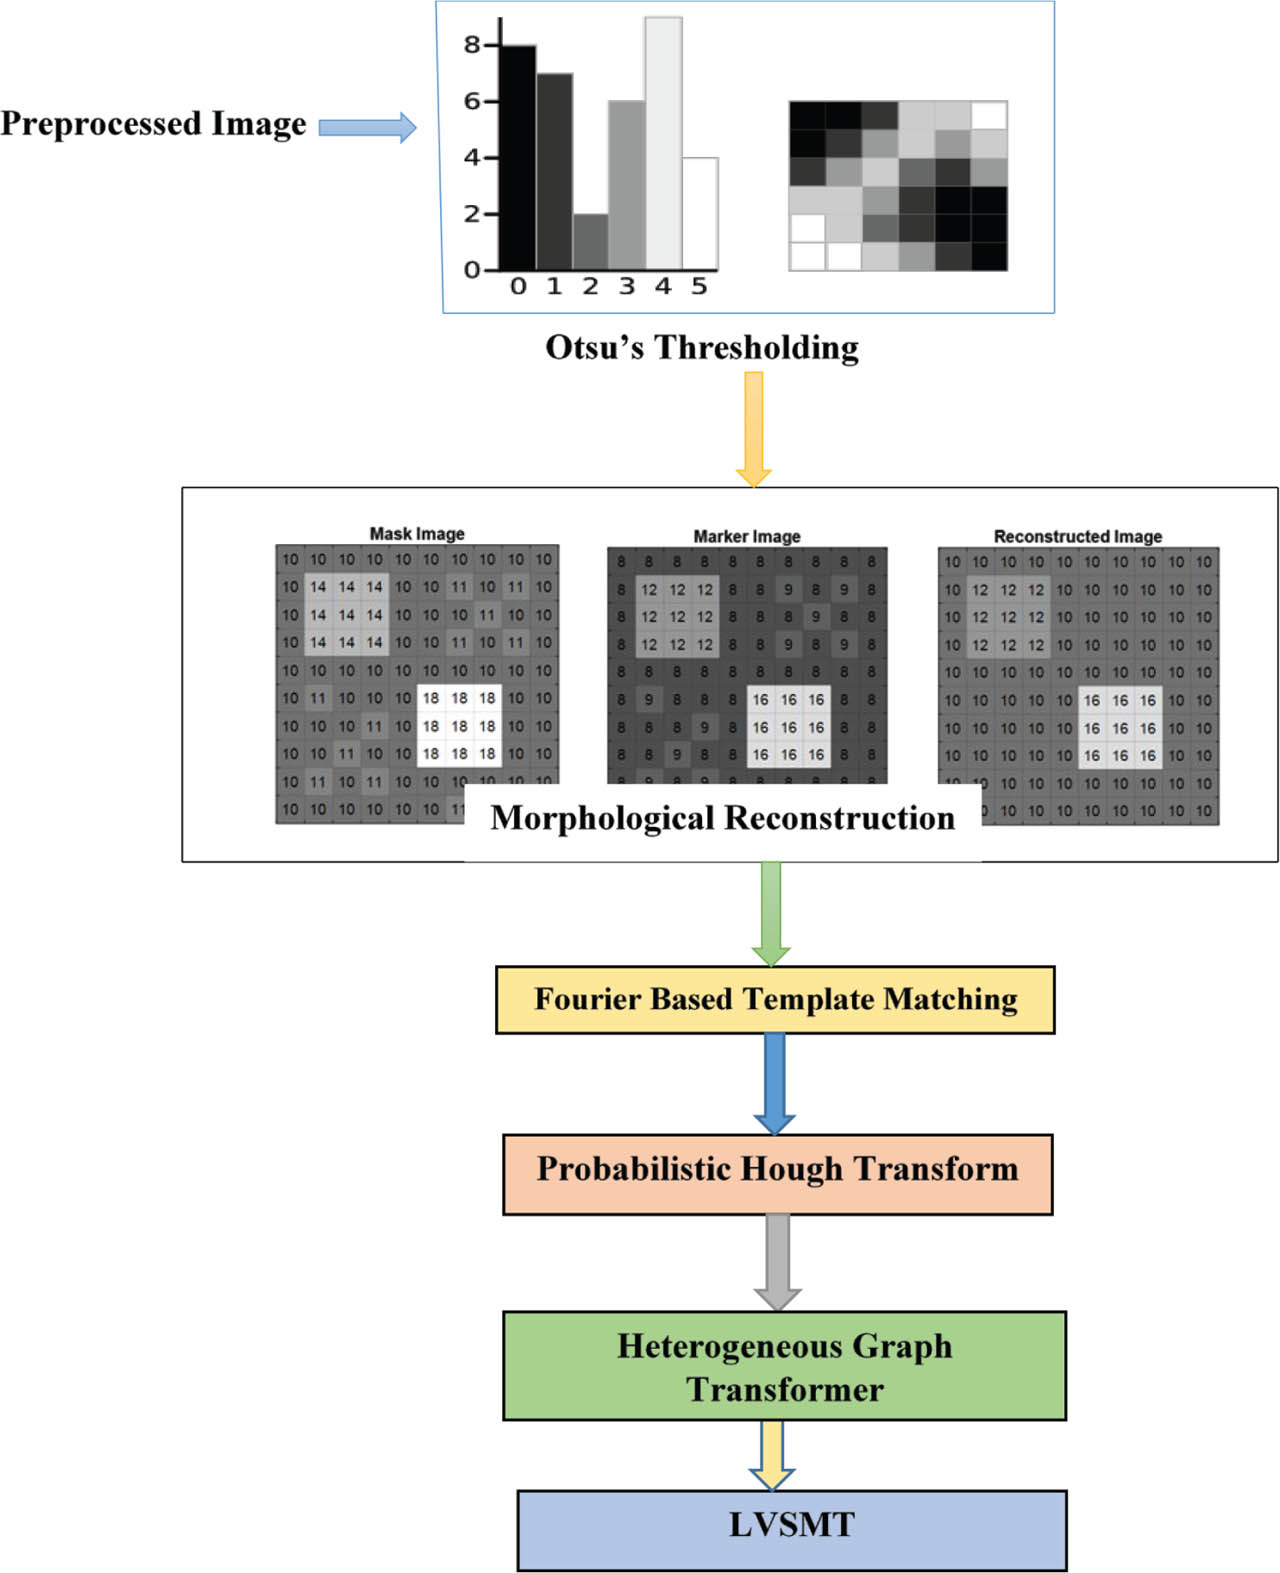
Figure 3:
FOHGTN feature extraction. FOHGTN, Fourier-Otsu Hough Graph Transformer Network; LVSMT, Local Vision Support Machine Transformer.
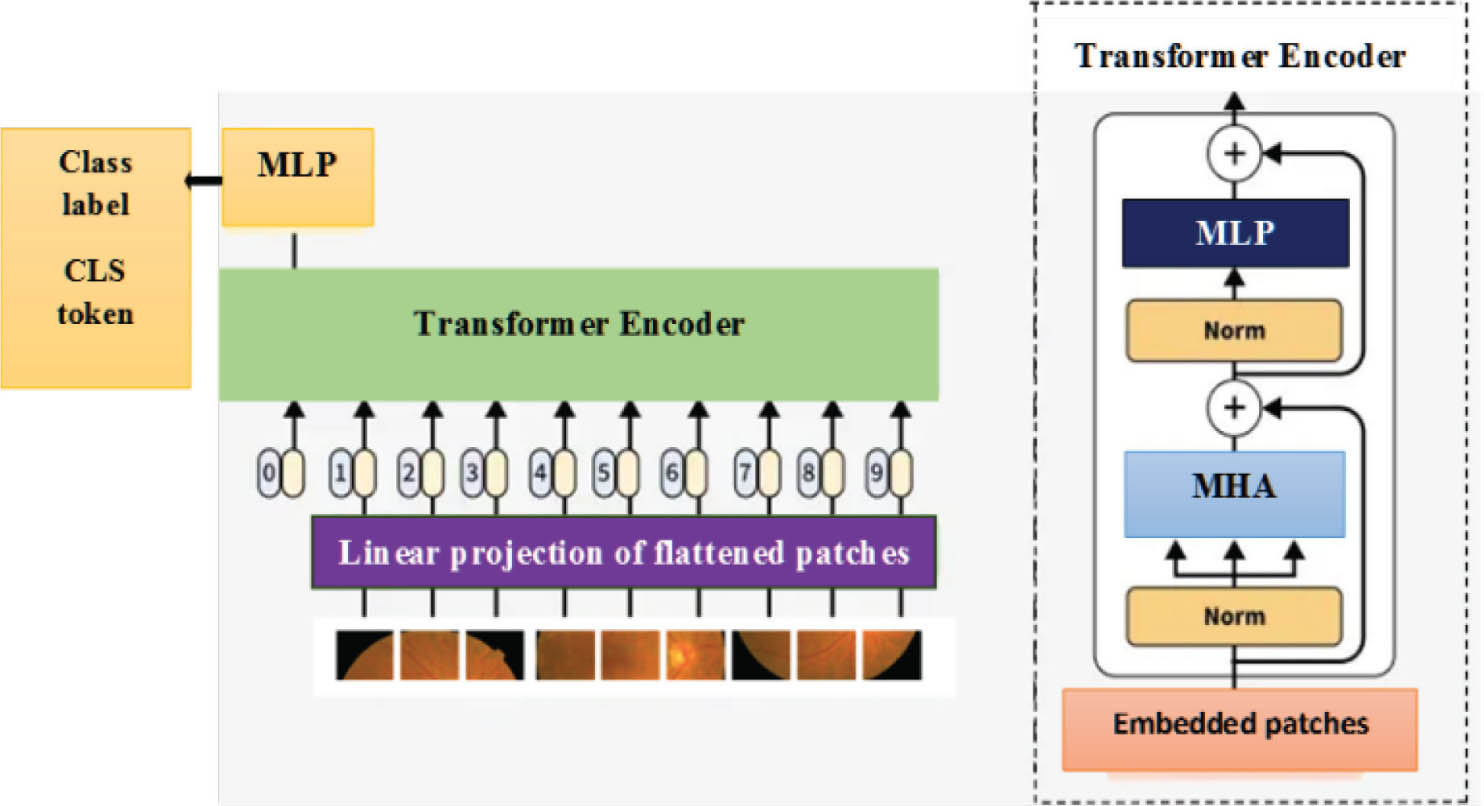
Figure 4:
ViT in MA detection. MA, microaneurysm; ViT, vision transformer.
| Algorithm 1: Training Procedure of NFOVSTN-LSTM |
|---|
| Input: Retinal fundus image dataset D |
| Output: Trained NFOVSTN-LSTM model |
| 1. Initialize the parameters of the NRDN, FOHGTN, LVSMT, and LSTM modules. |
| 2. For each retinal fundus image, I ∈ D, performing the following steps: |
| 3. Apply the NRDN to enhance vascular structures and generate vascular feature representation VI |
| 4. Pass VI to the FOHGTN to extract potential microaneurysm candidates. |
| 5. Construct spatial-anatomical relationships using the HGT to obtain refined lesion candidate features. |
| 6. Feed the refined features to the LVSMT to learn contextual and texture representations. |
| 7. Fuse the contextual embeddings from ViT with texture descriptors derived from LBP. |
| 8. Normalize the fused feature representation using Z-score normalization |
| 9. Classify the features using an SVM classifier with RBF kernel to predict microaneurysm or ischemic regions. |
| 10. Compute the loss between predicted outputs and ground-truth labels |
| 11. Perform backpropagation to propagate gradients through LVSTM, FOHGTN, and NRDN modules. |
| 12. Initialize the parameters of the NRDN, FOHGTN, LVSMT, and LSTM modules. |
| 13. For each retinal fundus image, I ∈ D, performing the following steps: |
| 14. Apply the NRDN to enhance vascular structures and generate vascular feature representation VI |
| 15. Pass VI to the FOHGTN to extract potential microaneurysm candidates. |
| 16. Construct spatial-anatomical relationships using the HGT to obtain refined lesion candidate features. |
| 17. Feed the refined features to the LVSMT to learn contextual and texture representations. |
| 18. Fuse the contextual embeddings from ViT with texture descriptors derived from LBP. |
| 19. Normalize the fused feature representation using Z-score normalization |
| 20. Classify the features using an SVM classifier with RBF kernel to predict microaneurysm or ischemic regions. |
| 21. Compute the loss between predicted outputs and ground-truth labels |
| 22. Perform backpropagation to propagate gradients through LVSTM, FOHGTN, and NRDN modules. |
| 23. Update model parameters using gradient-based optimization |
| 24. Repeat the process for all training samples until convergence criteria are satisfied. |
| Operating system | : Windows 11 (Version 22H2, 64-bit) |
|---|---|
| Processor | : Intel® Core™ i7-10750H @ 2.60 GHz |
| RAM | : 16 GB DDR4 |
| GPU | : NVIDIA GeForce RTX 3060 |
| CUDA version | : 11.6 |
| CuDNN version | : 8.4 |
| Deep learning framework | : PyTorch 2.0 |
| Backbone architecture | : Vision transformer (ViT-Base-Patch16-224) |
| Feature extraction | : LBP combined with ViT deep embeddings |
| Sequence modeling | : LSTM with 3 stacked layers and 256 hidden units per layer |
| Optimize | : Adam |
| Initial learning rate | : 0.001 |
| Batch size | : Full-batch gradient descent |
| Number of epochs | : 150 |
| Loss function | : BCE loss |
| Final classifier | : SVM (RBF kernel) |
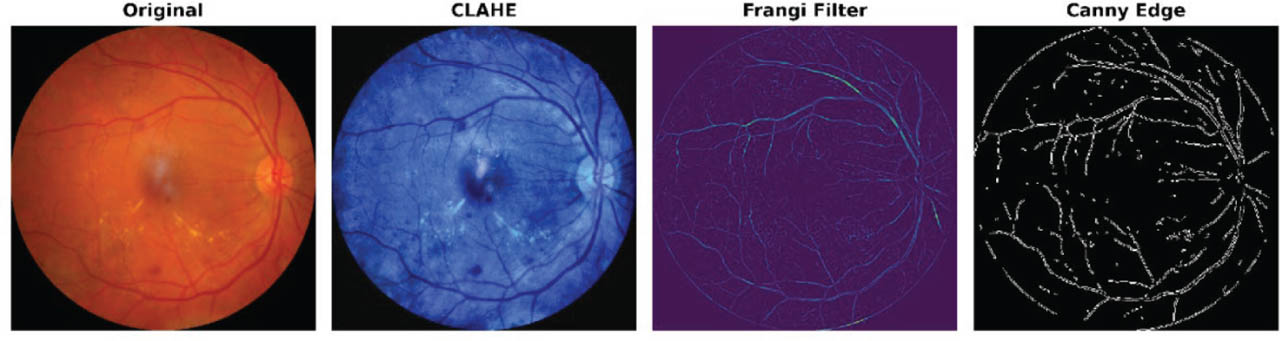
Figure 5:
Retinal image preprocessing and vascular enhancement pipeline. CLAHE, contrast-limited adaptive histogram equalization.
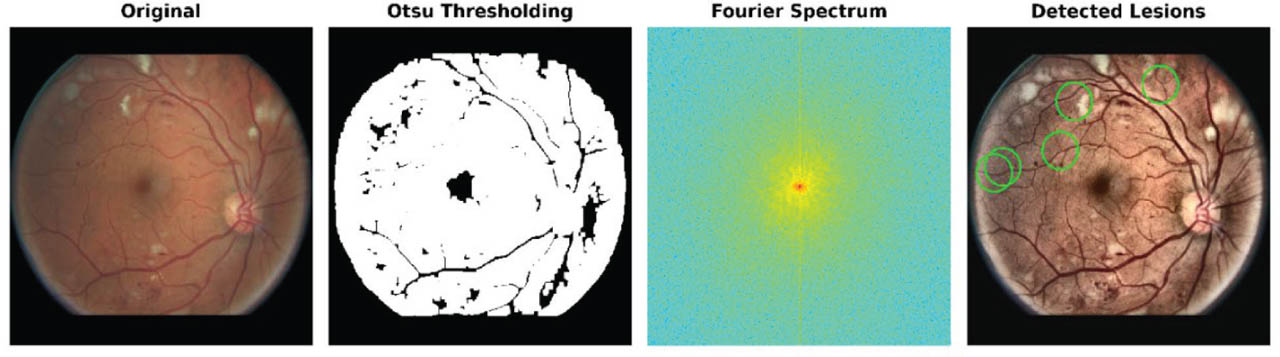
Figure 6:
Feature extraction for retinal MA detection. MA, microaneurysm.
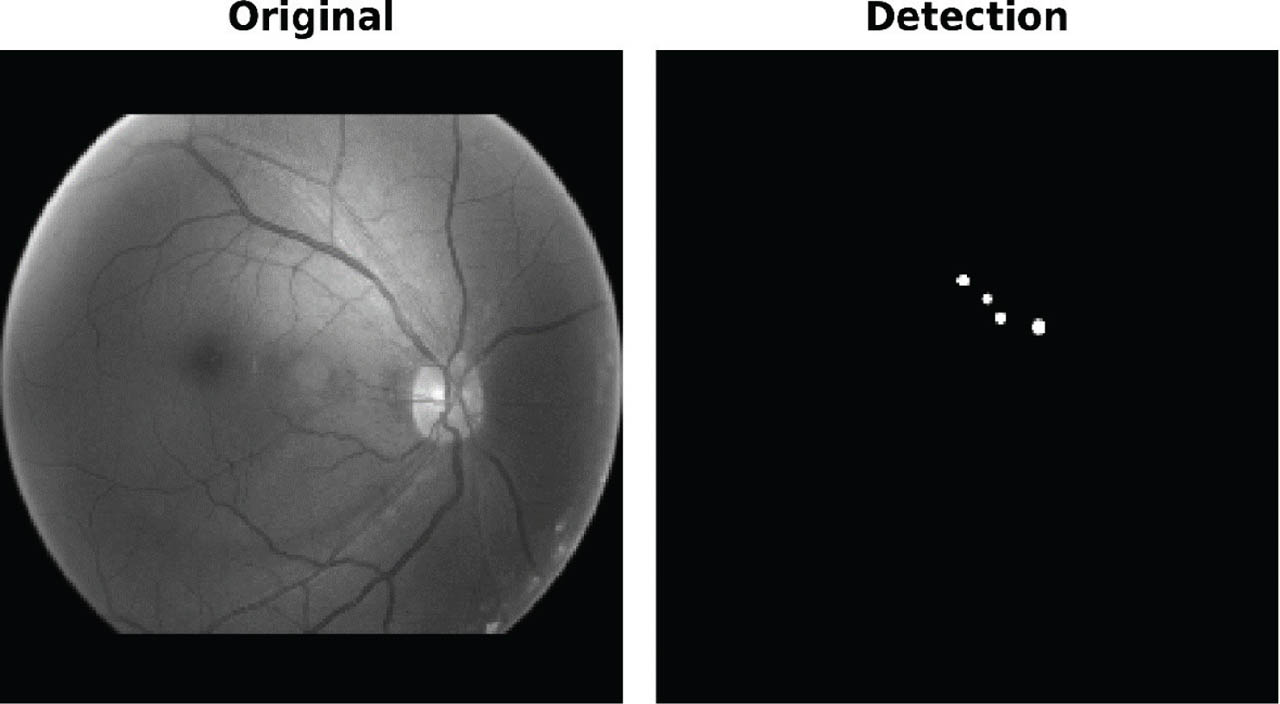
Figure 7:
The original image and the MA-detected image. MA, microaneurysm.
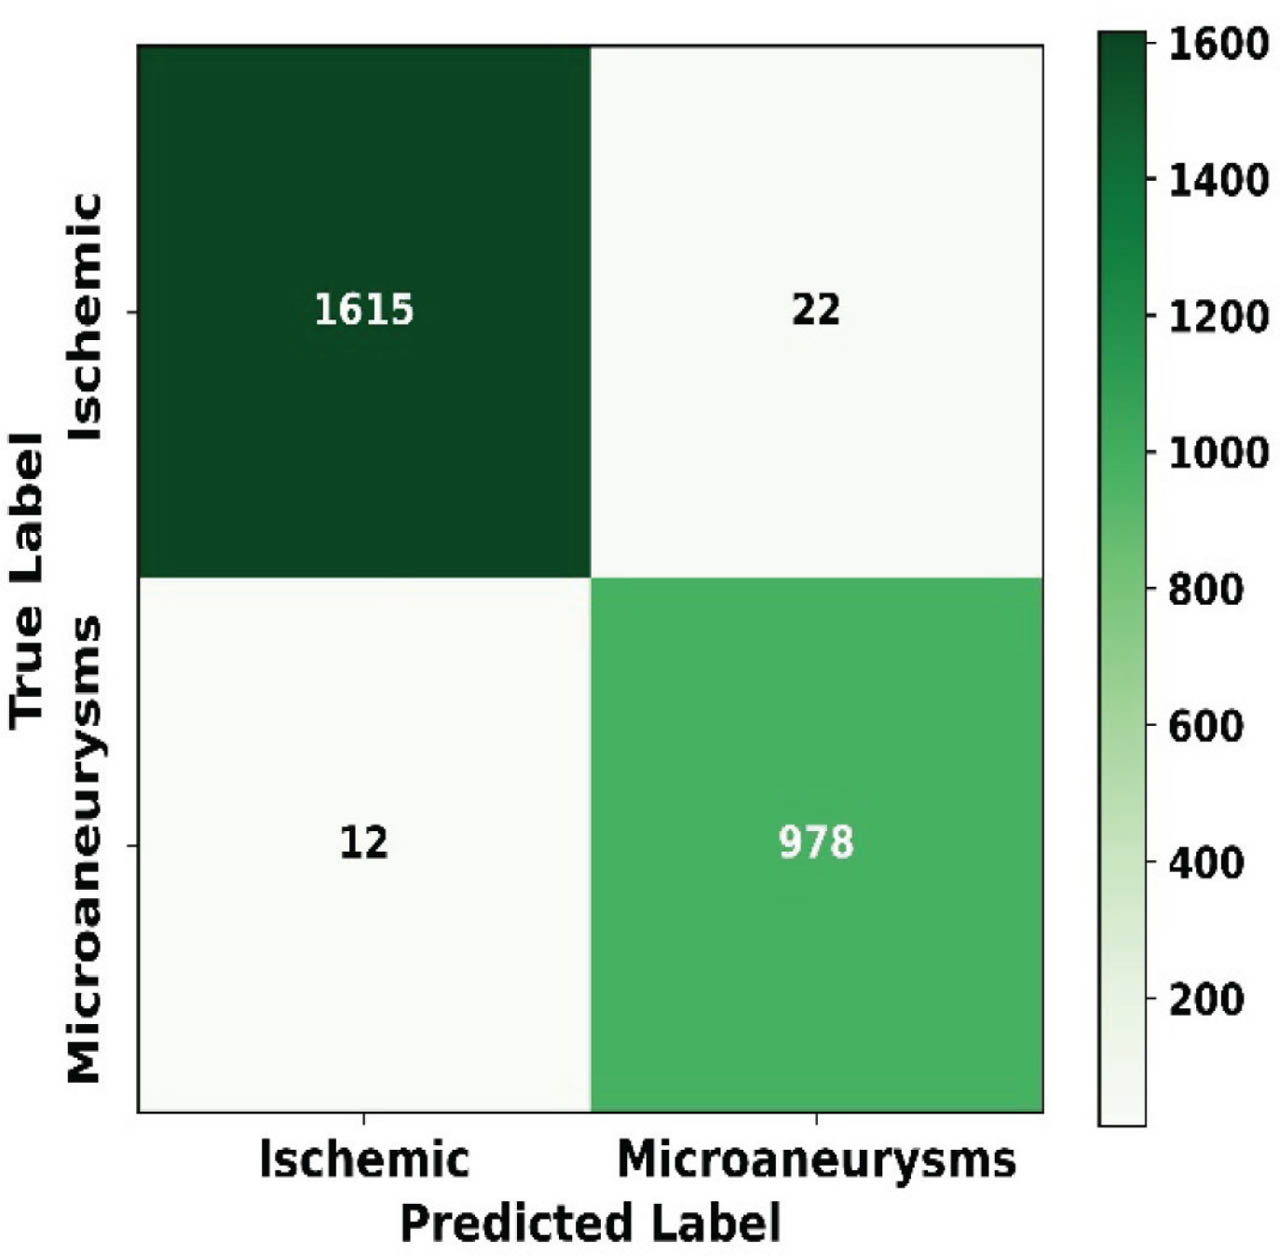
Figure 8:
Confusion matrix of the proposed model.
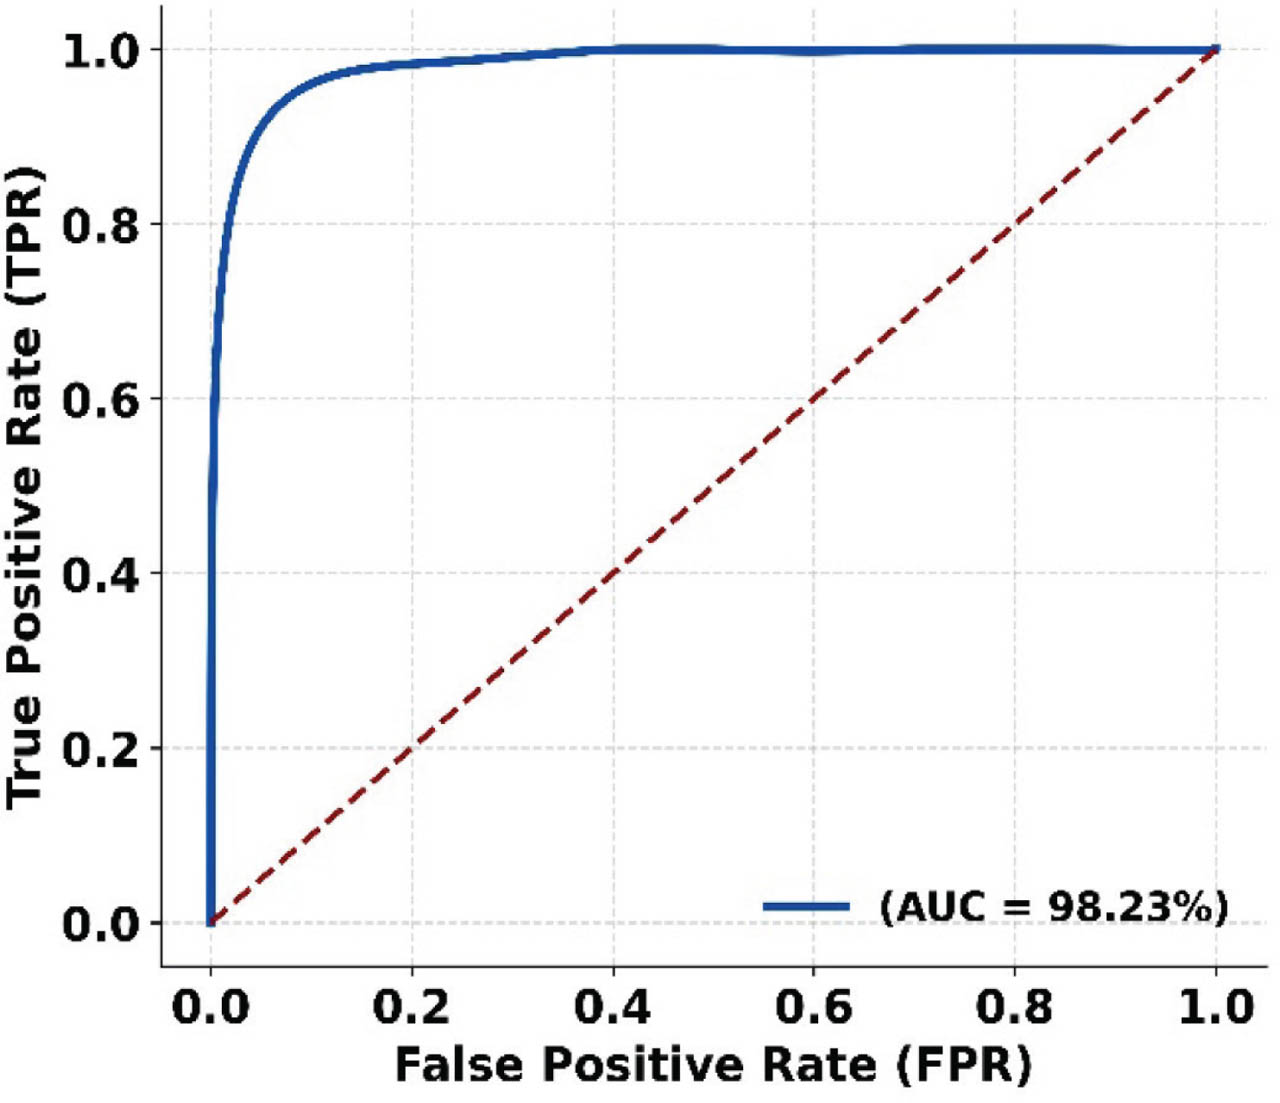
Figure 9:
ROC curve of the proposed model. AUC, area under the curve; FPR, false positive rate; ROC, receiver operating characteristic; TPR, true positive rate.
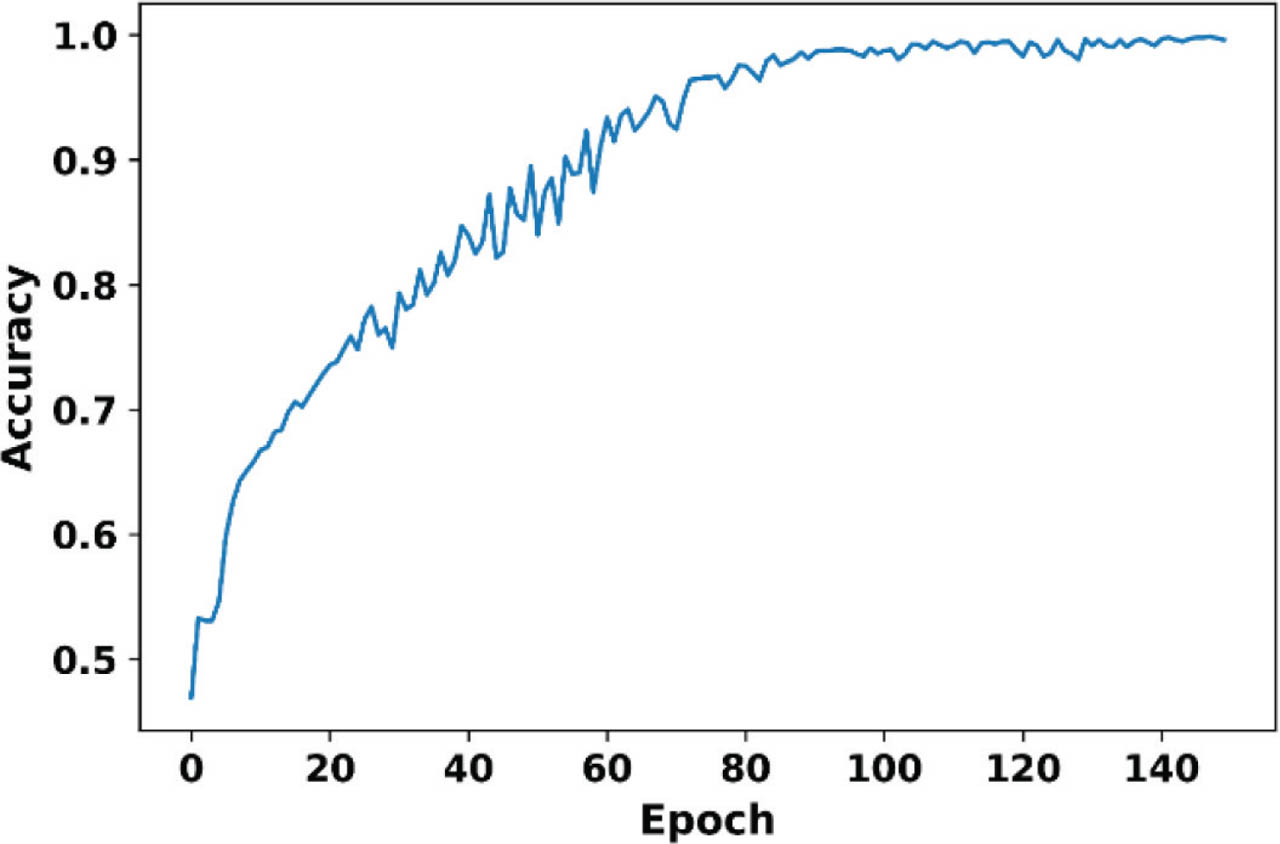
Figure 10:
Accuracy of the proposed framework.
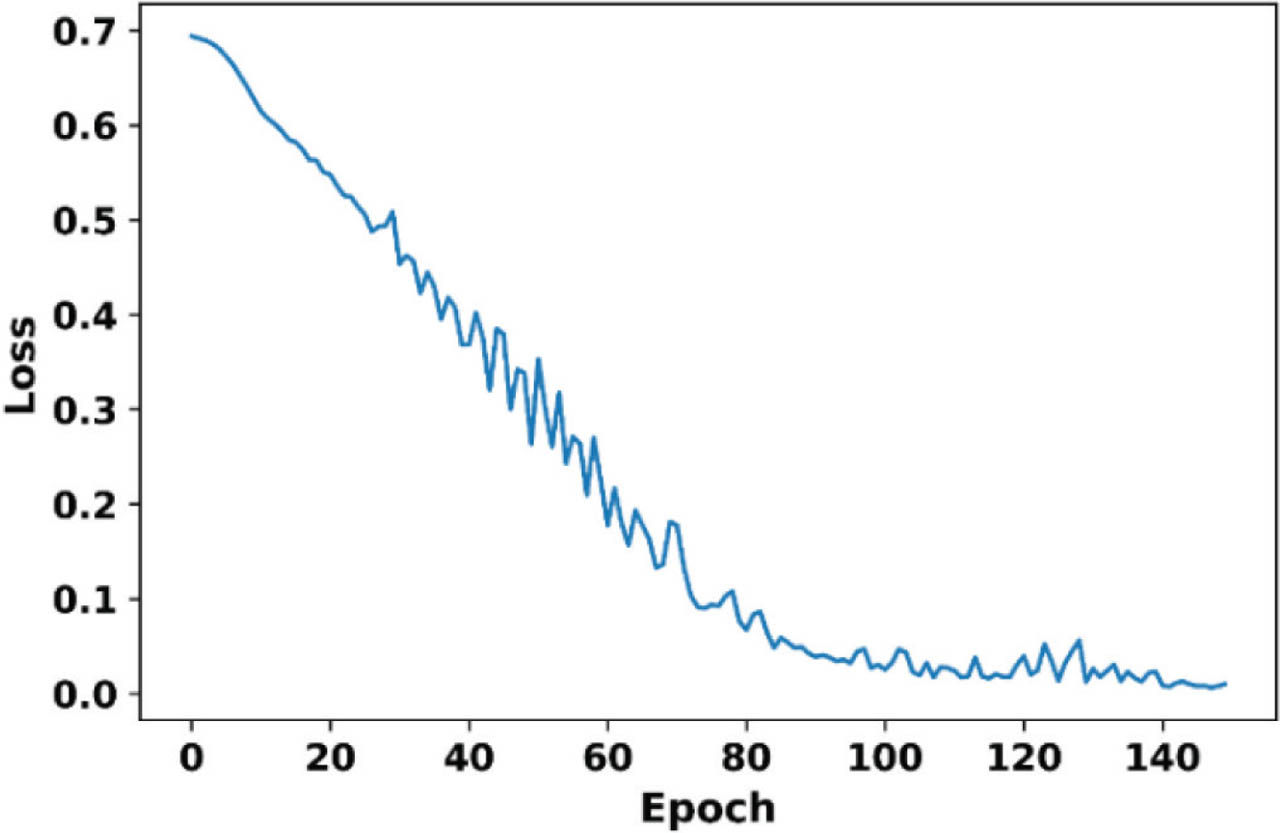
Figure 11:
Loss analysis of the proposed framework.
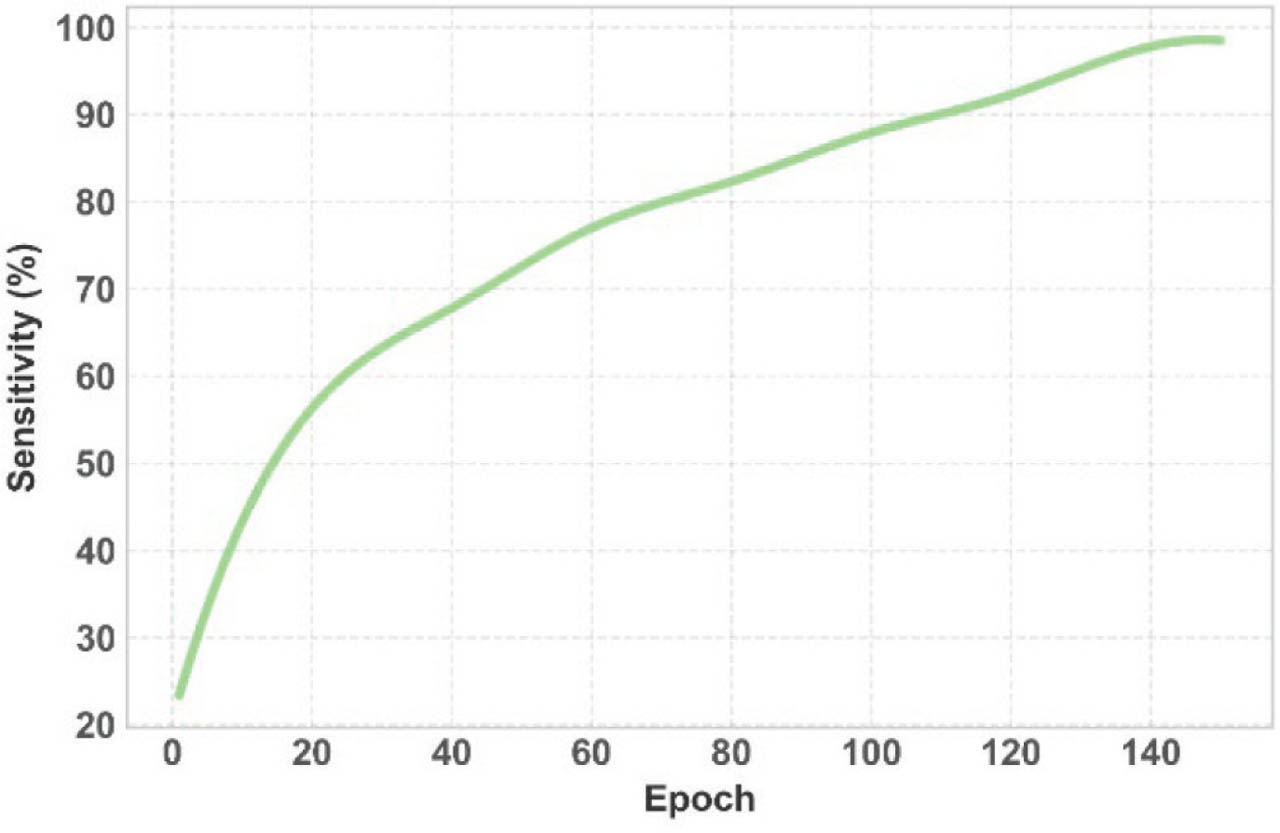
Figure 12:
Sensitivity of the proposed framework.
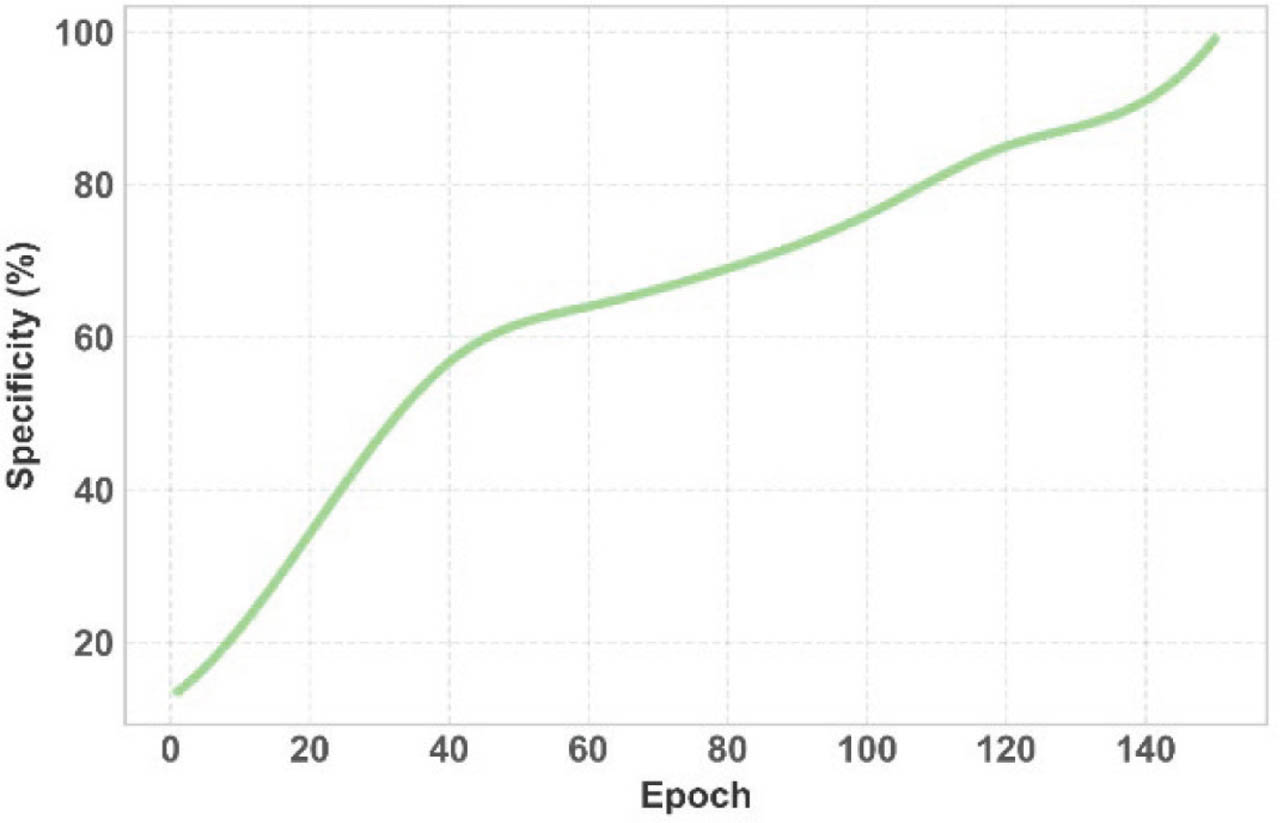
Figure 13:
Specificity of the proposed framework.
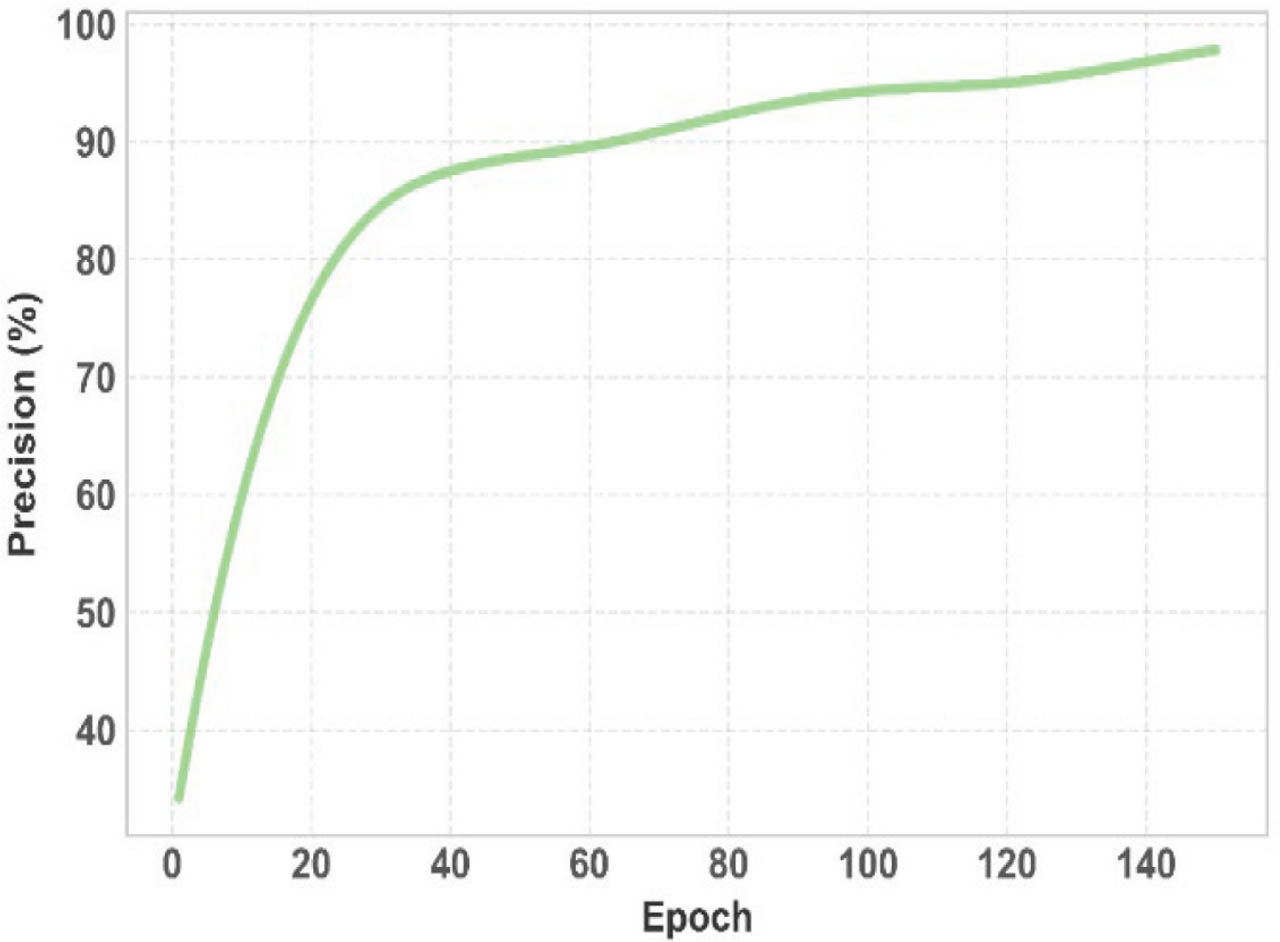
Figure 14:
Precision of the proposed framework.
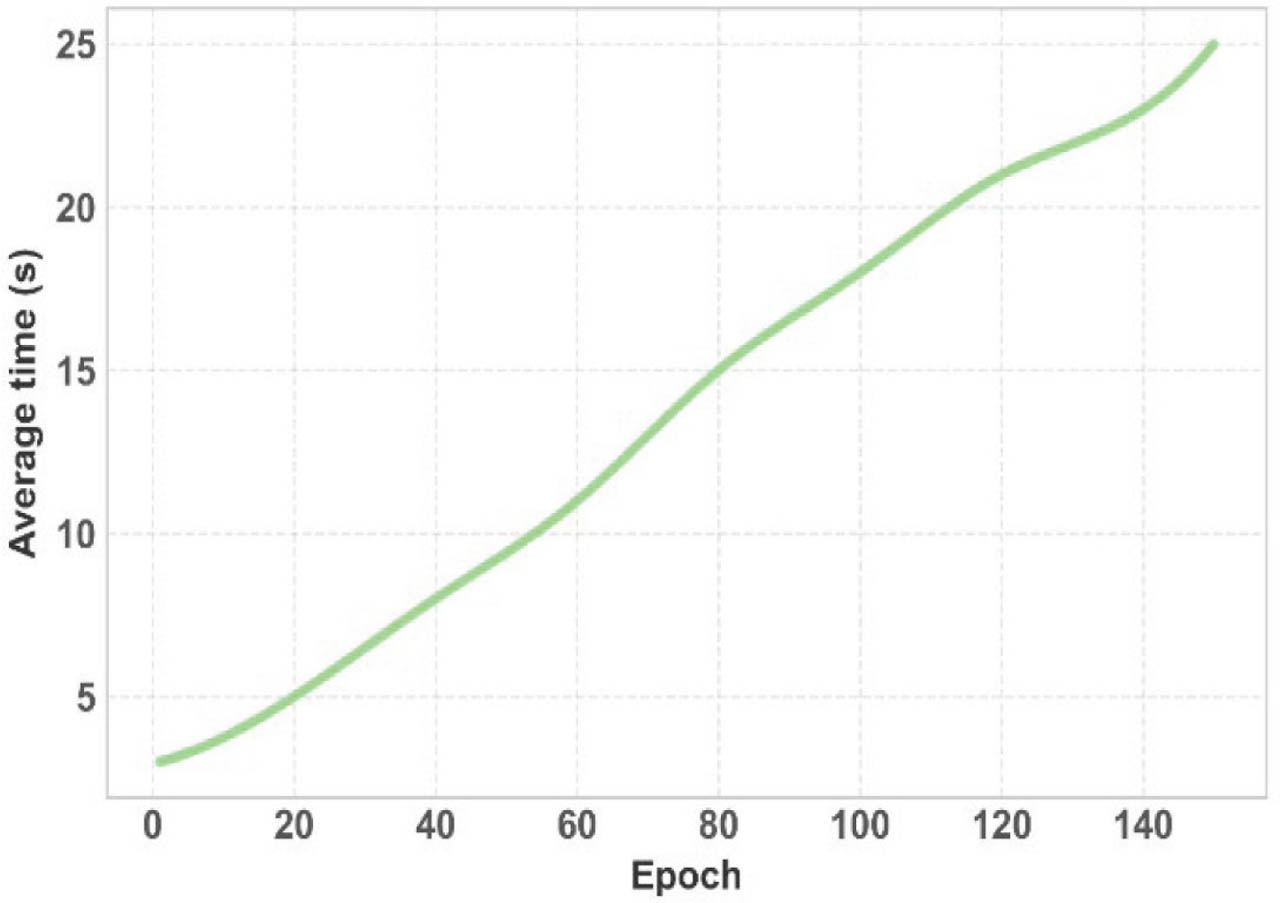
Figure 15:
Average time of the proposed NFOVSTN-LSTM. NFOVSTN-LSTM, Neurovascular Fourier-Otsu Vision Support Transformer Network with Long Short-Term Memory.
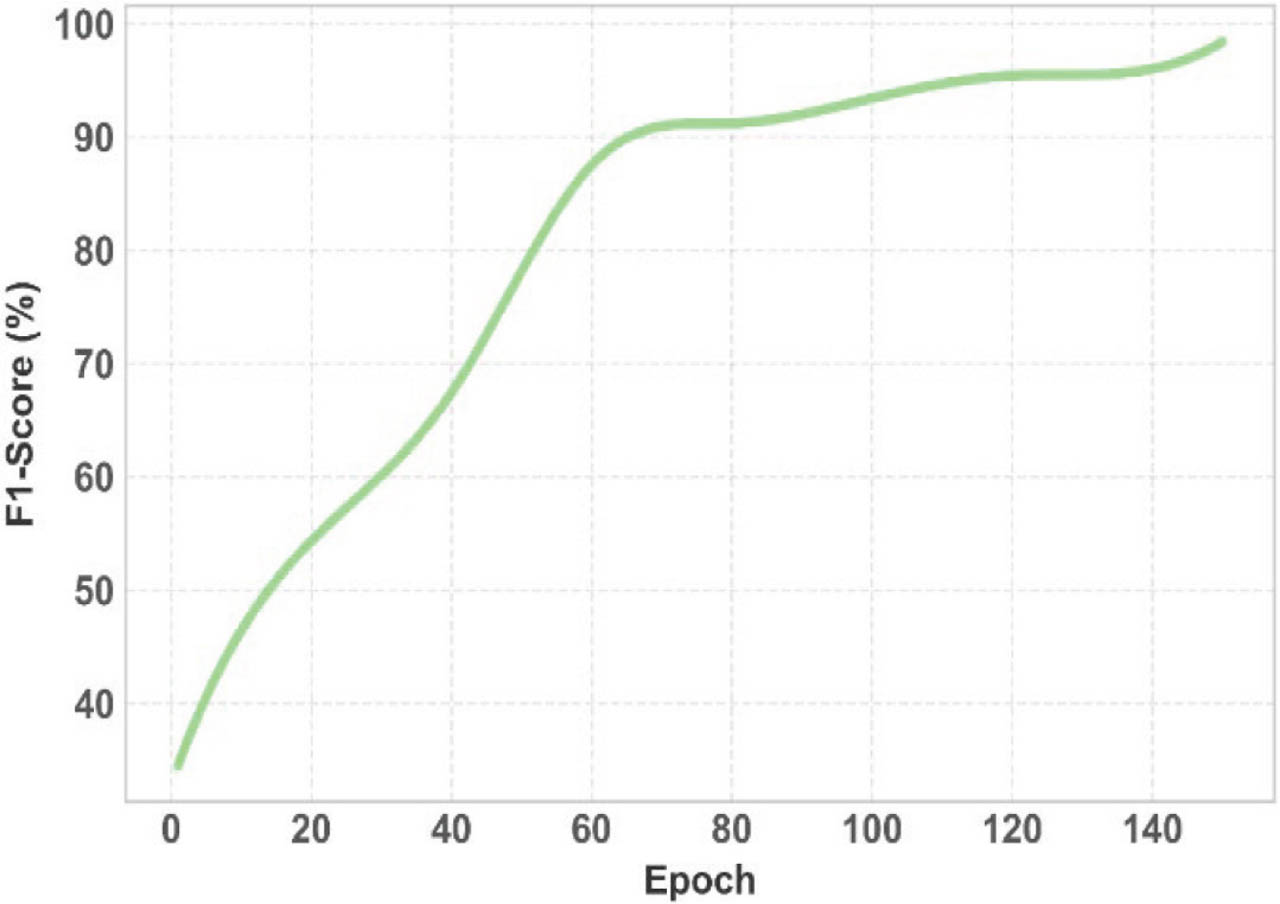
Figure 16:
F1-score of the proposed NFOVSTN-LSTM framework. NFOVSTN-LSTM, Neurovascular Fourier-Otsu Vision Support Transformer Network with Long Short-Term Memory.
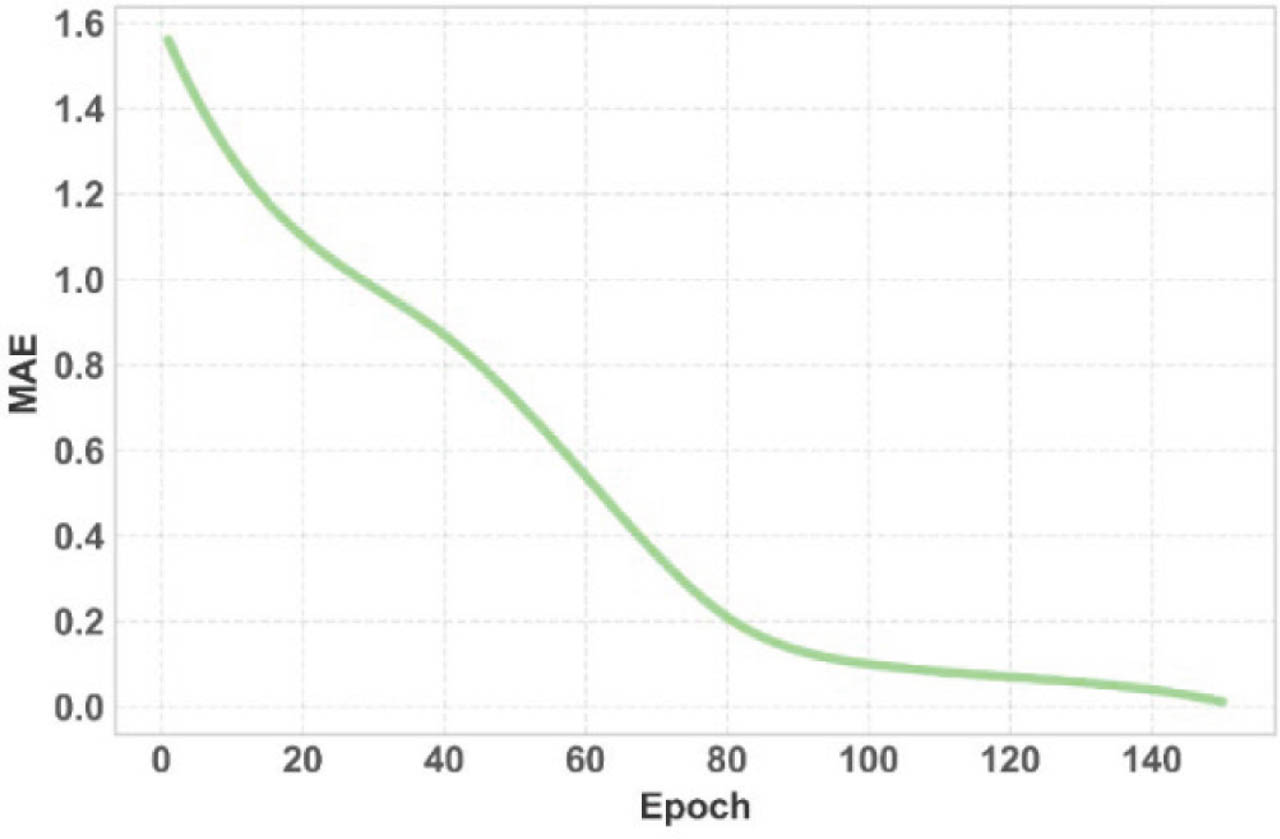
Figure 17:
MAE of the proposed NFOVSTN-LSTM framework. MAE, mean absolute error; NFOVSTN-LSTM, Neurovascular Fourier-Otsu Vision Support Transformer Network with Long Short-Term Memory.
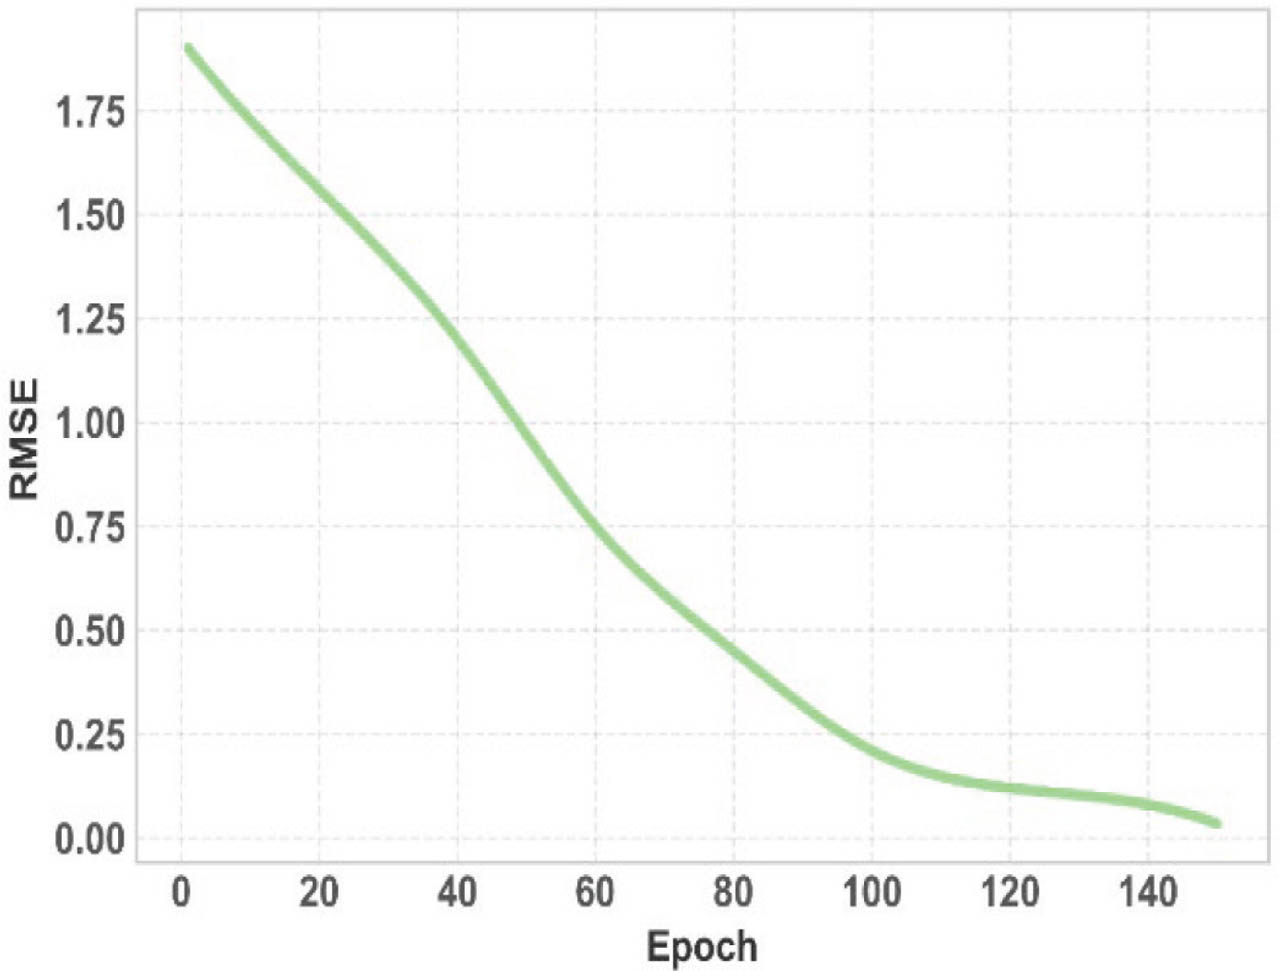
Figure 18:
RMSE of the proposed NFOVSTN-LSTM. NFOVSTN-LSTM, Neurovascular Fourier-Otsu Vision Support Transformer Network with Long Short-Term Memory.
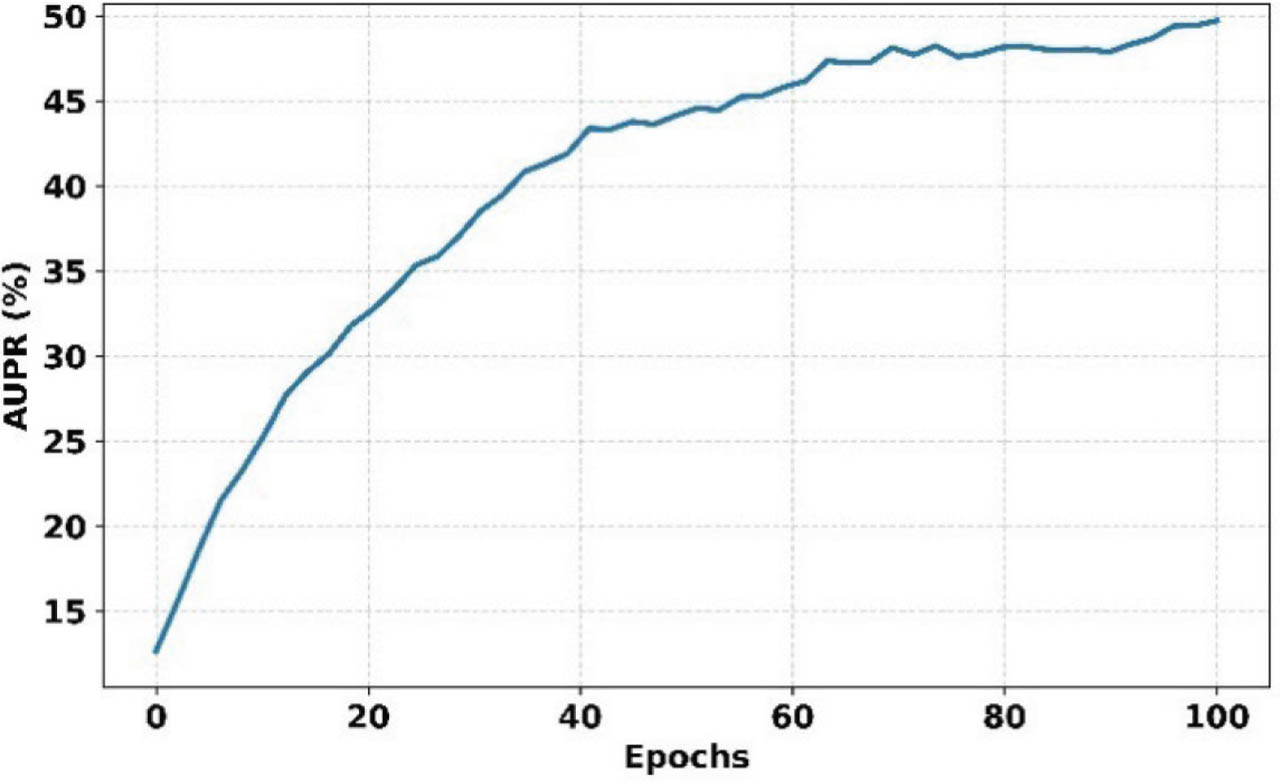
Figure 19:
AUPR of the proposed NFOVSTN-LSTM framework. AUPR, area under the precision-recall curve; NFOVSTN-LSTM, Neurovascular Fourier-Otsu Vision Support Transformer Network with Long Short-Term Memory.
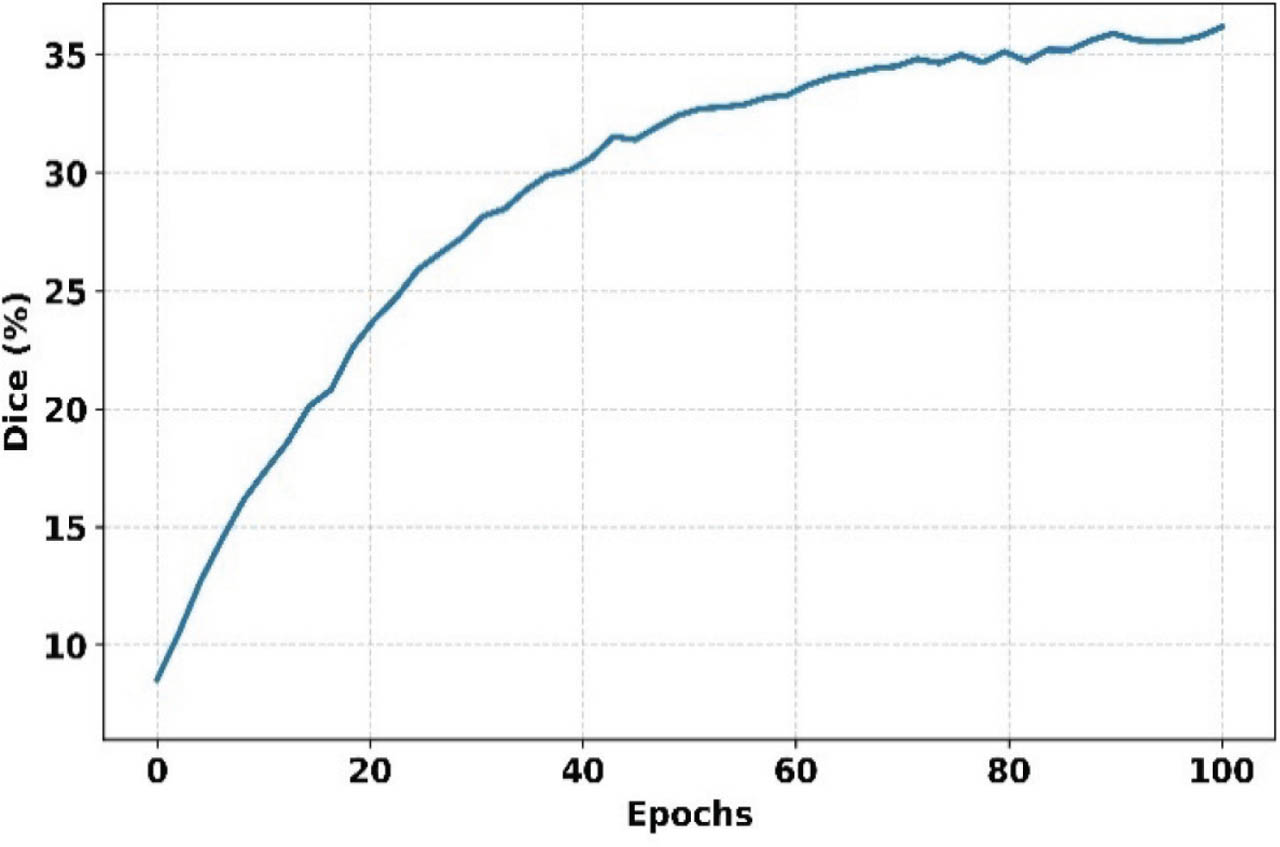
Figure 20:
Dice coefficient of the proposed NFOVSTN-LSTM Framework. NFOVSTN-LSTM, Neurovascular Fourier-Otsu Vision Support Transformer Network with Long Short-Term Memory.
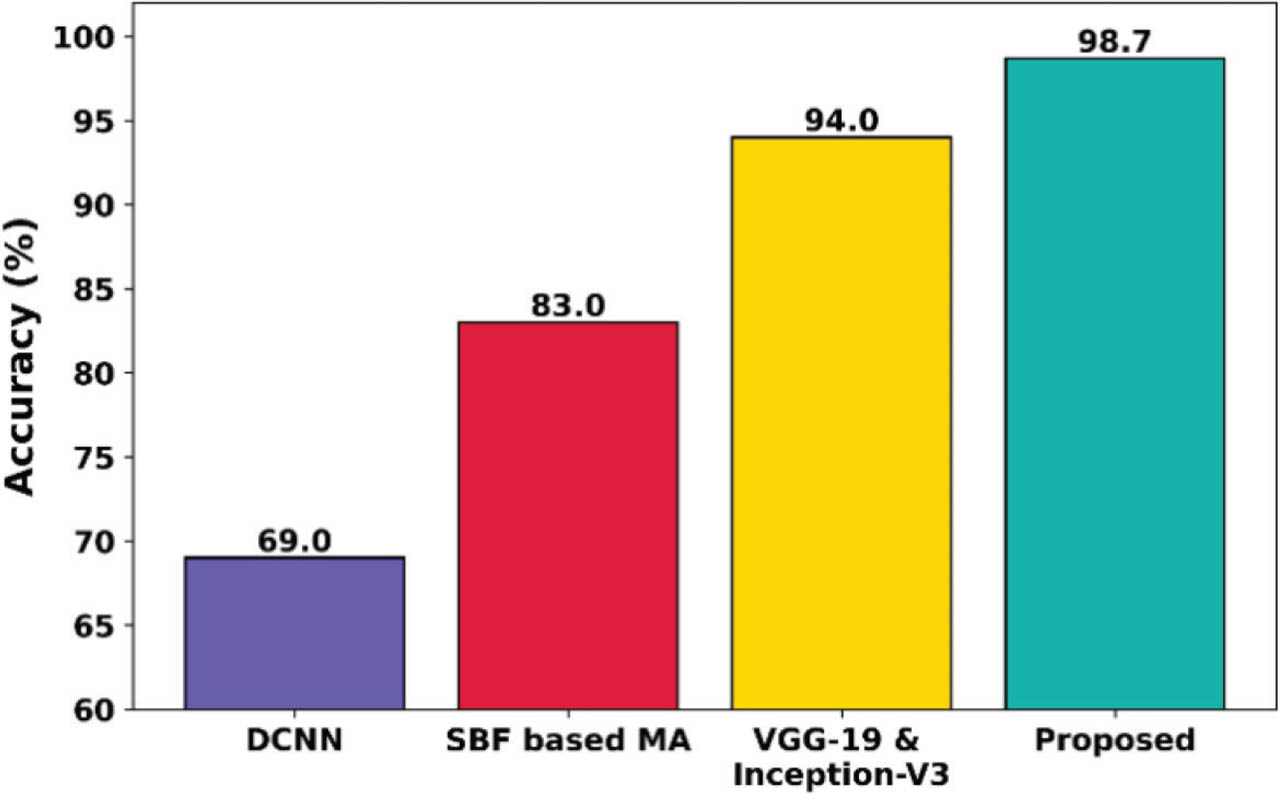
Figure 21:
Accuracy comparison with existing models. MA, microaneurysm.
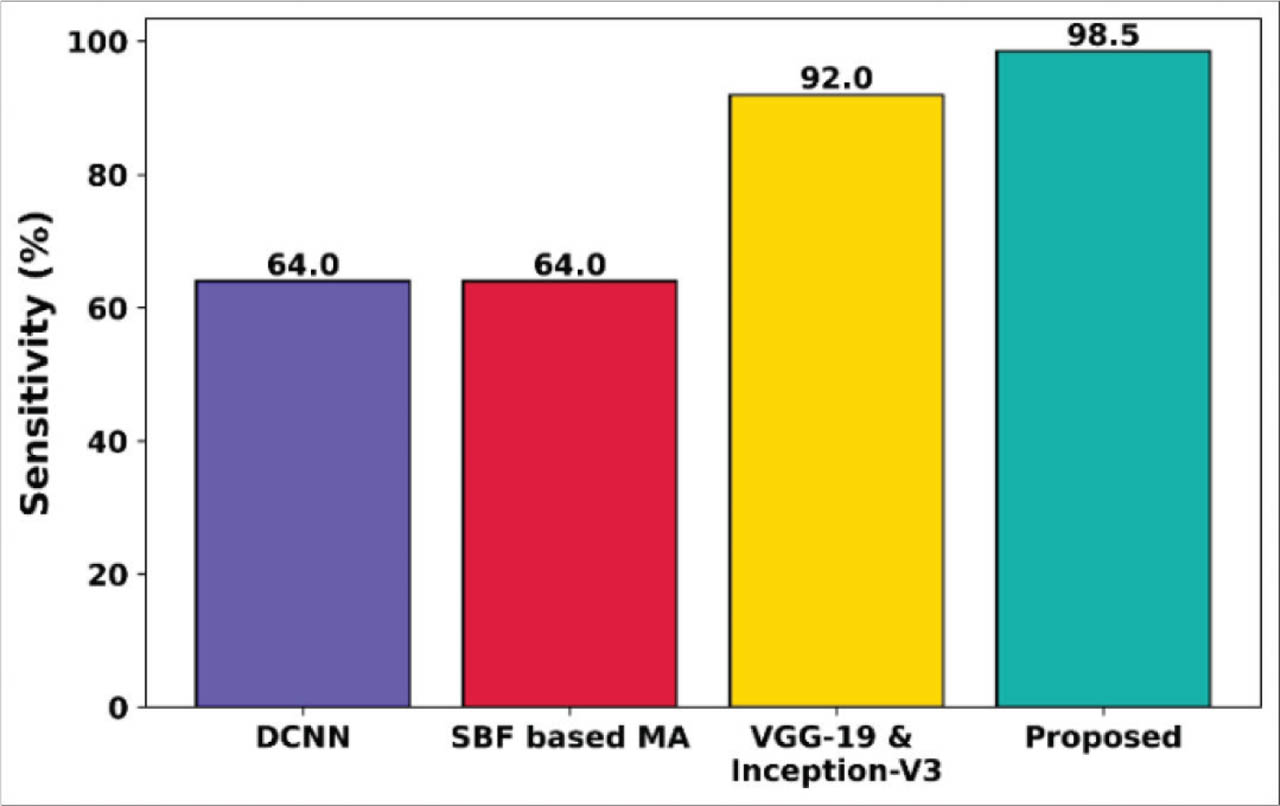
Figure 22:
Sensitivity comparison of the NFOVSTN-LSTM framework. MA, microaneurysm.
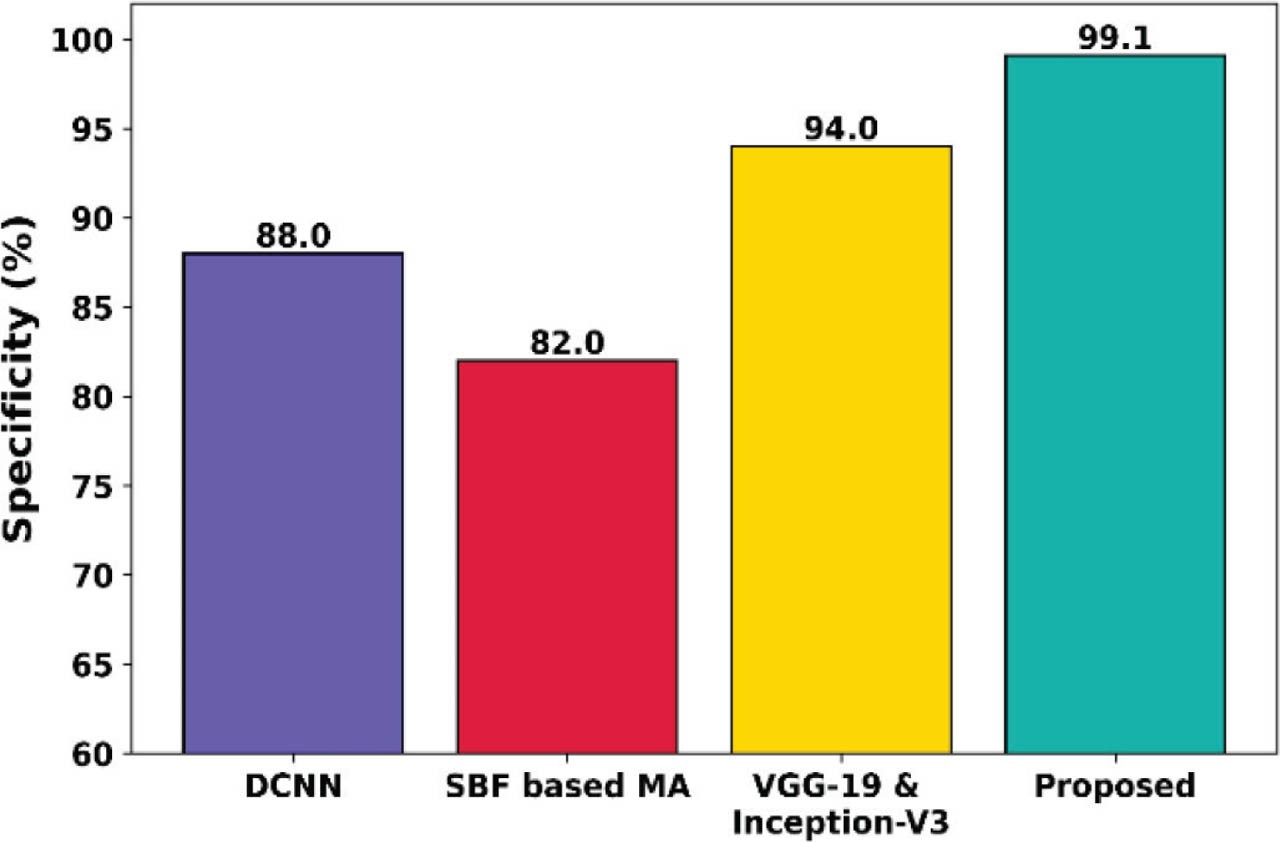
Figure 23:
Specificity comparison of the proposed framework. MA, microaneurysm.
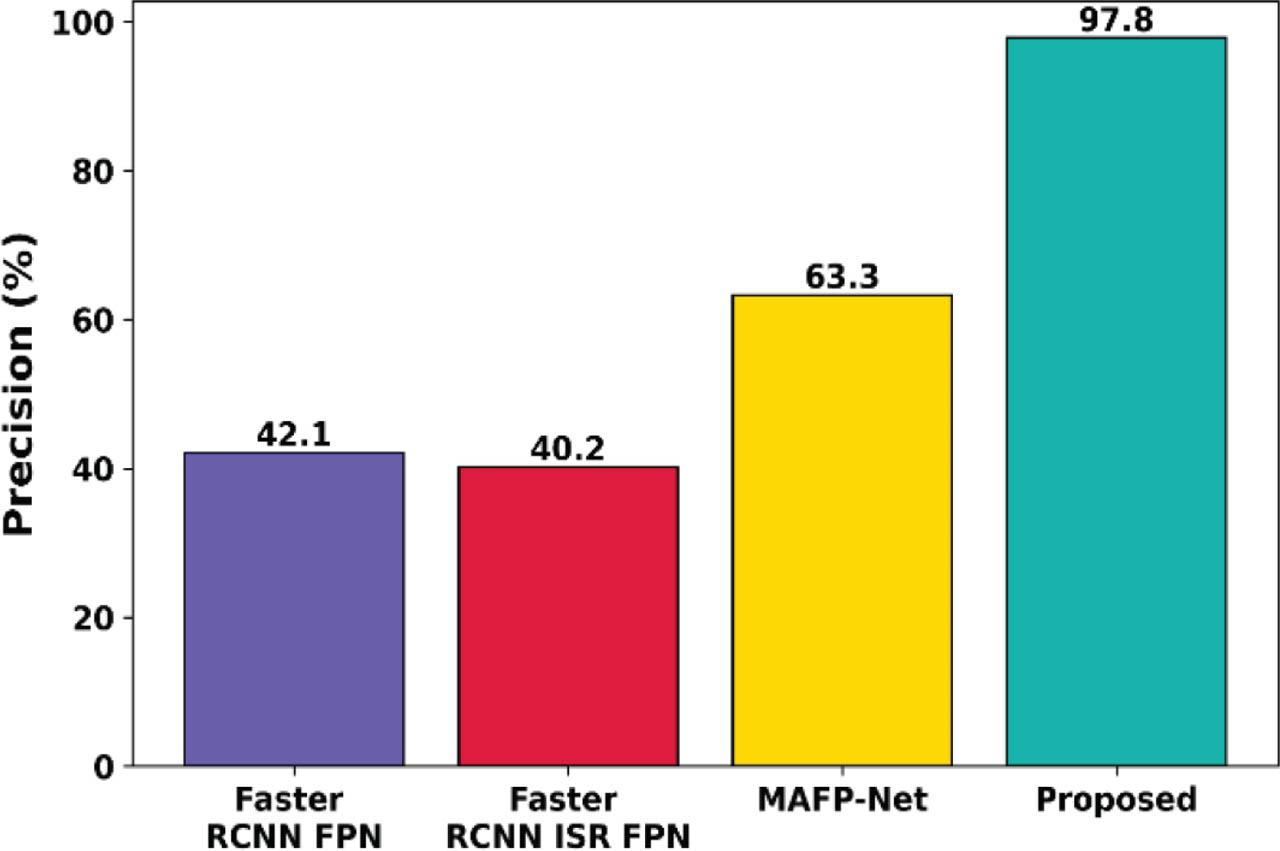
Figure 24:
Precision comparison of the proposed framework.
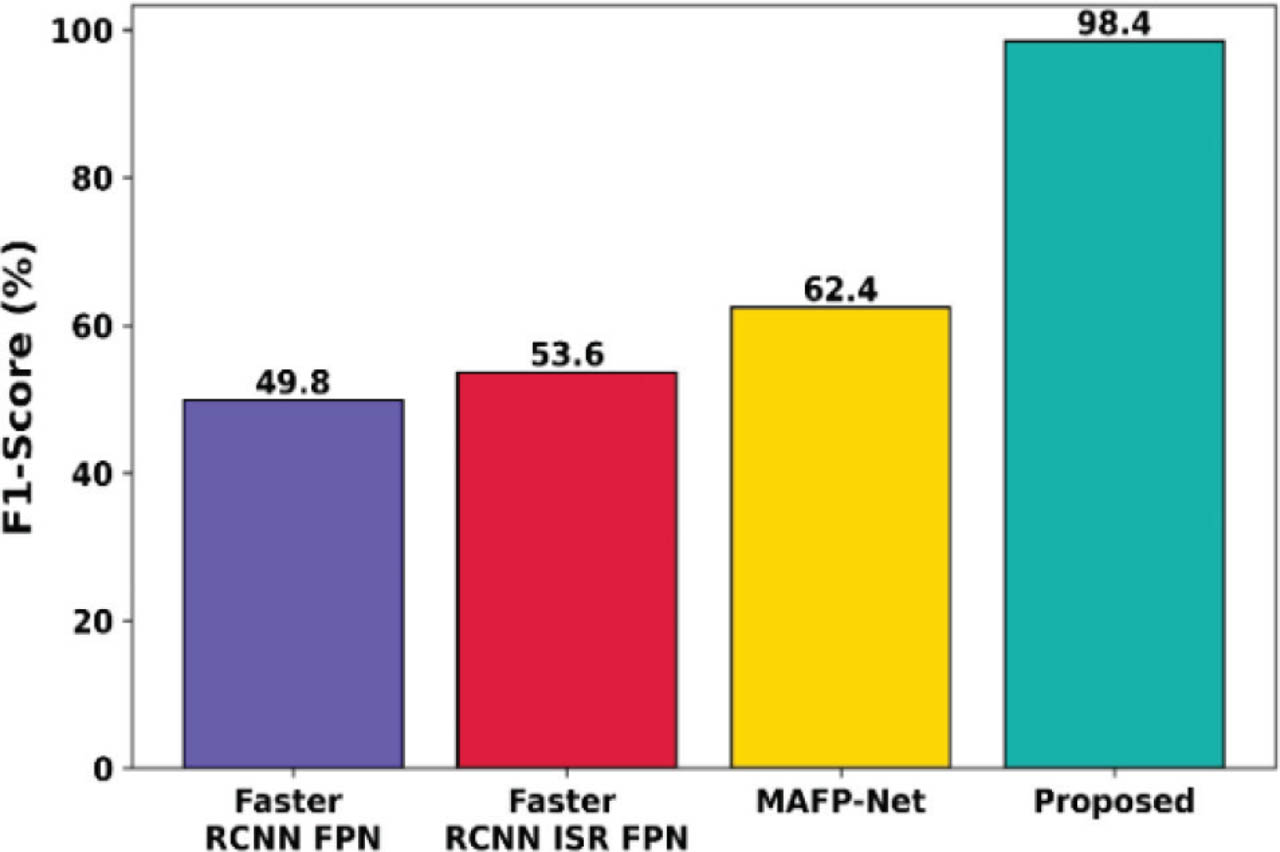
Figure 25:
F1-score comparison of the proposed framework.
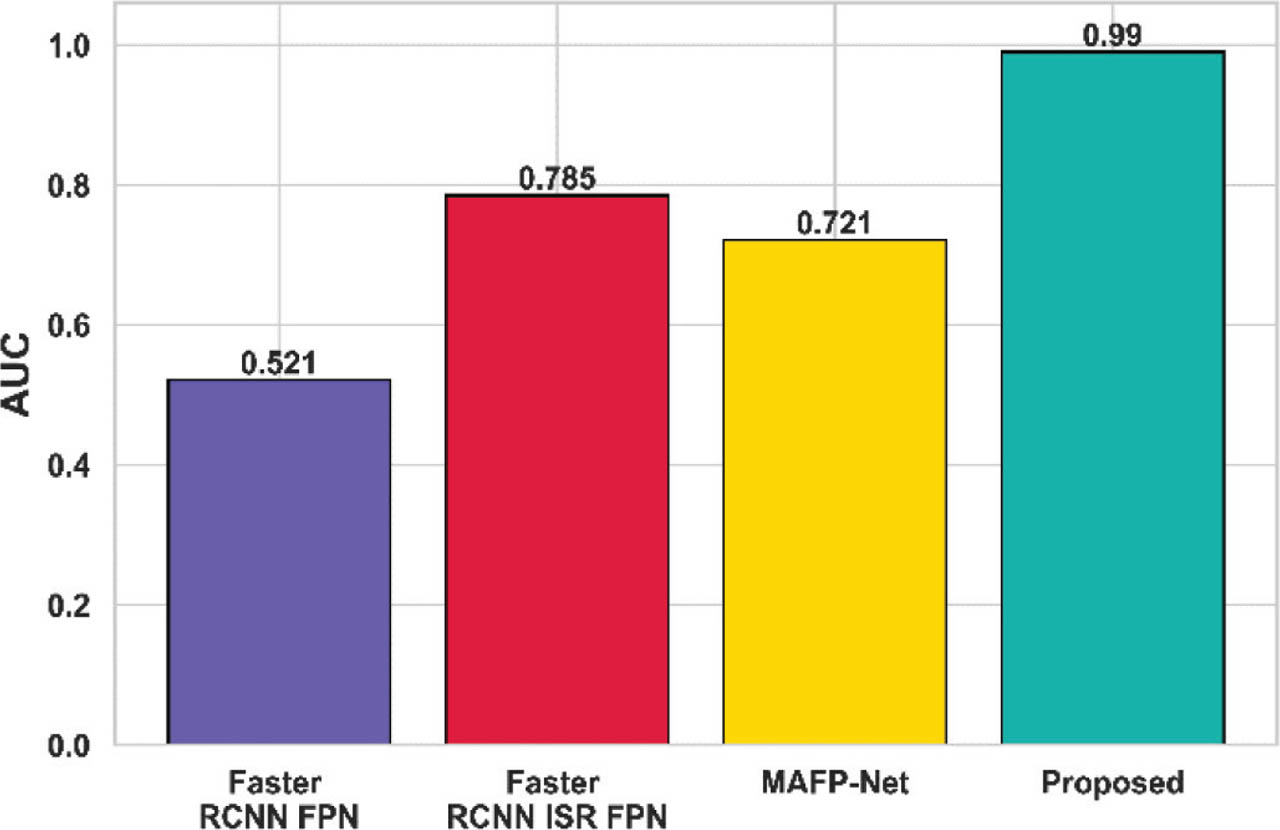
Figure 26:
AUC comparison of the proposed framework. AUC, area under the curve.
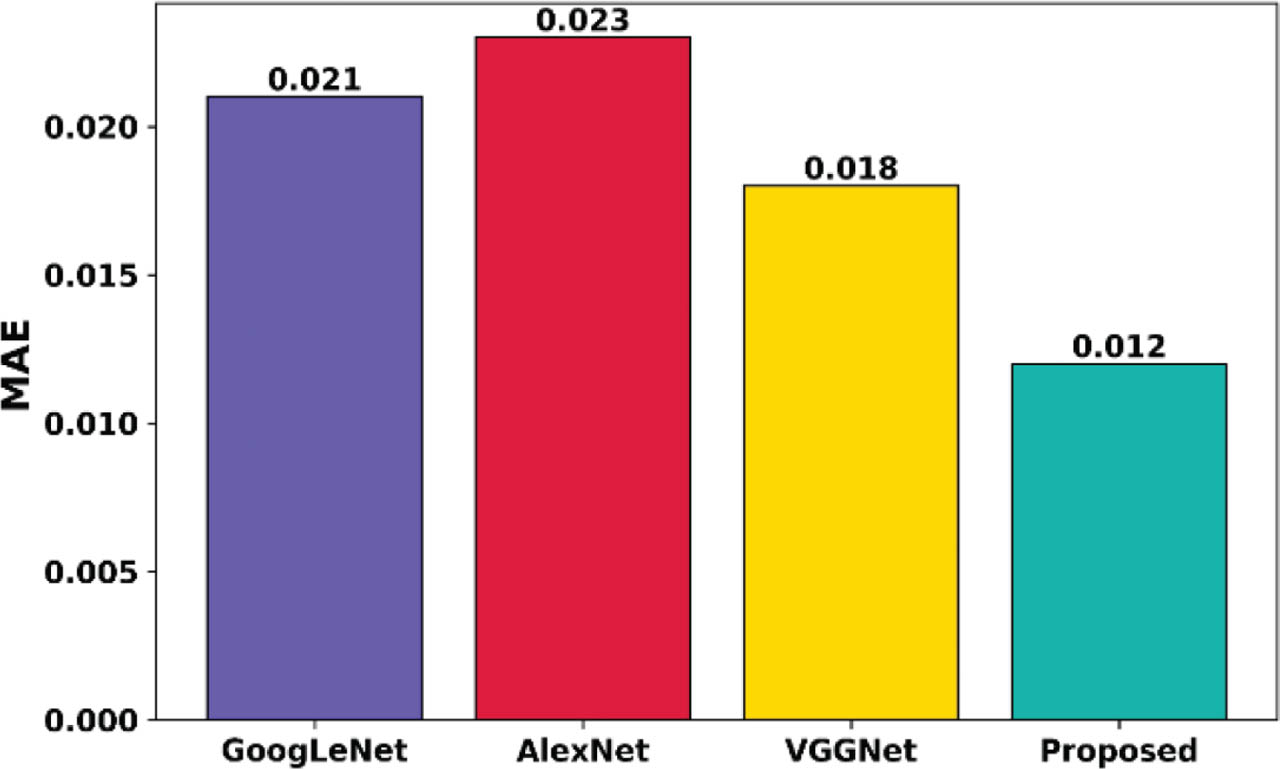
Figure 27:
MAE comparison of the proposed framework. MAE, mean absolute error.
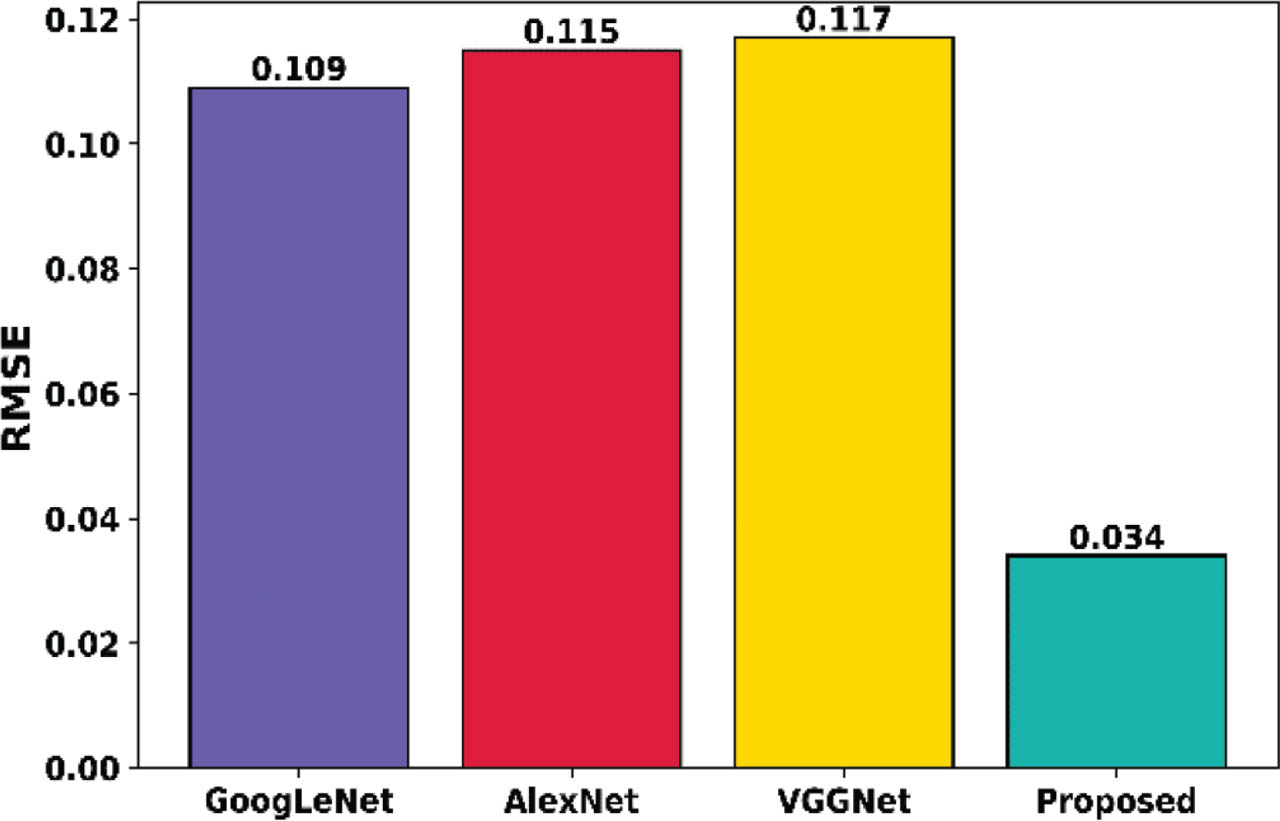
Figure 28:
RMSE comparison of the proposed framework.
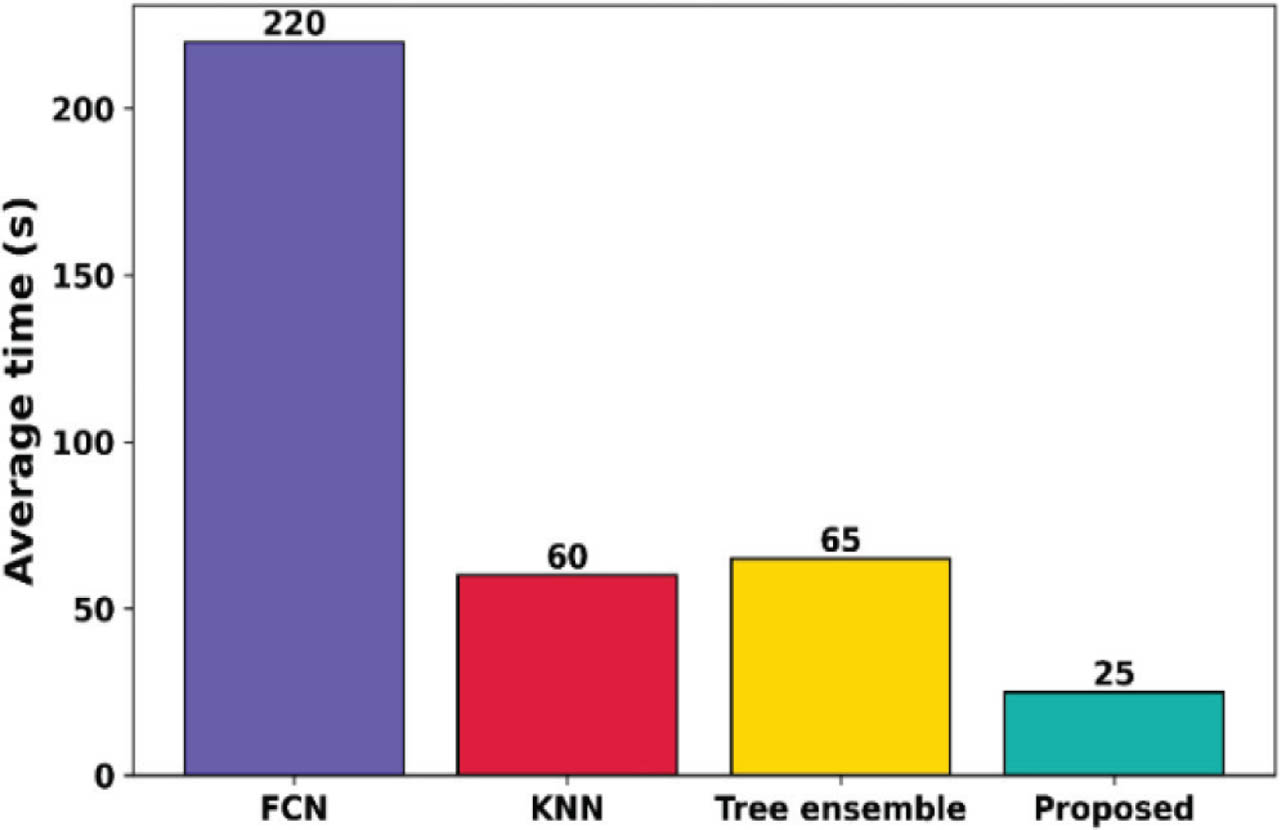
Figure 29:
Average time comparison of the proposed framework.
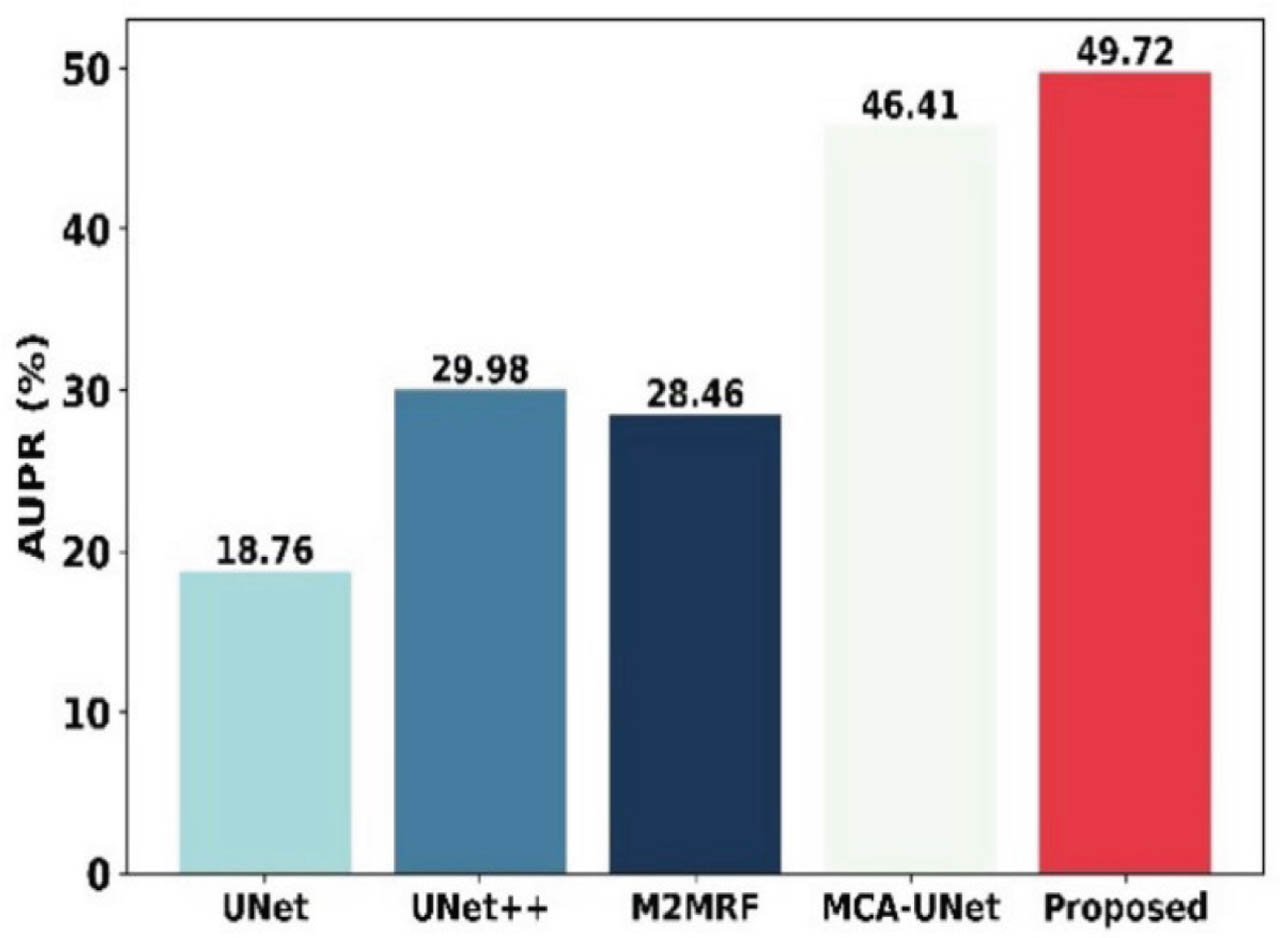
Figure 30:
AUPR comparison of the proposed framework. AUPR, area under the precision-recall curve.
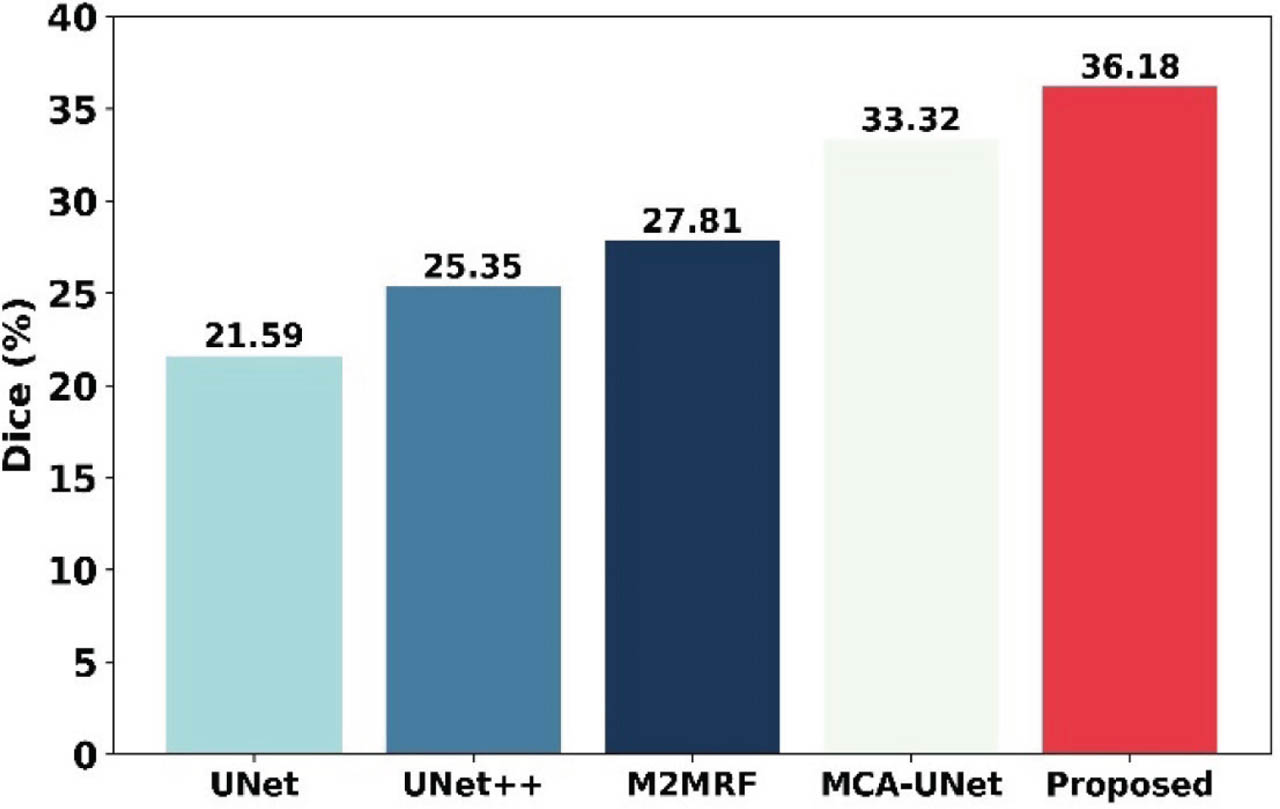
Figure 31:
Dice coefficient comparison of the proposed framework.
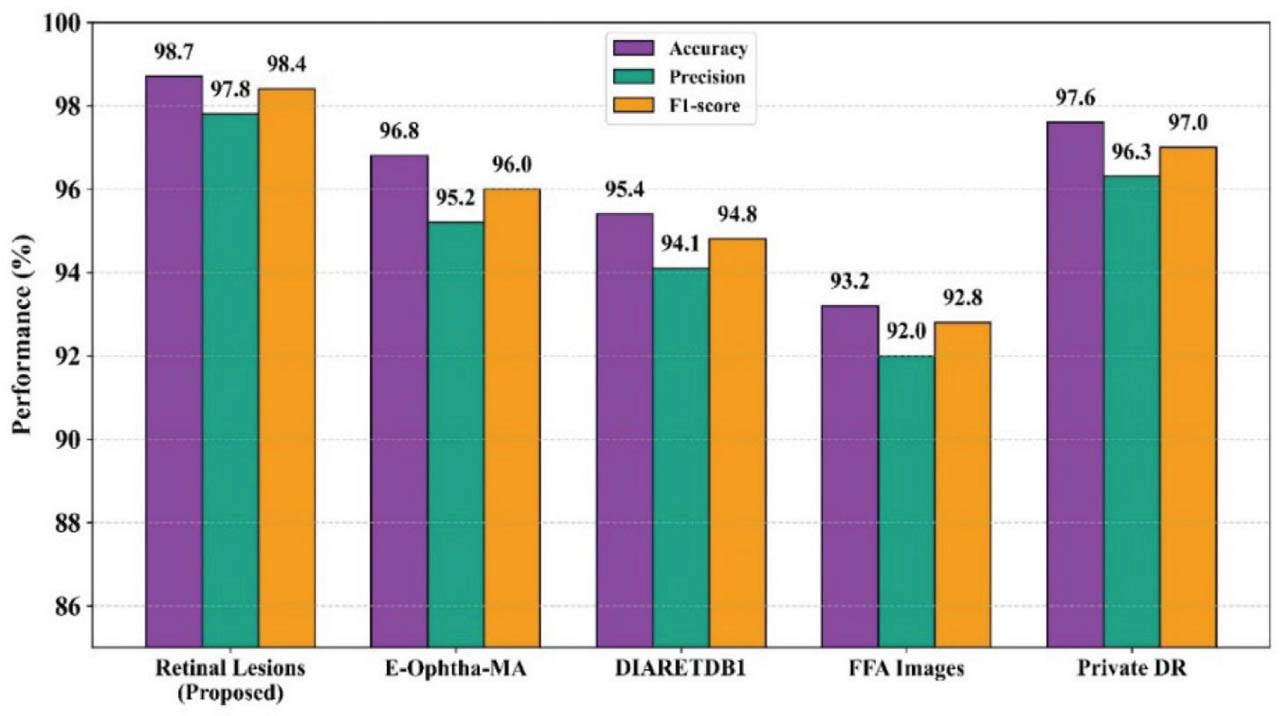
Figure 32:
Cross-dataset performance analysis of the proposed retinal lesion detection framework. DR, diabetic retinopathy; FFA, fluorescein fundus angiography.
Table 1:
Ablation study.
| Configurations | Accuracy (%) | Precision (%) | F1-Score (%) |
|---|---|---|---|
| Without NRDN in the LSTM first layer | 93.62 | 92.80 | 92.95 |
| Without CGLEN | 94.48 | 93.70 | 93.90 |
| Without FCEM | 95.31 | 94.60 | 94.80 |
| Without FOHGTN in the second LSTM layer | 95.96 | 95.20 | 95.40 |
| Without FOVEAN | 96.42 | 95.70 | 95.90 |
| Without HGTN | 96.88 | 96.20 | 96.35 |
| Without LVSMT in the third LSTM layer | 97.34 | 96.70 | 96.90 |
| Without LBT-Net | 97.62 | 96.90 | 97.10 |
| Without ViT | 97.95 | 97.20 | 97.40 |
| Without an SVM classifier | 98.12 | 97.40 | 97.60 |
| Full NFOVSTN-LSTM | 98.70 | 97.80 | 98.40 |
[i] CGLEN, Co-occurrence Gray-Level Edge Network; FCEM, Frangi Contrast Enhancement Module; FOHGTN, Fourier-Otsu Hough Graph Transformer Network; FOVEAN, Fourier-Otsu Vascular Enhanced Attention Network; HGTN, Hough-Graph Transformer Network; LBT-Net, Local Binary Transformer Network; LSTM, long short-term memory; LVSMT, Local Vision Support Machine Transformer; NFOVSTN-LSTM, Neurovascular Fourier-Otsu Vision Support Transformer Network with Long Short-Term Memory; NRDN, Neurovascular Remodeling Detection Network; SVM, support vector machine; ViT, vision transformer.
Table 2:
Statistical analysis
| Metrics | Model | Mean ± SD (%) | 95% Confidence interval (%) |
|---|---|---|---|
| Accuracy | Proposed Model | 98.7 ± 0.6 | [97.52, 99.88] |
| VCG-19% Inception-V3 | 94.0 ± 1.2 | [91.65, 96.35] | |
| SBF-based MA | 83.0 ± 1.8 | [79.47, 86.53] | |
| DCNN | 69.0 ± 2.3 | [64.49, 73.51] | |
| Precision | Proposed Model | 97.8 ± 0.7 | [96.43, 99.17] |
| VCG-19% Inception-V3 | 63.3 ± 2.0 | [59.38, 67.22] | |
| SBF-based MA | 40.2 ± 2.5 | [35.30, 45.10] | |
| DCNN | 42.1 ± 2.1 | [37.98, 46.22] | |
| F1-Score | Proposed Model | 98.4 ± 0.5 | [97.42, 99.38] |
| VCG-19% Inception-V3 | 62.4 ± 1.9 | [58.68, 66.12] | |
| SBF-based MA | 52.6 ± 2.2 | [48.29, 56.91] | |
| DCNN | 49.5 ± 2.4 | [44.80, 54.20] |