
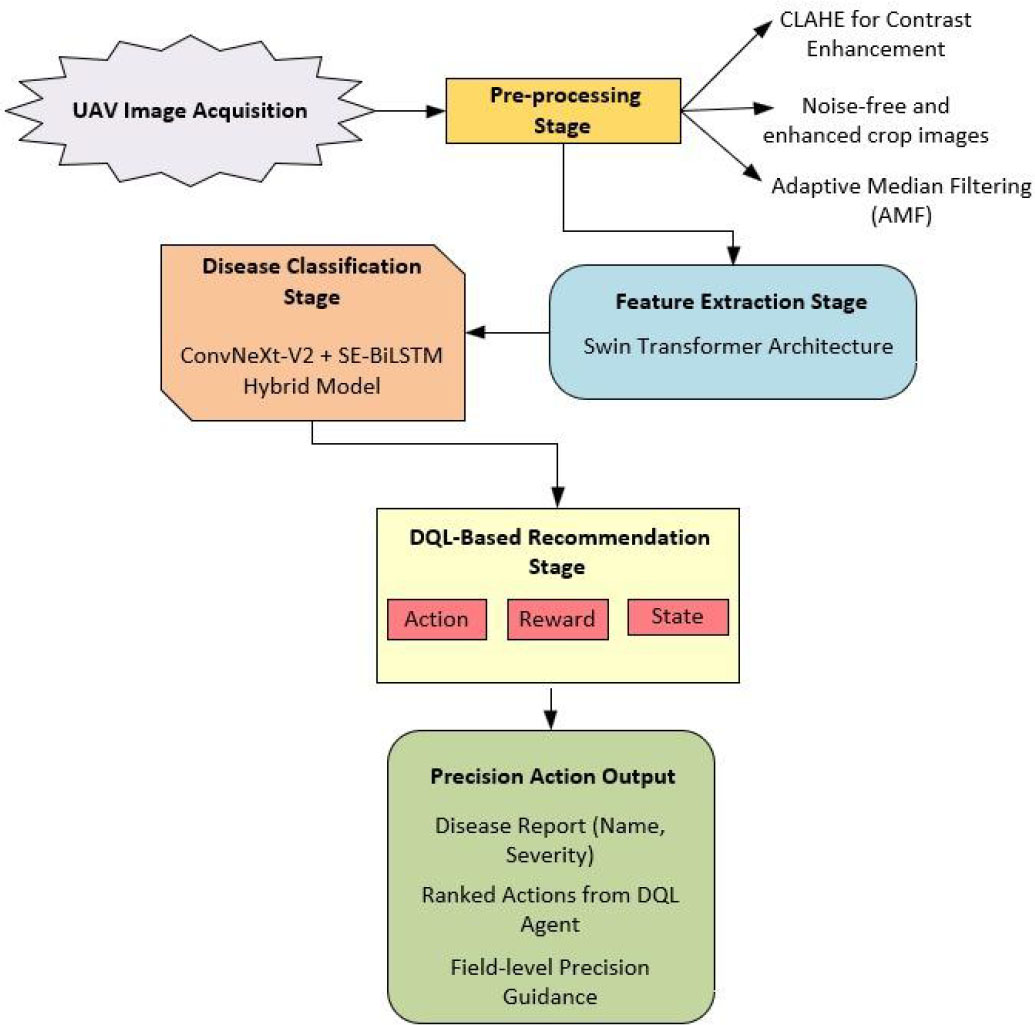
Figure 1:
Proposed cotton leaf disease detection framework. AMF, adaptive median filtering; CLAHE, contrast-limited adaptive histogram equalization; DQL, Deep Q-Learning.
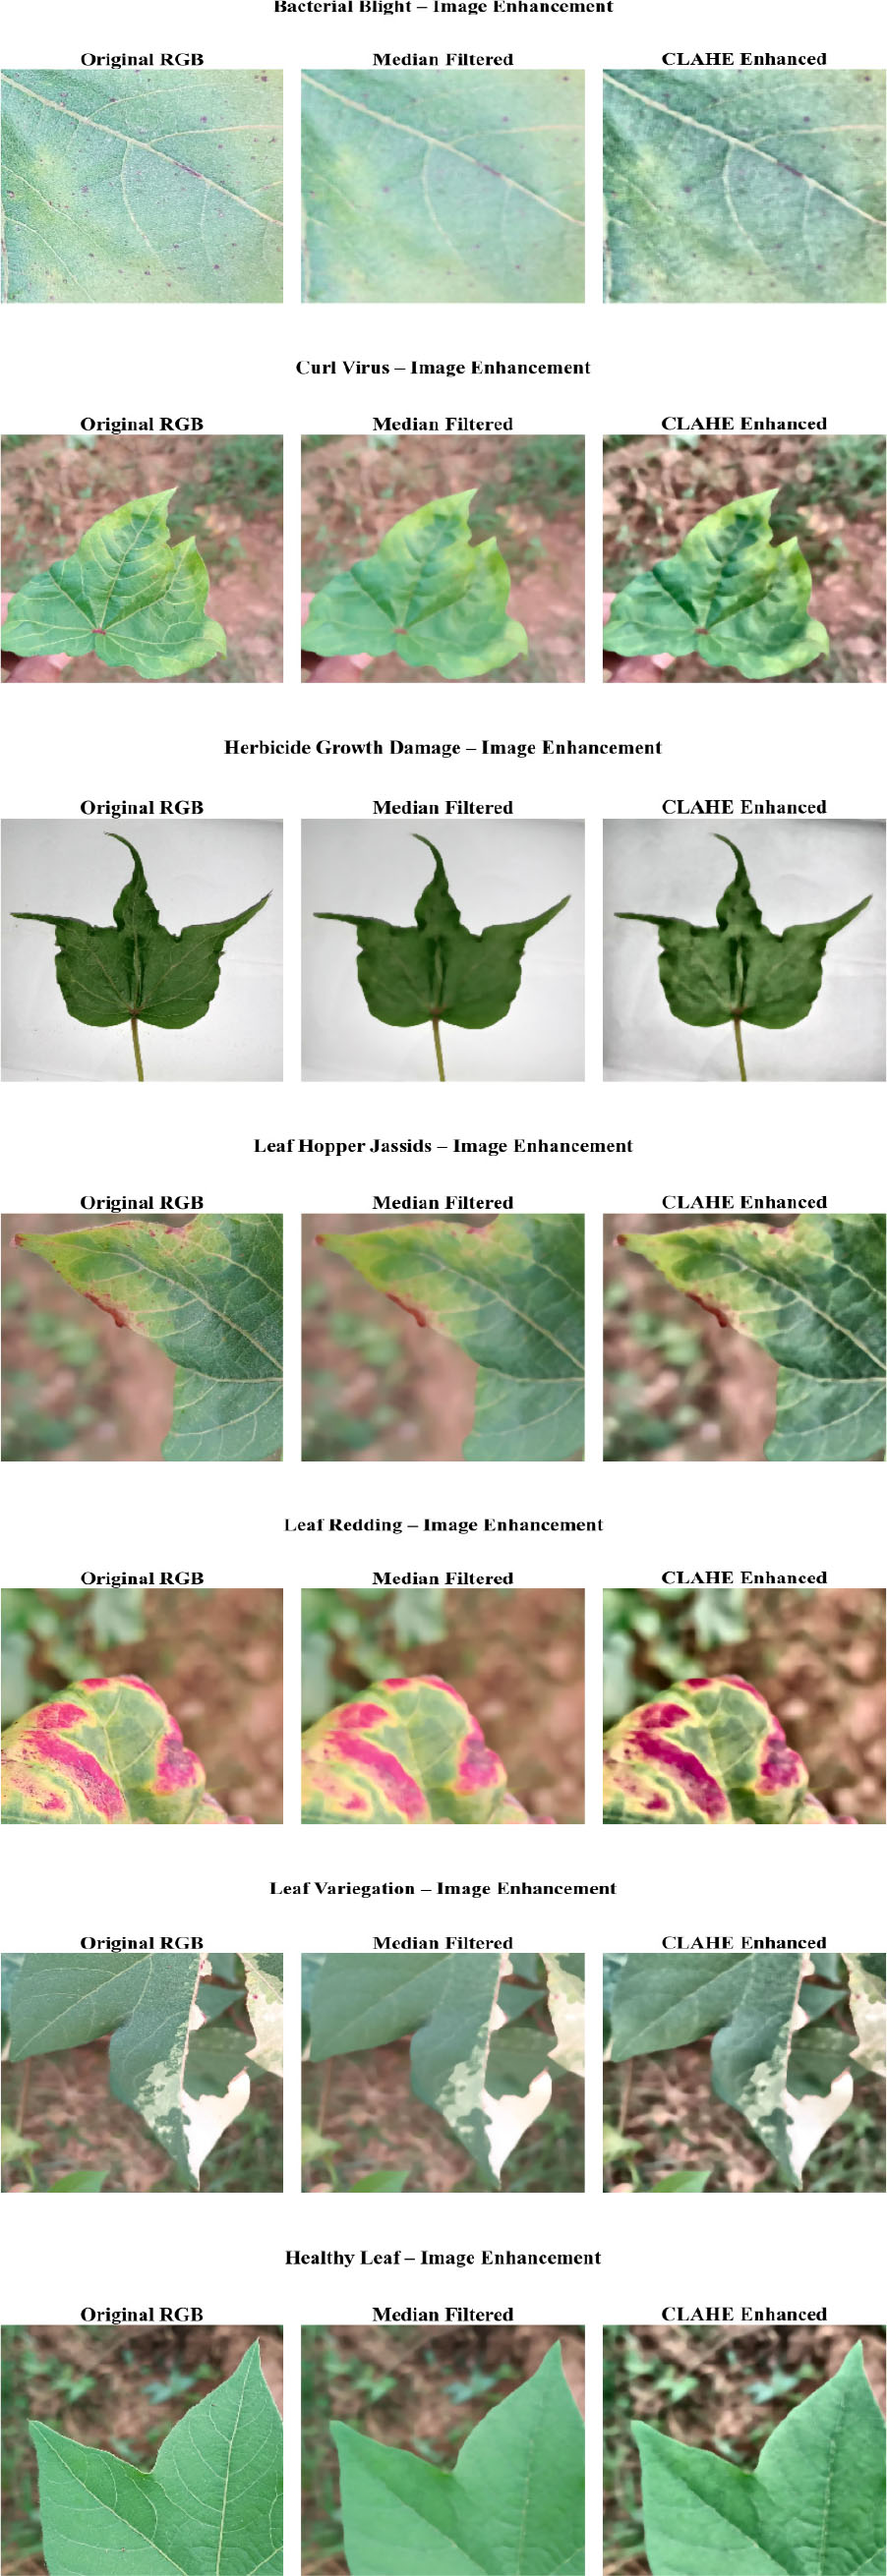
Figure 2:
Sample pre-processed images for different disease types. CLAHE, contrast-limited adaptive histogram equalization.
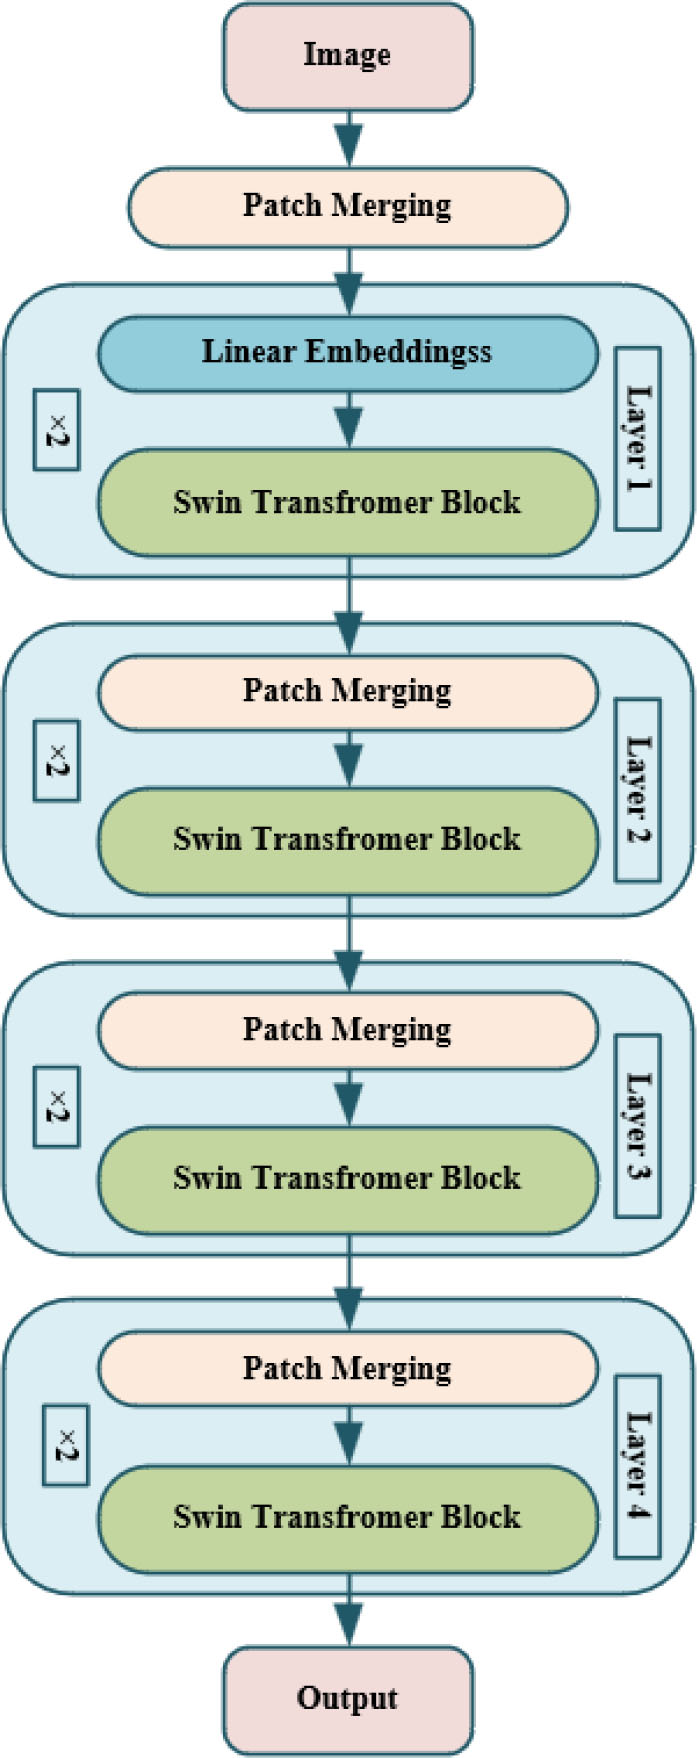
Figure 3:
Architecture of the Swin Transformer model.
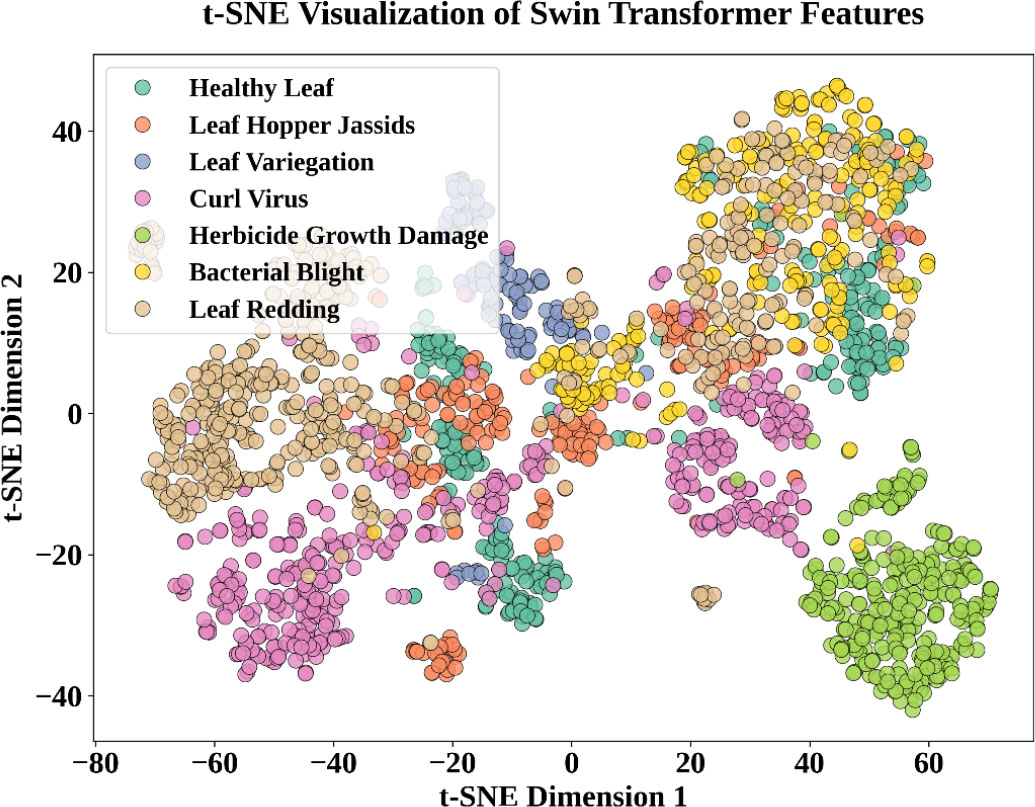
Figure 4:
t-SNE visualization of Swin Transformer features.
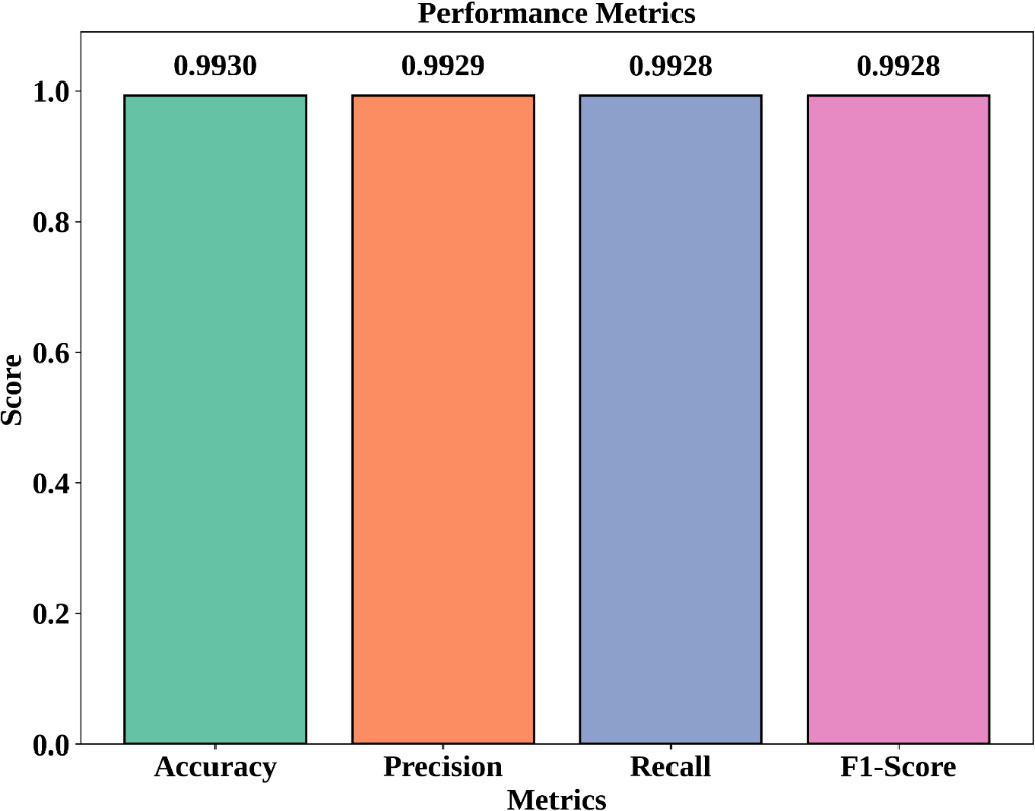
Figure 5:
Performance metrics comparison.
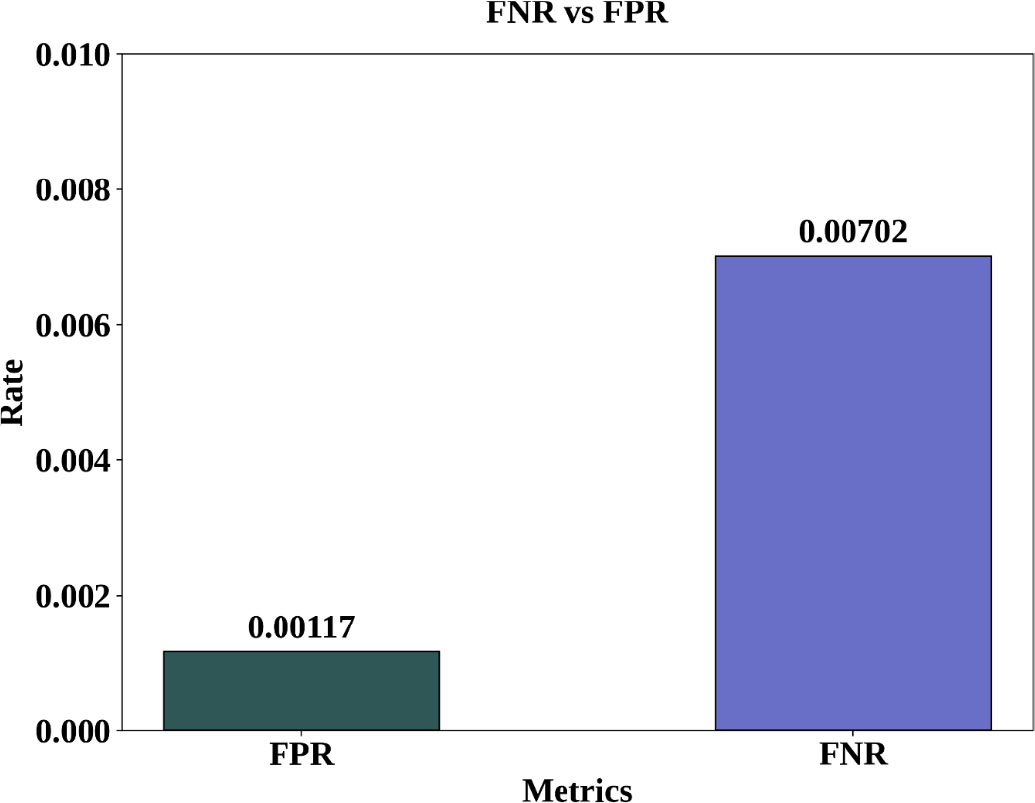
Figure 6:
Comparison of FNR and FPR.
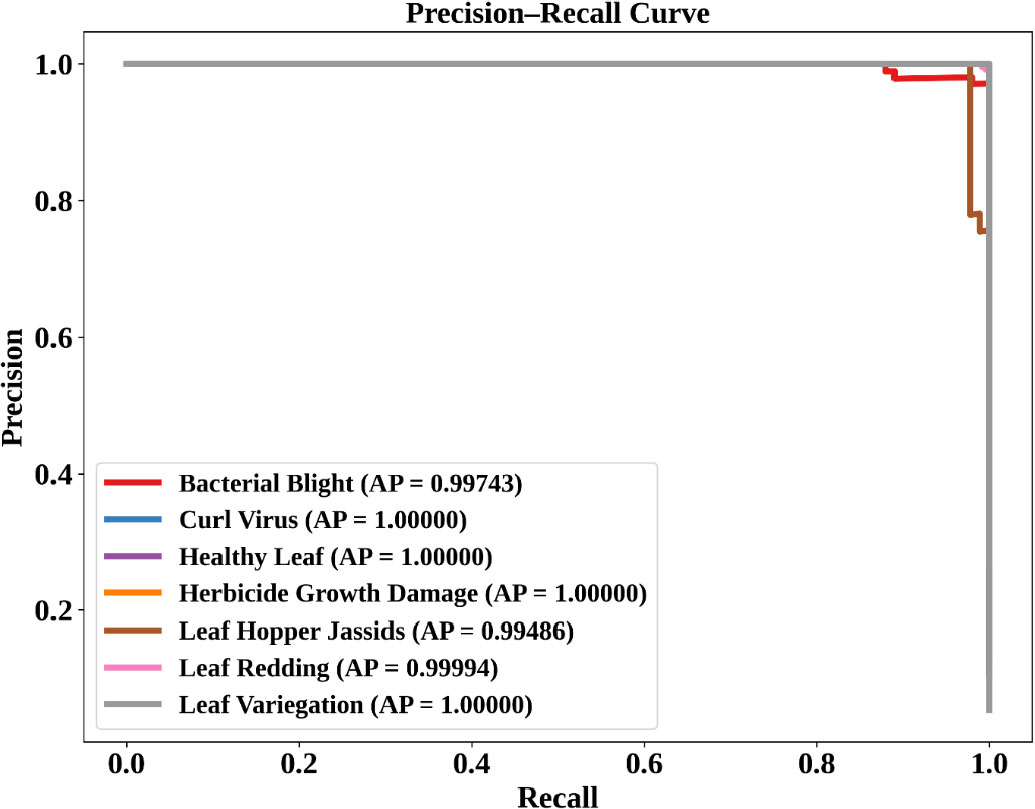
Figure 7:
PR curve for plant conditions. PR, precision-recall; AP, average precision.
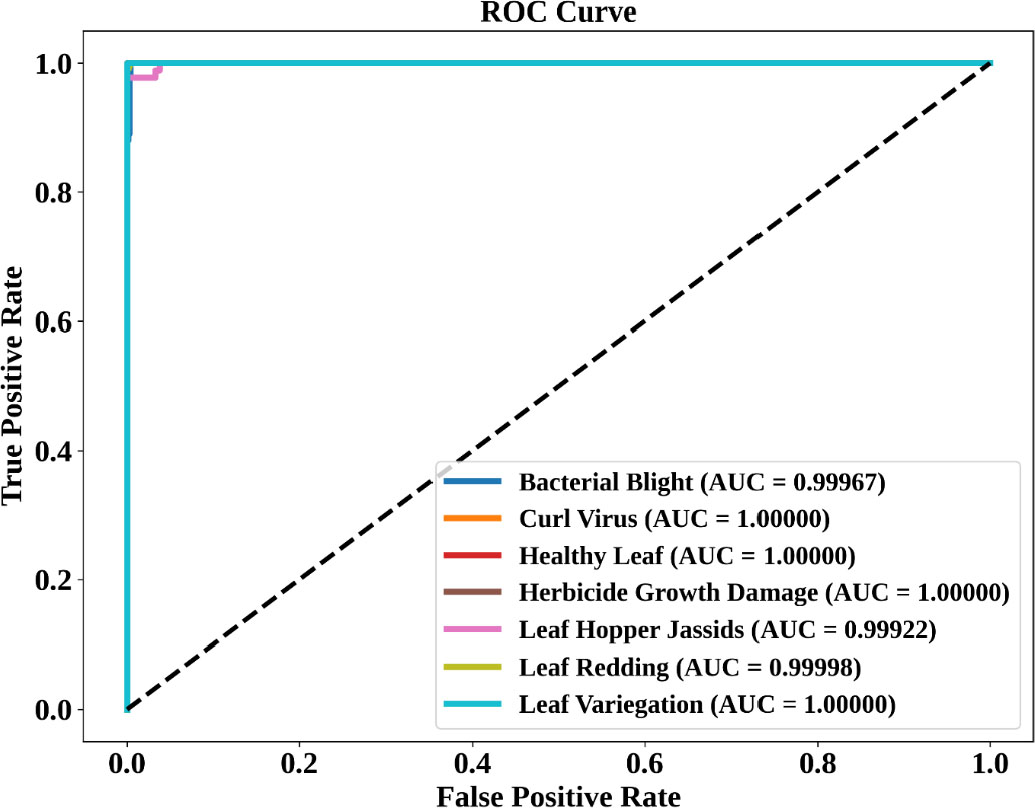
Figure 8:
ROC curve for plant conditions. AUC, area under the curve.
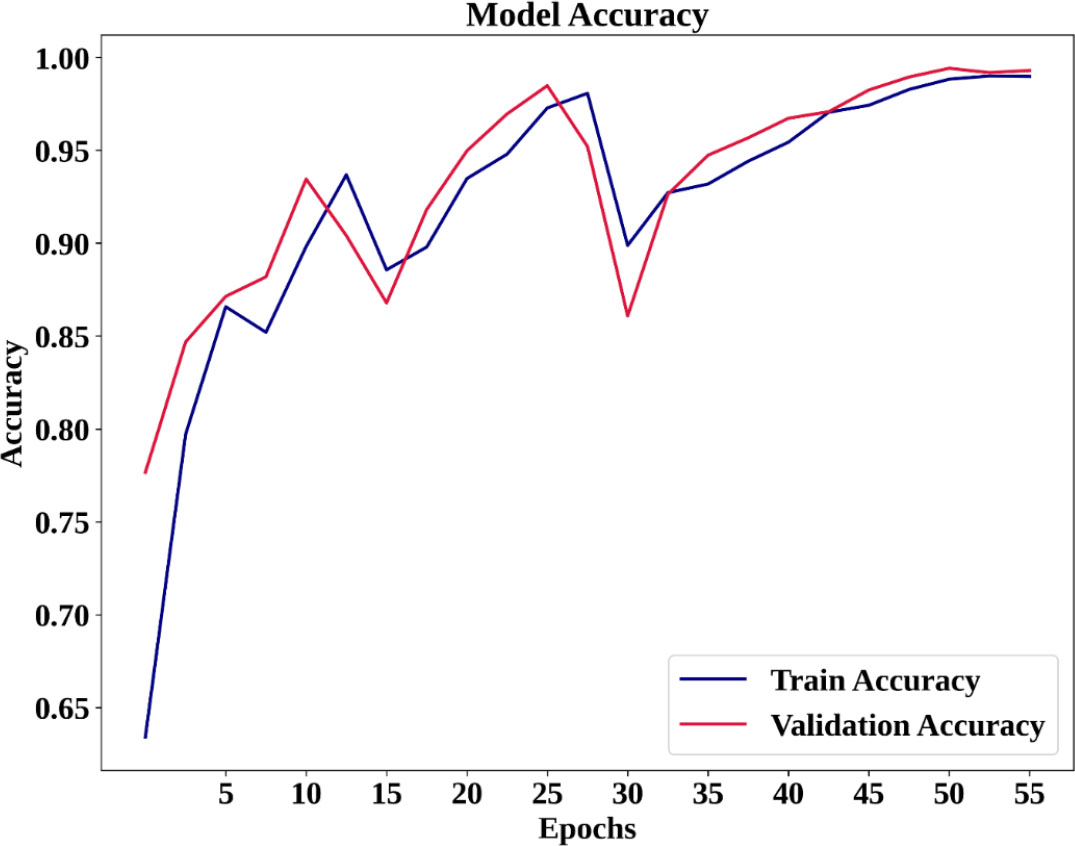
Figure 9:
Model accuracy over epochs.
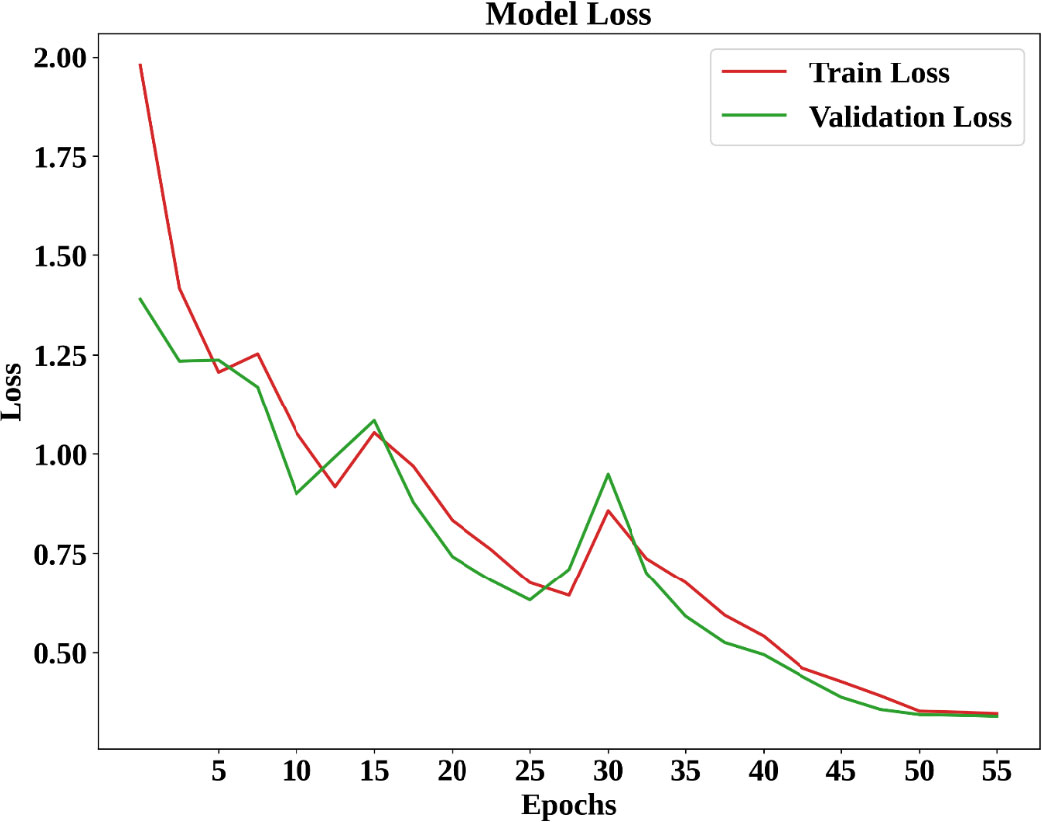
Figure 10:
Model loss over epochs.