
I. Introduction
Presentation attack detection (PAD) is a critical component of biometric authentication, preventing fraud, enhancing security, ensuring compliance, and maintaining trust in biometric systems. As spoofing techniques evolve, robust PAD solutions are necessary to safeguard sensitive systems from unauthorized access. Biometric traits are essential for individual identification due to their uniqueness and distinctiveness, but these characteristics are publicly observable, making biometric systems reliant on more than just secrecy for security. For example, hidden fingerprints can be collected from various surfaces and used to create counterfeit biometric artifacts, which can then be used in presentation attacks (PAs). Unlike traditional password-based systems that rely on matching credentials, biometric systems need an additional layer of verification to ensure the biometric data is from an authorized, live individual. This verification step, known as PAD, is vital for enhancing security (Schuckers, 2016) [4]. Fingerprint PAD techniques can be categorized into hardware-based and software-based approaches. Hardware-based methods utilize additional sensors to collect supplementary information, such as skin temperature, spectral absorption, or pulse oximetry data. By contrast, software-based methods analyze the digital image captured by the fingerprint sensor, eliminating the need for extra hardware. Software-based techniques can be further classified into static and dynamic methods. Static methods focus on analyzing a single fingerprint image, while dynamic methods examine a series of images over time to identify distinguishing features. For instance, Antonelli et al. (2006) [6] introduced a dynamic method that requires users to apply pressure and twist their finger on the sensor to capture a time-series sequence. This research found that counterfeit fingers are less flexible and distort differently from human skin. However, developing a method to measure distortion during regular finger placement, without requiring twisting, could improve user experience and practical application. The primary advantage of biometric authentication lies in the uniqueness of individual features (Jain, 2009) [7]. Iris patterns and fingerprints are distinct for each person, making them difficult to replicate. Unlike password, biometric traits cannot be easily hacked or visually remembered. As a result, fingerprint-based authentication systems are broadly used. However, the growing use of these systems has also made them vulnerable to attacks.
Hardware-based PAD methods are effective but often expensive and require users to interact with additional sensors (Derakhshani et al., 2003) [8]. By contrast, software-based methods do not rely on invasive measurements, but they struggle with identifying features that can differentiate between live and fake fingerprints. Dynamic software methods, which require multiple time-series images (Parthasaradhi et al., 2005) [9], can be computationally intensive, while static methods, which capture a single image, are faster and more user-friendly (Dubey et al., 2016) [2]. With the growth of online payments, Internet banking and other applications, the use of smart devices has surged (Chugh et al., 2018; Liu et al., 2021; Jain et al., 2009) [10, 1, 11]. Automated Fingerprint Recognition Systems are increasingly integrated into these devices for personal authentication (Liu et al., 2021) [1]. To combat the safety challenges postured by PAs, various PAD techniques have been proposed (Goicoechea-Telleria et al., 2016) [12]. The fingerprint LivDet competitions, organized since 2009, have become a key venue for evaluating PAD methods using publicly available datasets such as LivDet2011, LivDet2015, and LivDet2017 (Ghiani et al., 2013; Ghiani et al., 2015) [13, 14]. PAD methods are typically categorized into two main types: hardware-based and software-based approaches (Marasco & Ross, 2014) [15].
a. Hardware-based approaches
Hardware-based PAD methods use specialized sensors to detect live biometric structures such as odor, blood flow, and heartbeat, allowing them to distinguish between real and spoofed samples (Robison & Andrews, 2019) [16]. Examples of these technologies include:
Spectroscopy-Based Devices: Nixon et al. (2004) [17] developed a device that analyzes the spectral characteristics of a fingertip, helping to differentiate between live and spoofed samples.
Pulse Oximetry Devices: Reddy et al. (2008) [18] demonstrated the effectiveness of pulse oximetry in detecting live fingers by measuring blood oxygen levels and pulse rates.
Other advanced imaging techniques such as multispectral imaging, short-wave infrared imaging, and optical coherent tomography (OCT) are also used in hardware-based PAD systems.
b. Software-based approaches
Software-based PAD means function without extra hardware and are typically divided into two types: traditional methods and convolutional neural network (CNN)-based methods.
b.i. Traditional methods
Traditional software-based PAD methods differentiate between live and spoofed fingerprints by analyzing handmade features, including anatomical structures used for locations of key points and ridge distributions, physiological features indicators like secretion and ridge alteration and texture-based structures that utilizes patterns and textures within the fingerprint images (Schuckers & Johnson, 2017; Jia et al., 2007; Antonelli et al., 2006; Xia et al., 2018) [19, 20, 21, 22].
b.ii. CNN-based methods
CNN-based PAD methods leverage deep learning (DL) techniques to automatically extract multiscale features using convolutional and pooling layers. Unlike traditional methods, CNN-based approaches eliminate the need for manual feature extraction, simplifying the process (Nogueira et al., 2016) [23]. These methods have shown significant improvements over traditional hand-crafted feature techniques (Mura et al., 2015; Menotti et al., 2015) [24, 25].
In this paper, Section II represents a review of notable fingerprint liveness detection methods, while Section III has a detailed overview of the datasets used in the study. Section IV describes the proposed method, which employs an ensemble of classification models. Gabor filters are used to detect frequency and orientation patterns in the image. The dataset images are converted into grayscale by reshaping it, which is useful to reduce dimensions. The approach integrates three models for training and combines their outputs using an average score. The experimental results and comparisons with current state-of-the-art methods are given in Section V; finally in Section VI the conclusion and future works are discussed.
II. Related Work
This section examines prior research on software-based fingerprint liveness detection. As the focus here is on software approaches, those interested in hardware-based methods can refer to works of Baldisserra et al. (2005) [26] and Stephanie et al. (2002) [27]. Software-based techniques derive intrinsic features directly from fingerprint images acquired by sensors, with many of these methods emphasizing the analysis of perspiration patterns in skin pores (Derakhshani et al., 2003) [8].
a. Dynamic software-based approaches
Dynamic approaches involve extracting features from multiple frames of a fingerprint, allowing the analysis of changes over time to capture vital information for liveness detection. These techniques can be categorized into approaches based on skin deformation and those based on perspiration analysis.
a.i. Methods based on skin deformation
Thin-Plate spline (TPS) Model: Zhang et al. (2007) [28] introduced a method that analyzes fingerprint deformation using the TPS model. This approach requires users to apply pressure in four different directions, measuring the distance between minutiae points in distorted and undistorted fingerprints. The study revealed that live fingers exhibit more significant non-linear distortions than fake fingers, due to their natural flexibility. The method achieved an equal error rate (EER) of 11% on a non-standard dataset. However, its effectiveness is heavily reliant on user cooperation and precise instructions, making it less practical in real-world applications.
Skin Distortion Analysis: Antonelli et al. (2006) [21] introduced a liveness detection technique that requires the finger to move while pressing against the scanner, enhancing the distortion effects for analysis. The study showed that live fingers exhibit more noticeable distortion compared with fake fingers, with an EER of 4.9%. However, this technique requires specialized devices and is computationally intensive due to the need to process multiple frames of images.
Elasticity-Based Method: Jia et al. (2007) [20] designed a technique to evaluate skin elasticity by capturing a series of images as the finger is placed on the scanner. The method extracts two primary features: the correlation coefficient’s signal intensity within the fingerprint area and the standard deviation of the fingerprint area’s expansion. To classify live and fake fingerprints, the Fisher Linear Discriminant is applied. On a custom dataset, this approach achieved an EER of 4%. However, similar to the other methods, it depends on user cooperation and accurate data capture, limiting its applicability in uncontrolled environments.
Although dynamic software-based methods show promise in improving liveness detection, they often require user cooperation and precise data acquisition, which can be difficult to achieve in practical, real-world scenarios. Additionally, many of these techniques rely on custom hardware or specific user instructions, further limiting their scalability and practicality. These challenges highlight the need for more robust, user-friendly solutions for fingerprint liveness detection.
a.ii. Perspiration-based approaches
Perspiration-based methods for fingerprint liveness detection focus on analyzing the perspiration patterns on fingers over time. These techniques extract features from fingerprint images taken at specific intervals to differentiate amid live and fake fingerprints. Derakhshani et al. (2003) [8] leveraged the perspiration effect by capturing two fingerprint images at different time intervals. The middle ridge signals from these images were analyzed and compared using a back-propagation neural network classifier to differentiate live fingerprints from fake ones. This approach demonstrated 100% accuracy on a small dataset comprising 18 live, 18 spoof, and 18 cadaver fingerprints. The dataset used was limited, reducing the generalizability of the results. Abhyankar and Schuckers (2006) [33] introduced a fingerprint liveness detection approach utilizing wavelet analysis to examine physiological perspiration patterns from fingerprint images captured at different intervals. The method’s primary features included multiresolution analysis and wavelet packet analysis. Nikam and Agarwal (2009) [29] introduced a Ridgelet Transform-Based Method, which uses ridgelet transforms to efficiently analyze fingerprint textures. Unlike earlier perspiration-based methods, this technique requires only a single fingerprint image for liveness detection. Key features included ridgelet energy and co-occurrence signature to classify fingerprint images.
b. Limitations of perspiration-based approaches
Despite their promising results, perspiration-based approaches have several challenges:
Dependency on Finger Pressure: Proper pressure and a fixed time duration are essential for accurate feature extraction.
Time-Consuming: Interval-based image capture is required, making these methods impractical for real-time authentication.
User Cooperation: These methods heavily depend on the user’s compliance for accurate results.
Scalability Issues: Many of these approaches rely on small or non-standard datasets, which limits their effectiveness in real-world applications.
While perspiration-based methods show potential, their reliance on time-consuming processes and strict user cooperation makes them less suitable for real-time, large-scale fingerprint authentication systems.
c. Static software-based approaches
Static software-based fingerprint liveness detection methods focus on extracting features from a single fingerprint image, overcoming the limitations of dynamic methods, such as high computational requirements and user cooperation. These approaches are particularly valuable when dealing with lower-resolution fingerprint sensors, which typically operate at around 500 dpi. Static methods can be categorized into image quality-based and sweat pore-based techniques.
c.i. Image quality-based approaches
Choi et al. (2009) [30] proposed a method for detecting fake fingerprints by analyzing various static image features, including histogram used for distribution of pixel intensities, power spectrum to characterize in the frequency domain and structural attributes. Nikam and Agarwal (2008) [31] developed a method to differentiate fake and live fingerprints using texture-based features, such as structural roughness for variation in fingerprint texture, orientation and regularity, local binary pattern (LBP) and hybrid classifier for classification. Moon et al. (2005) [32] explored surface coarseness differences between live and fake fingerprints, highlighting that materials like clay and gelatin used in fake fingerprints exhibit distinct surface characteristics. The approach included surface coarseness treated as Gaussian white noise arising from ridge and valley patterns and Denoising the difference between the original and denoised images (noise residue) was used to estimate coarseness. However, this method requires high-resolution images (1000 dpi), which is impractical for most commercial sensors. Abhyankar and Schuckers (2006) [33] utilized local ridge frequency analysis and multiresolution texture analysis to extract features from individual fingerprint images. The system achieved 95.36% accuracy on a custom dataset collected using various fingerprint scanners, including optical, electro-optical, and capacitive devices. Features used in this approach included First-Order Statistics for gray-level distribution of individual pixels. Second-Order Statistics for combined gray-level functions between adjacent pixel pairs. This method also incorporated features such as energy, entropy, median, and variance for classification. Lee et al. (2009) [34] utilized the fast Fourier transform (FFT) to convert fingerprint images into the spatial frequency domain, analyzing the energy spectrum. They found that live fingerprints exhibited higher energy levels compared with fake fingerprints, with the energy differences serving as the primary liveness indicator. This method achieved an EER of 11%.
Limitations of image quality-based approaches
Despite their effectiveness, image quality-based methods face several challenges:
Dataset Generalizability: Many methods rely on custom datasets, limiting their adaptability to diverse or real-world datasets.
Resolution Dependency: Some approaches require high-resolution images (e.g., 1000 dpi), which are not feasible for most commercial sensors.
Computational Complexity: Techniques such as FFT-based analysis or hybrid classifiers can be computationally intensive, which can make real-time implementation challenging.
These limitations suggest a need for more scalable, efficient, and adaptable approaches in fingerprint liveness detection.
c.ii. Sweat pore-based approaches
Sweat pore-based fingerprint liveness detection techniques focus on identifying and analyzing the sweat pores present in fingerprint images. These methods are highly effective in differentiating live fingerprints from fake ones, as the presence, distribution, and characteristics of sweat pores vary between real and synthetic samples. However, these approaches generally require high-resolution sensors (typically greater than 800 dpi) to ensure accurate pore detection. Manivanan et al. (2010) [35] explored sweat pore detection by using high-resolution sensors. The pores were extracted via high-pass filtering, and an association filter was applied to pinpoint the location of the pores. This method necessitated sensors with resolutions above 800 dpi to accurately detect the pores. Espinoza and Champod (2011) [36] highlighted that fake fingerprints, even those with active sweat pores, typically have a different number of pores compared with genuine ones. They used this discrepancy in pore count as a distinguishing feature for liveness detection, achieving an accuracy of 14% using a dataset captured with the CrossMatch Technologies LScan 1000T optical sensor (1000 dpi). Choi et al. (2007) [37] focused on the spacing and distribution of sweat pores. In this study, users were instructed to dry their fingers before scanning, as dry fingers enhanced pore periodicity detection. This method achieved an accuracy of 85%. However, practical challenges arose because live fingers may retain moisture from perspiration, affecting pore visibility. The study also evaluated only one type of fake material (dental impression material), which limited its scope, as other materials like latex rubber or wood glue could produce different pore patterns. Ghiani et al. (2013) [13] proposed a fingerprint liveness detection method based on binarized statistical image features (BSIF), which encode local fingerprint textures into feature vectors. This approach demonstrated superior performance compared with traditional methods like LBP, local phase quantization (LPQ), and pore detection techniques. Using the LivDet 2011 database, the method achieved EERs of 6%, 13%, 3%, and 4% for Biometrika, Italdata, Digital, and Sagem sensors, respectively. Despite its effectiveness, the technique requires significant computational resources due to the large feature set, and its dependency on optimal window size selection for specific sensors reduces its general applicability.
Limitations of sweat pore-based approaches
High-Resolution Dependency: These methods require sensors with resolutions of 800 dpi or higher to accurately detect sweat pores, which are not commonly found in standard fingerprint scanners.
Sensor-Specific Challenges: Techniques like BSIF are sensitive to sensor characteristics, which reduce their adaptability across different hardware configurations.
Practical Constraints: User cooperation, such as ensuring fingers are dry before scanning, introduces usability challenges. Environmental factors, like moisture or dirt, can also affect pore visibility, making these methods less reliable in real-world scenarios.
While sweat pore-based approaches offer valuable insights into fingerprint liveness detection, they face notable challenges related to sensor resolution, user cooperation, and environmental factors. Static software-based methods provide a promising alternative, particularly in scenarios where lower computational overhead and minimal user interaction are preferred. However, addressing issues like sensor resolution dependency and improving dataset generalizability will be essential for wider adoption of these techniques.
d. Combined approaches
Combined fingerprint liveness detection methods integrate both static and dynamic features to improve accuracy by leveraging information from multiple sources. These approaches aim to overcome the limitations of individual static or dynamic methods by combining their strengths. Here is an overview of key the contributions in this area. Ghiani et al. (2012) [38] assessed various advanced fingerprint liveness detection techniques using the LivDet 2011 benchmark dataset. The analysis focused on both live fingerprint features, such as pore detection and ridge wavelet, as well as fake fingerprint features like LBPs, curvelet energy, and wavelet energy. Their results indicated that LBP was the most effective feature, achieving an average EER of 14%. However, LBP’s sensitivity to image rotation reduced its robustness, and the method was computationally intensive due to the large histograms involved. Jia et al. (2007) [39] employed a time-series analysis to distinguish between live and fake fingerprints, extracting features related to skin elasticity and perspiration patterns. They used a support vector machine (SVM) for classification, achieving an EER of 4.5%. However, this method required multiple image sequences and was time-consuming, with experiments limited to fake fingerprints made of gelatin, lacking evaluation across other materials. Marasco and Sansone (2012) [40] combined texture and perspiration features for liveness detection, capturing fingerprint images at two intervals (0 s and 5 s). Their method achieved an overall accuracy of 74% on the LivDet 2009 competition dataset. However, their reliance on multiple image captures increased the time required for acquisition, making it less practical for real-time use. Liu et al. (2021) [1] proposed a novel channel-wise feature denoising PAD (CFD-PAD) method that addressed redundant “noise” by weighting channel importance and distinguishing between discriminative and noise channels. This method used OCT devices to collect depth features, achieving 100% accuracy across four types of artificial fingerprints. However, the reliance on OCT devices, which are expensive, limits its widespread adoption. Nogueira et al. (2016) [23] utilized pre-trained deep CNNs originally designed for object recognition tasks and fine-tuned them for fingerprint PAD. They demonstrated enhanced performance through transfer learning on the LivDet 2015 dataset, outperforming models initialized randomly. Chugh et al. (2018) [10] developed a fingerprint PAD technique based on a CNN, incorporating fingerprint domain knowledge by extracting local patches aligned with minutiae points. For classification, they employed the MobileNet-v1 CNN model.
d.i. Limitations of combined approaches
Sensor Dependency: Many of these methods require specialized hardware, such as OCT or ultrasonic sensors, which increases costs and limits their adoption.
Time Consumption: Techniques that involve multiple image acquisitions or time-series analysis are computationally expensive and unsuitable for real-time applications.
Limited Generalization: Some methods perform well only on specific datasets or materials, which limits their ability to generalize to different sensors or environments.
While combined approaches show significant promise by integrating both static and dynamic features, challenges related to hardware dependency, computational costs, and dataset generalization need to be addressed for broader applicability.
e. Further developments and challenges
Methods proposed by Nogueira et al. (2016) [23] and Chugh et al. (2018) [10] showed strong performance when training and testing on the same sensor. However, accuracy significantly dropped when cross-sensor testing was conducted. For instance, Nogueira et al. (2016) [23] observed an average classification error (ACE) of 25% in cross-sensor scenarios, while Chugh et al. (2018) found that ACE exceeded 25% when training with Biometrika 2011 and testing with ItalData 2011. Chugh and Jain (2020) [41] proposed a style-transfer-based method to improve generalization across materials and sensors. The method synthesized fingerprint images by transferring style characteristics from known materials, thereby improving the ACE of certain models. However, this method requires access to images from the target material or sensor, which may not always be available. It also relies on patches as input, potentially losing spatial relationships in the fingerprint. To address these challenges, Liu et al. (2021) [42] proposed a global–local model-based PAD approach that combines both global and local features to compute a final spoof score. This method does not rely on target material or sensor images, showing better generalization with an ACE rate of 2% in cross-sensor settings. However, it involves ensemble learning, which complicates the training process and increases computational time, potentially limiting its application in real-time scenarios. A notable insight from DL-based fingerprint PAD methods is the coexistence of both live and spoof features within input images. By utilizing techniques such as Grad-CAM (Selvaraju et al., 2017) [43], researchers have been able to identify regions of interest and visualize heat maps within fingerprint images. This dual-feature analysis can improve PAD models by facilitating the differentiation between live and spoof features during model training.
This study introduces “Invisible Scout”, a multi-module system designed to detect rogue access points (RAPs) that mimic legitimate Wi-Fi networks, posing significant security threats. The system comprises four key modules: sniffer, detection, probing, and comparison. Evaluations in both controlled and real-world environments demonstrated high effectiveness. In controlled setups, the decision tree model achieved an area under the curve (AUC) score of 0.921 and a classification accuracy (CA) of 0.875. Performance improved in open environments, with an AUC of 0.952 and CA of 0.994. Under de-authentication attack scenarios, the model achieved an AUC of 0.955 and CA of 0.996. The study suggests future research should focus on refining detection mechanisms, incorporating real-time response capabilities, and expanding testing across diverse network scenarios (Arisandi et al., 2025) [44].
This research focuses on detecting Flood and Brute Force cyberattacks targeting Internet of Things (IoT) devices using various machine learning (ML) and DL models. Eight models were evaluated: decision tree (DT), K-Nearest neighbor (KNN), RF, SVM, logistic regression (LR), gradient boosting (GB), naïve bayes (NB), and artificial neural network (ANN). Experiments were conducted using two feature sets—one with six features and another, after feature selection, with three features. All models exhibited high performance; however, the GB classifier outperformed others, achieving accuracy levels of 95.94% with six features and 95.28% with three features (Aljabri et al., 2024 [45]).
This study proposes an enhanced indoor positioning method that combines clustering algorithms to improve the accuracy of fingerprint-based localization systems. By sequentially hybridizing clustering techniques, the authors aim to reduce the dimensionality of received signal strength (RSS) fingerprints and enhance localization precision. The approach addresses challenges in indoor positioning, such as signal variability and environmental factors, by effectively grouping similar signal patterns. The proposed method demonstrates improved localization accuracy compared with traditional fingerprint-based techniques, offering potential applications in various indoor environments (Yaro et al., 2024 [46]).
Despite advancements in fingerprint PAD, challenges related to hardware dependency, computational overhead, and sensor-specific performance remain. Further research into optimizing models for generalization across various sensors, as well as improving real-time usability, is essential for the widespread adoption of these methods. Additionally, exploring live and spoof feature coexistence could lead to more robust and interpretable models in the future.
III. Dataset
The Clarkson LivDet2015 fingerprint dataset as shown in Figures 1–3 serves as a key benchmark for evaluating the effectiveness and resilience of fingerprint recognition systems against PAs. It provides a diverse collection of spoofed fingerprint images, utilizing various materials and molding techniques, which allows researchers to test their detection algorithms under real-world conditions. By using the LivDet2015 dataset, researchers can assess how well their methods perform in detecting different spoofing methods, contributing to advancements in biometric security. The dataset is partitioned in the ratio of 70:20:10 for train-test-validation.
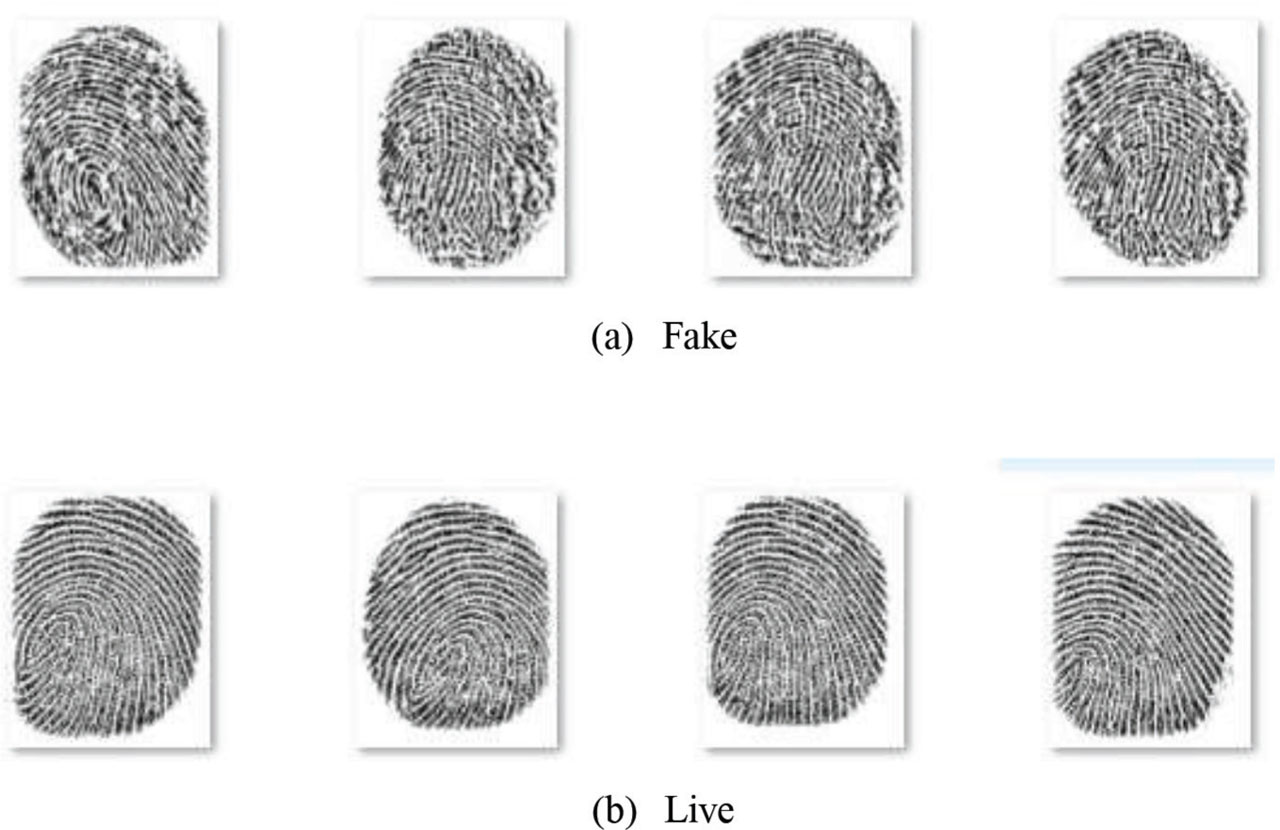
Figure 1:
Sample fingerprints of Clarkson2015 dataset1.
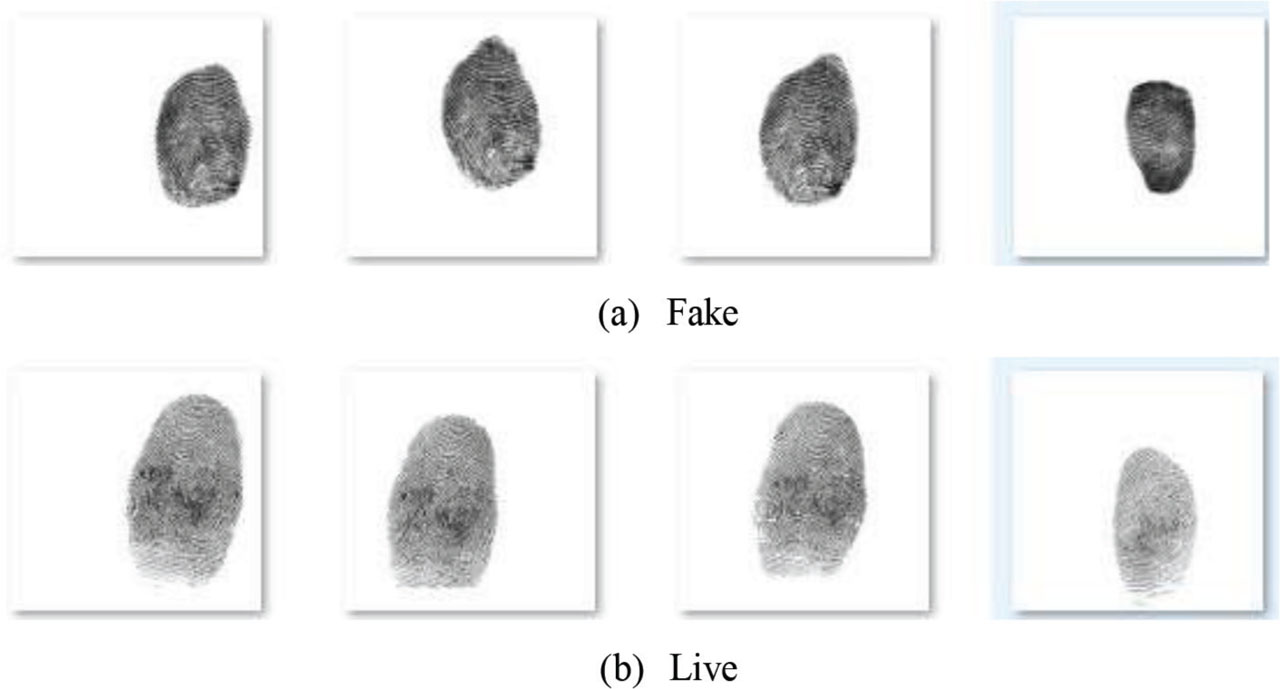
Figure 2:
Sample fingerprints of Clarkson2015 dataset2.
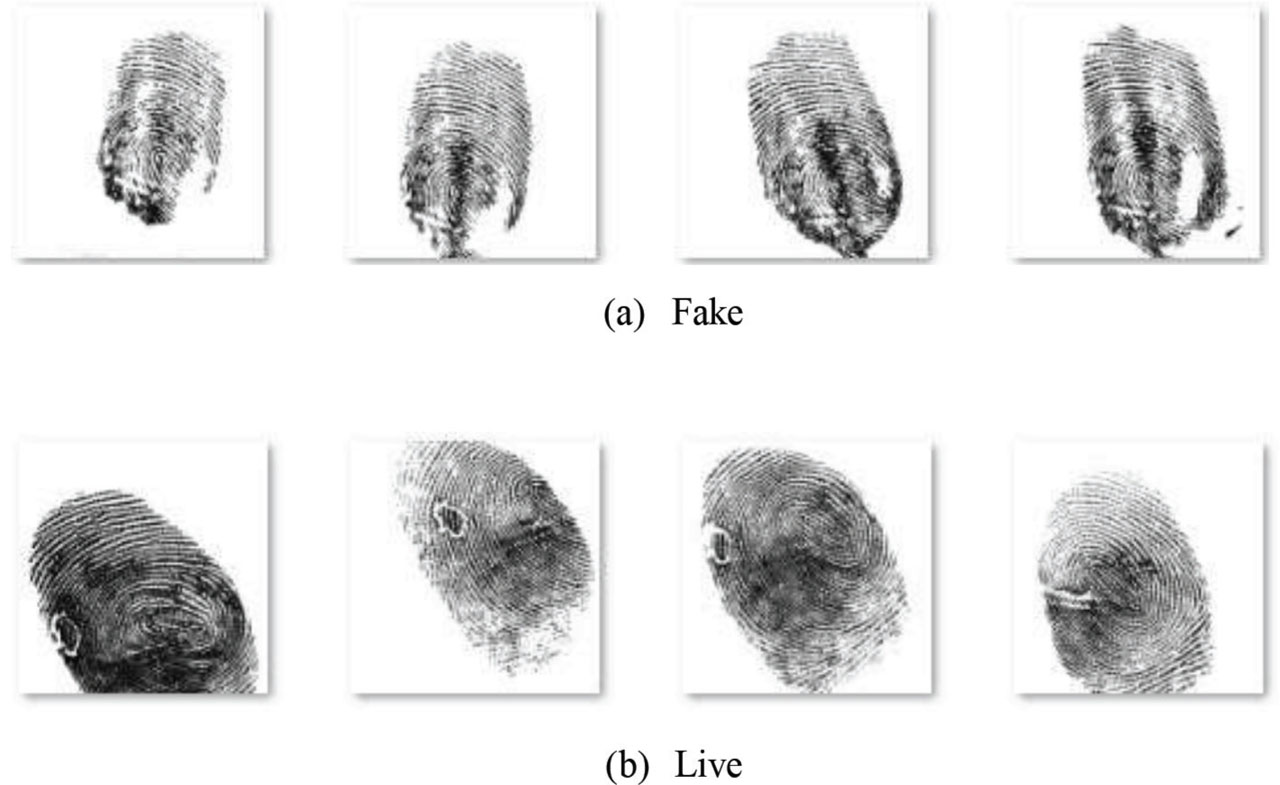
Figure 3:
Sample fingerprints of Clarkson2015 dataset3.
One notable aspect of this dataset is its inclusion of a wide variety of fake fingerprints, which differ not only in molding techniques but also in the materials used. These molds are categorized into three groups: Digital_Persona Liquid_Ecoflex, CrossMatch Body_Double, and High_Scan Latex.
The dataset includes 14,892 live fingerprint samples and 21,700 spoofed samples, collected from 450 subjects. Among these, 33 subjects provided only live fingerprints, 208 contributed only spoofed fingerprints, and 209 subjects contributed both. The dataset is available upon request for those conducting comparative studies. With its well-balanced composition and self-collection approach, the LivDet2015 dataset ensures data integrity, making it particularly useful for tasks like image classification, where the goal is to distinguish between real and fake fingerprints. It remains a valuable resource for research in image analysis, biometric authentication, and security, helping drive the development of more reliable and secure biometric systems.
IV. Proposed Method
The hard voting method ensemble three different classifiers: RF Classifier, XGBoost Classifier, and CatBoost Classifier.
Method Description: The hard voting ensemble classifier combines predictions from RF, XGBoost, and CatBoost classifiers. It trains each model independently, averages their predictions, evaluates the performance using various metrics like accuracy, ROC curve, precision-recall curve, and visualizes the results. The ensemble method leverages the strengths of each individual model to potentially improve overall predictive performance. In RF, feature importance is determined by evaluating how much each feature contributes to the model’s decision-making process. The step by step working of the hard voting ensemble model is given in Figure 4 and technical details are given in Figures 6, 7, 8, 9, 10, and 12–14.
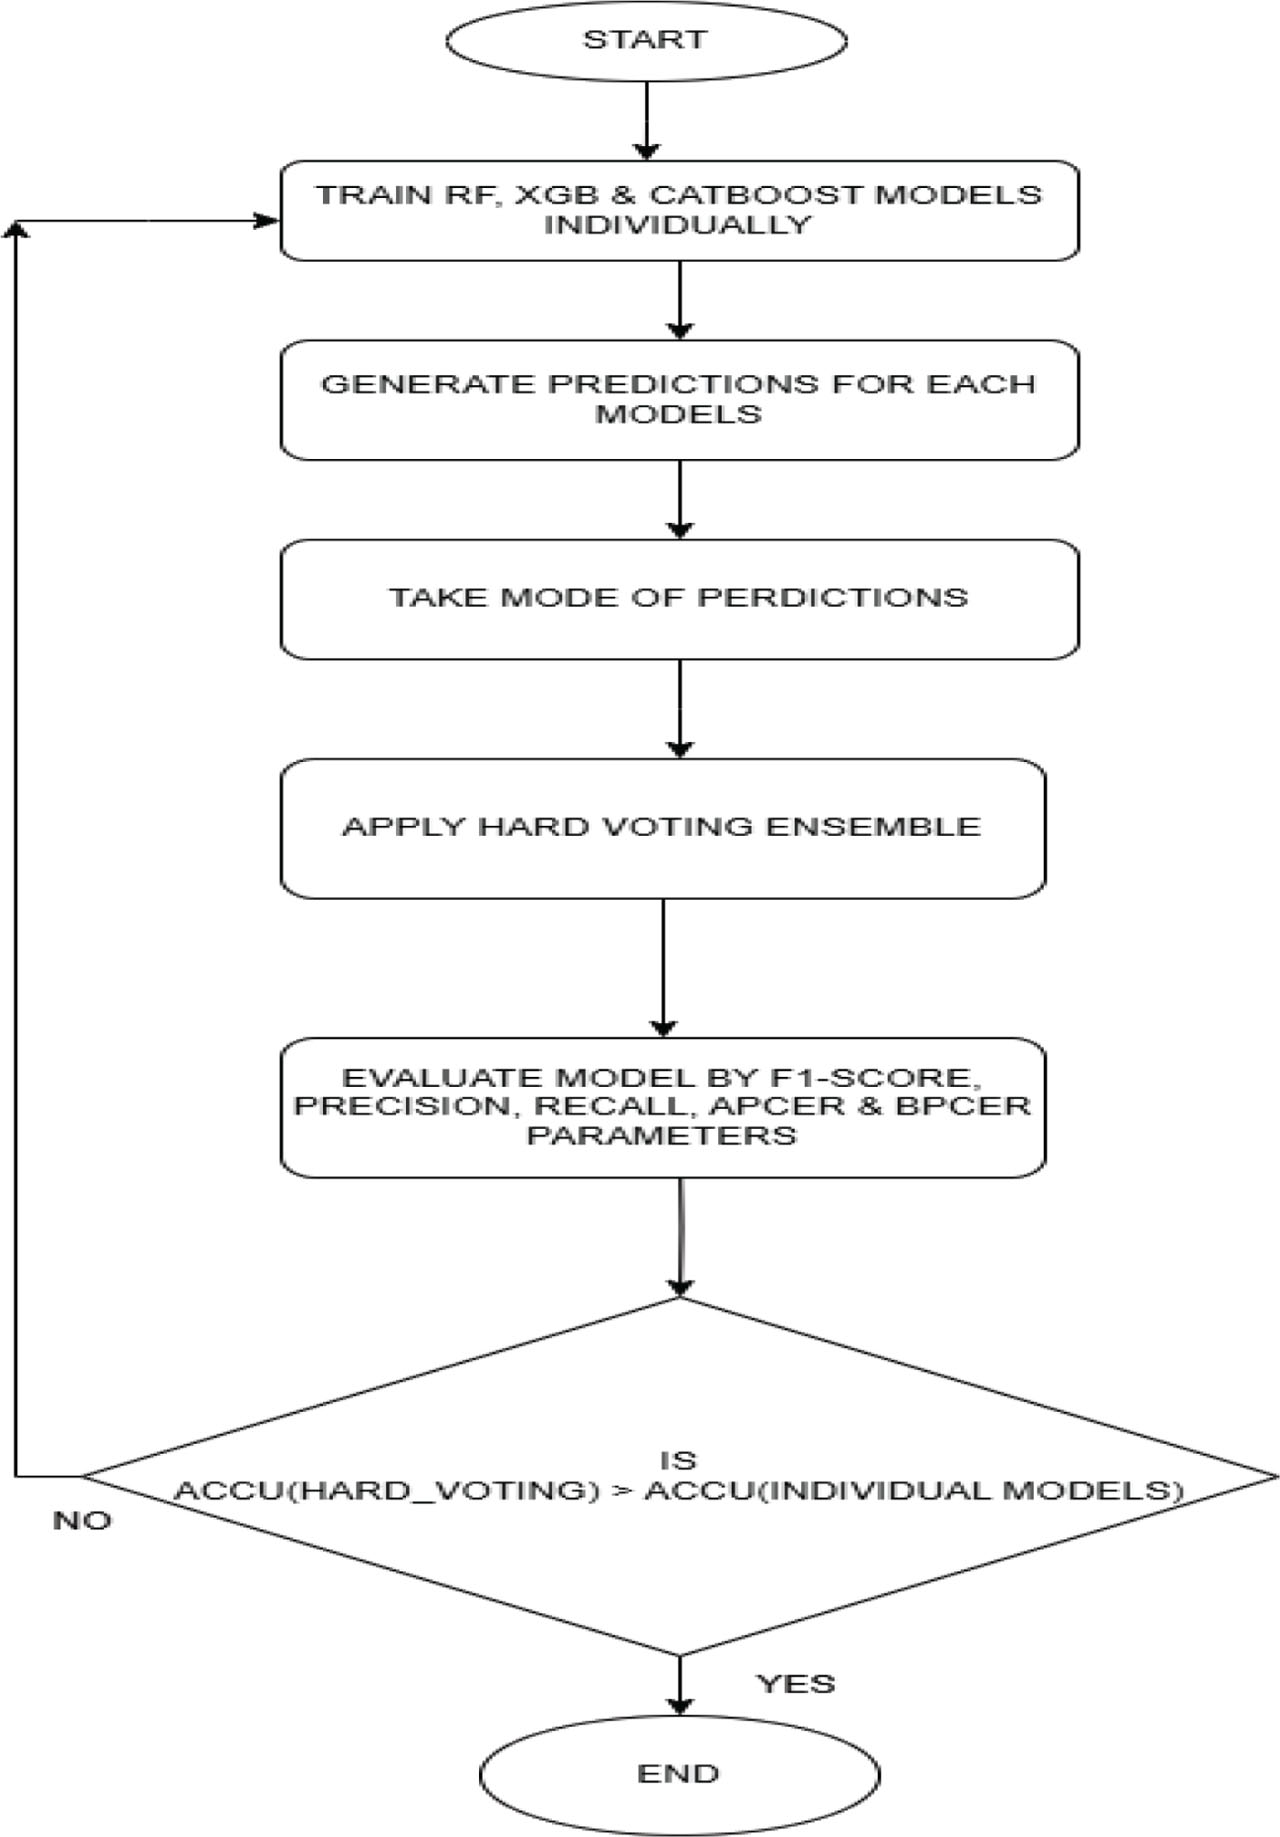
Figure 4:
Workflow of proposed method.
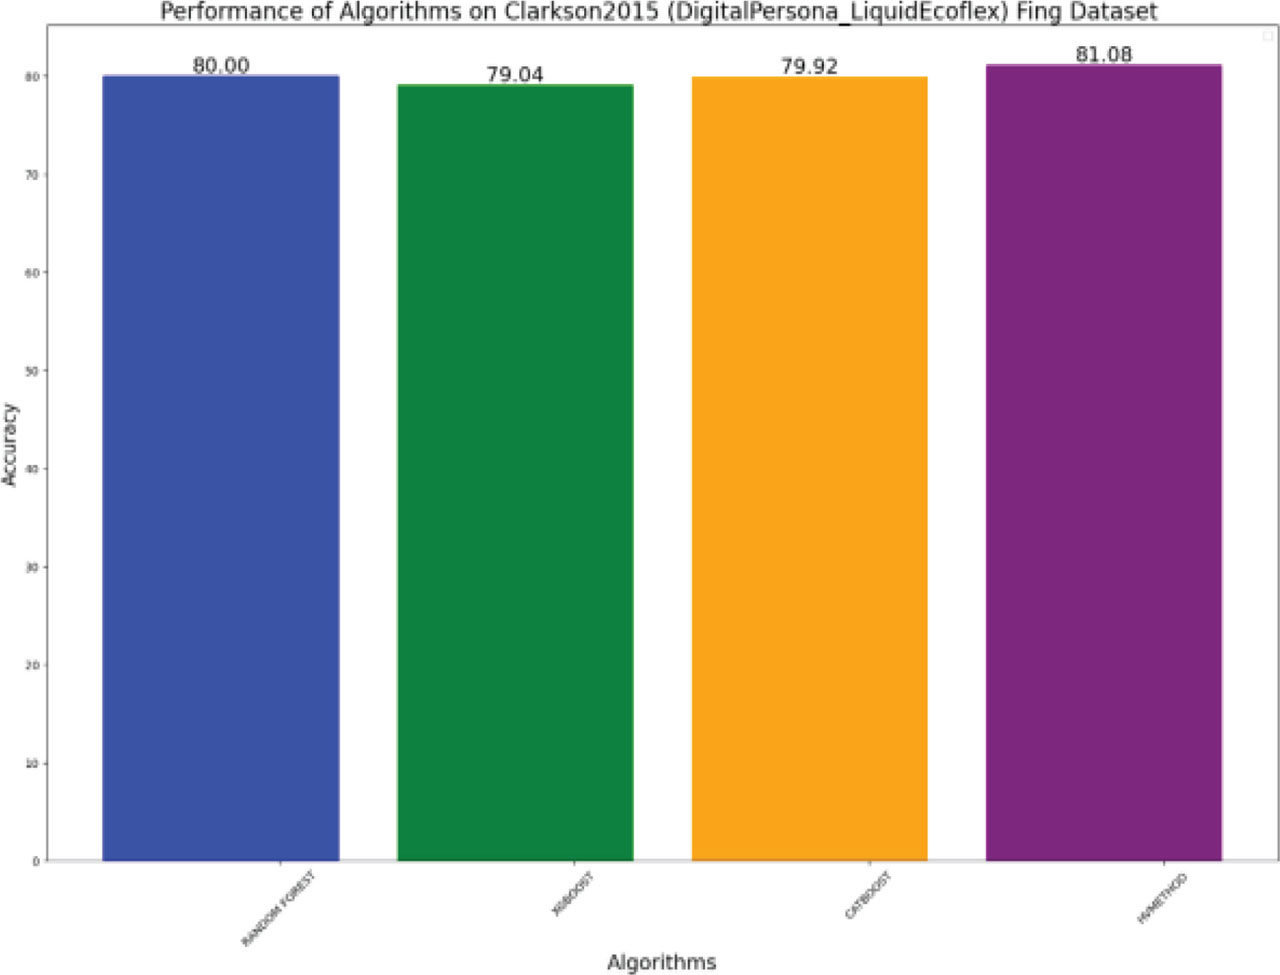
Figure 5:
Performance of the models on Clarkson LivDet2015 Dataset1.
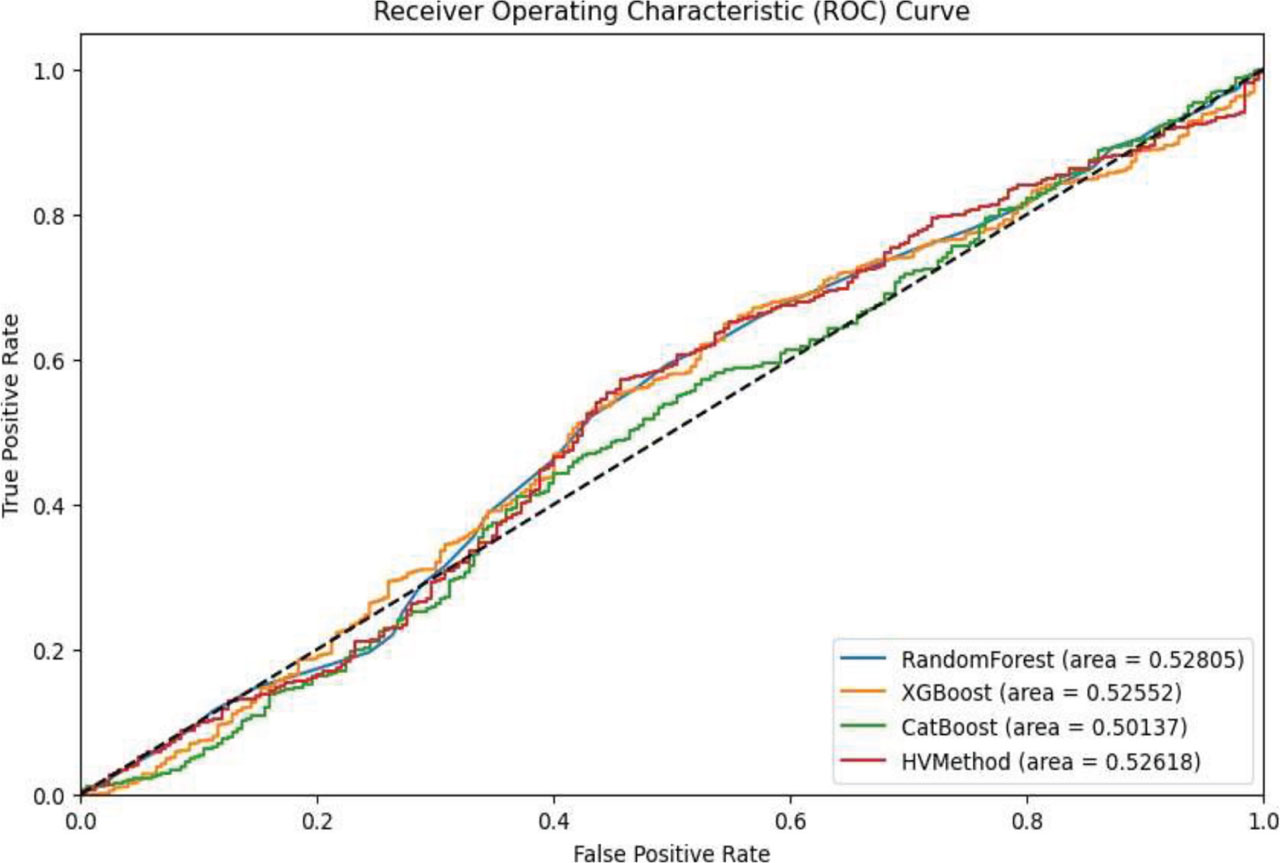
Figure 6:
ROC curve for Clarkson LivDet2015 Dataset1.
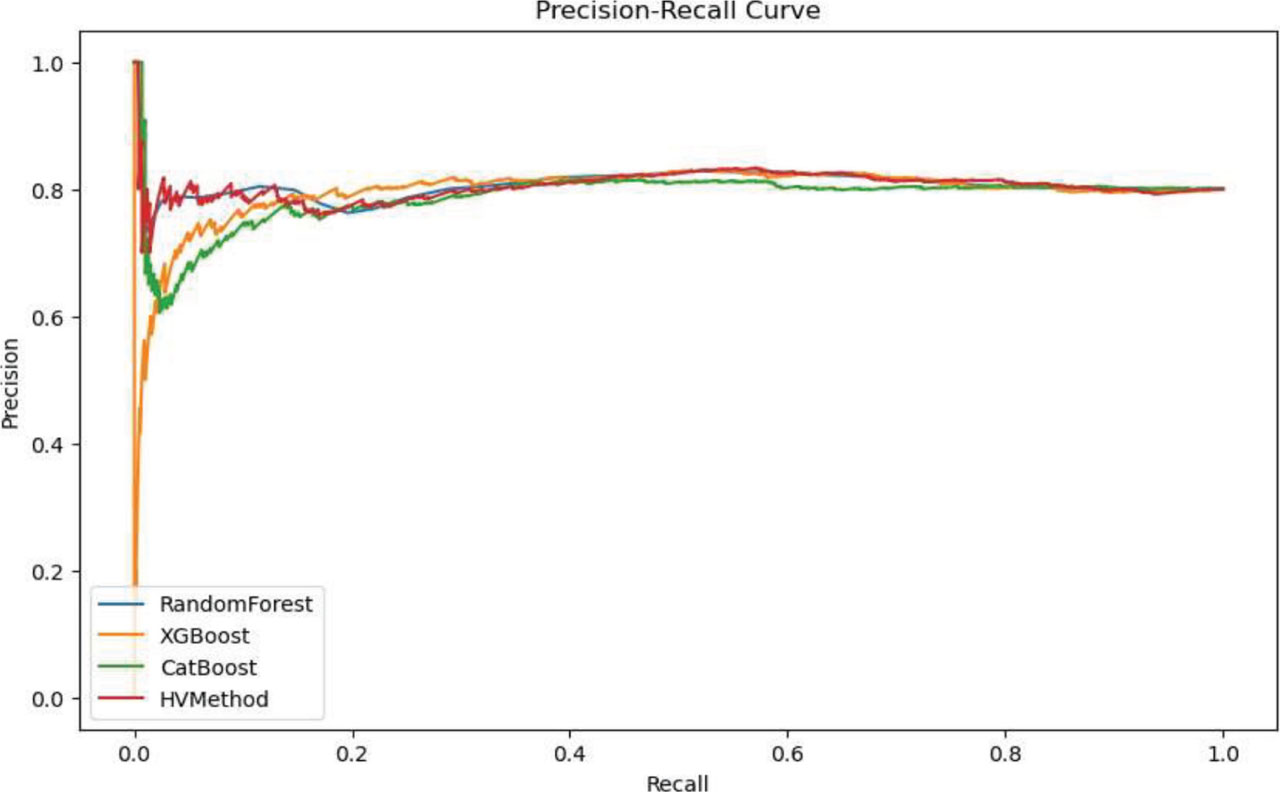
Figure 7:
Precision–Recall curve for Clarkson LivDet2015 Dataset1.
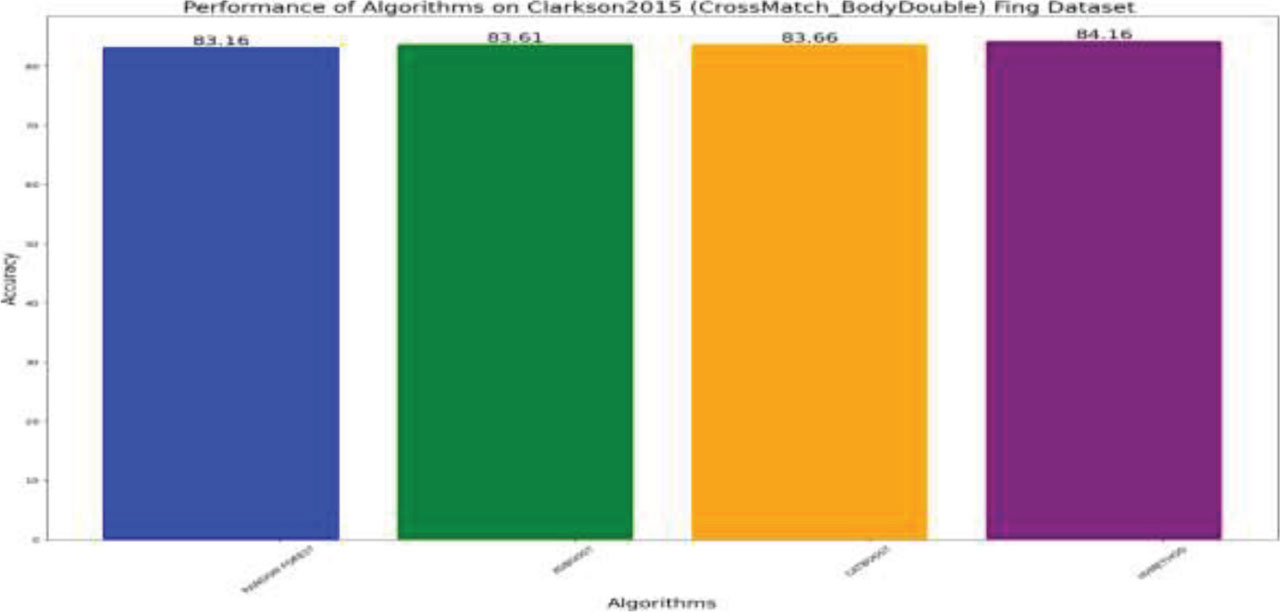
Figure 8:
Performance of the models on Clarkson LivDet2015 fingerprint Dataset2.
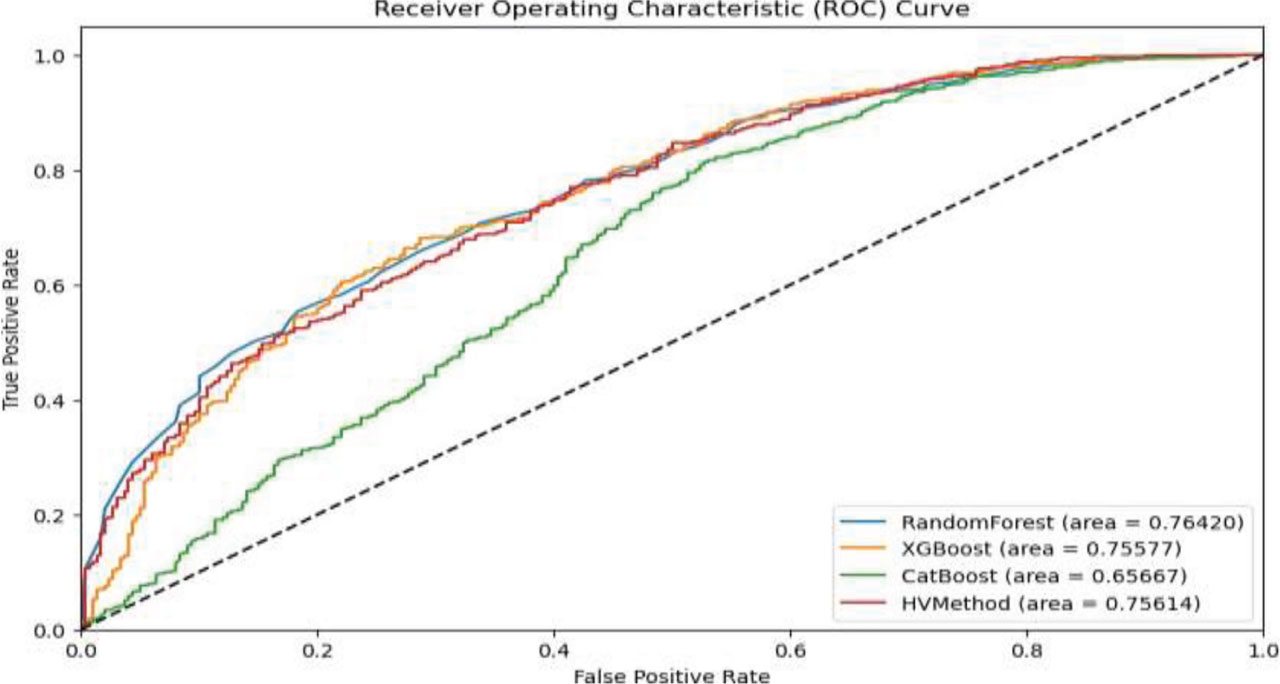
Figure 9:
ROC curve for Clarkson LivDet2015 fingerprint Dataset2.
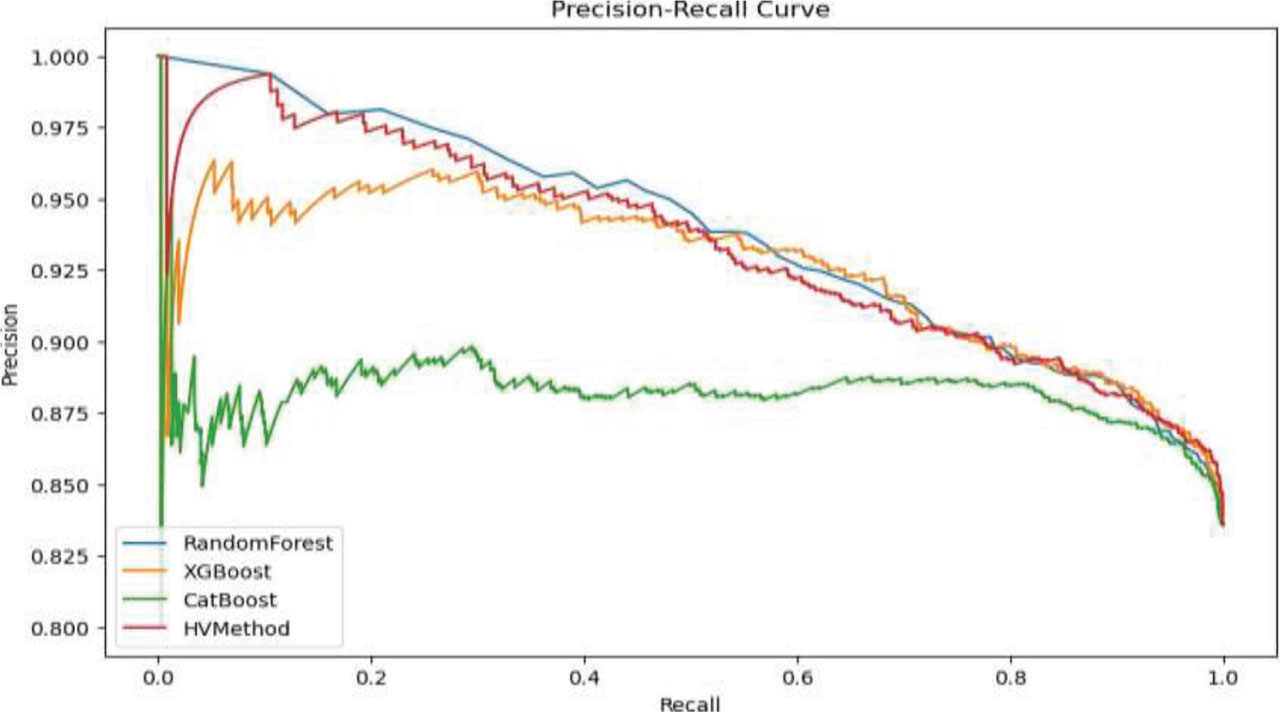
Figure 10:
Precision–Recall curve for Clarkson LivDet2015 fingerprint Dataset2.
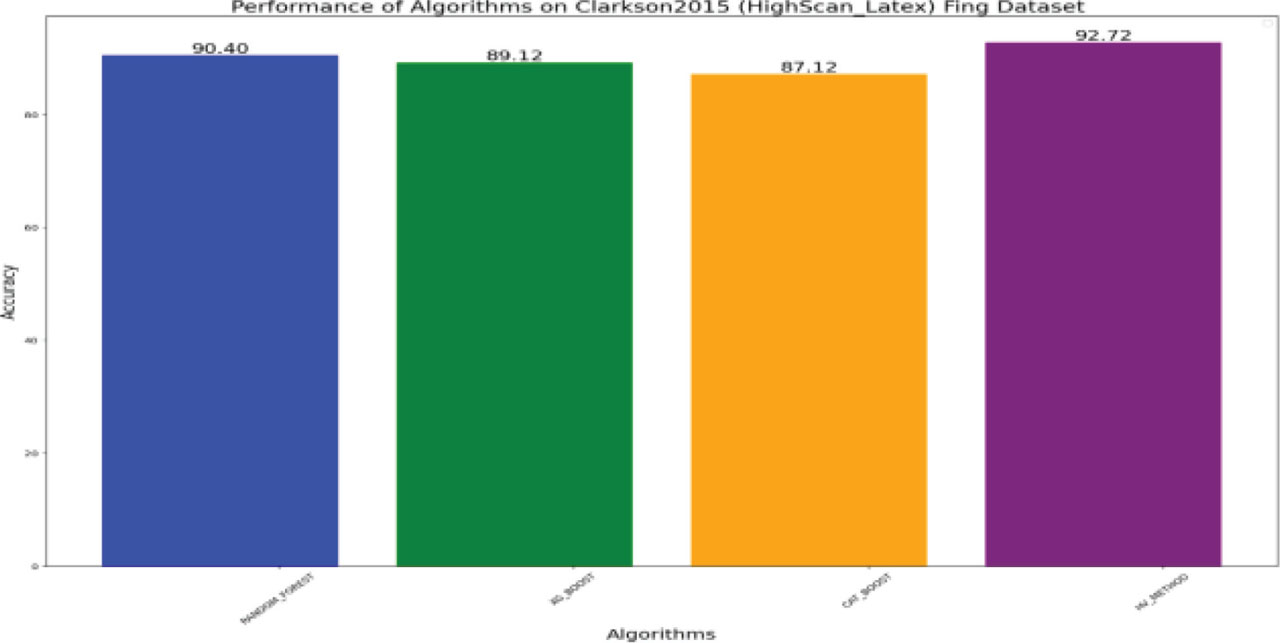
Figure 11:
Performance of the models on Clarkson LivDet2015 fingerprint Dataset3.
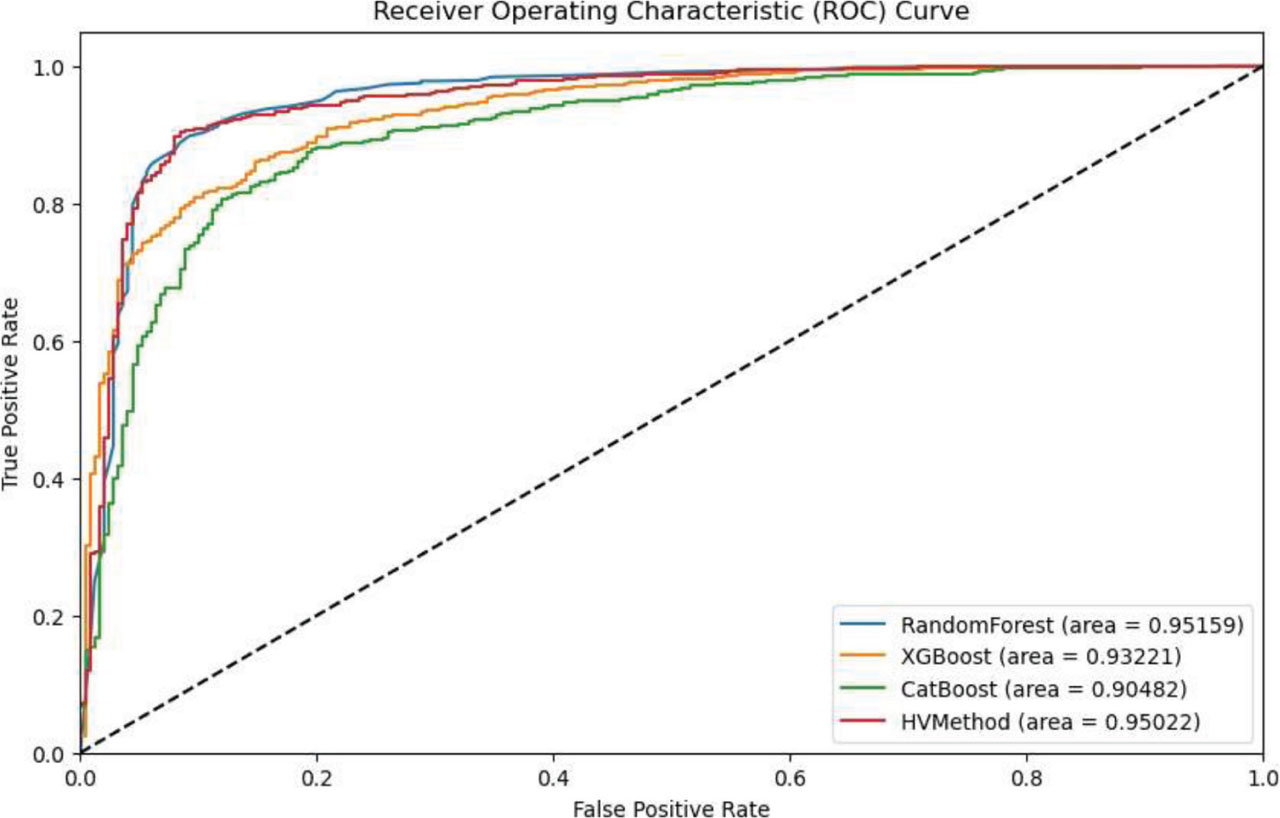
Figure 12:
ROC curve for Clarkson LivDet2015 fingerprint Dataset3.
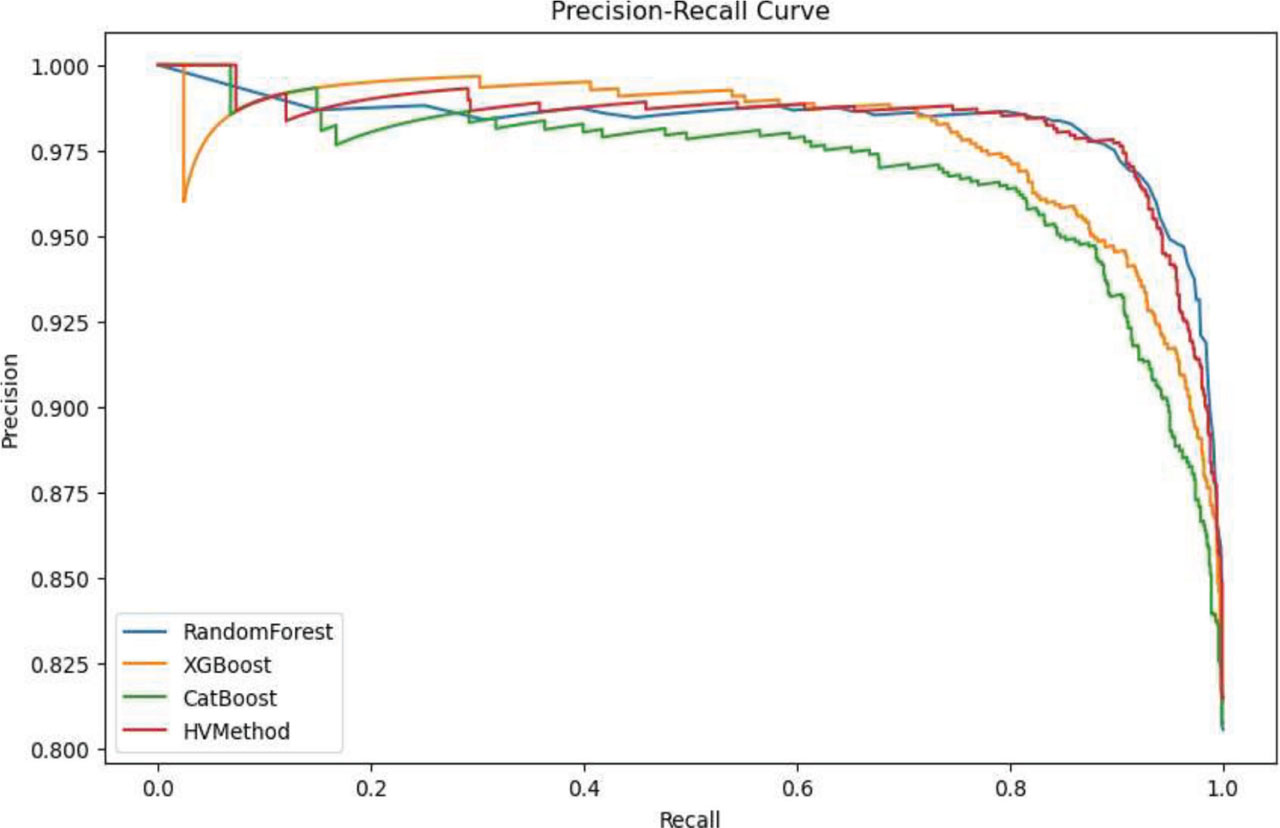
Figure 13:
Precision–Recall curve for Clarkson LivDet2015 fingerprint Dataset3.
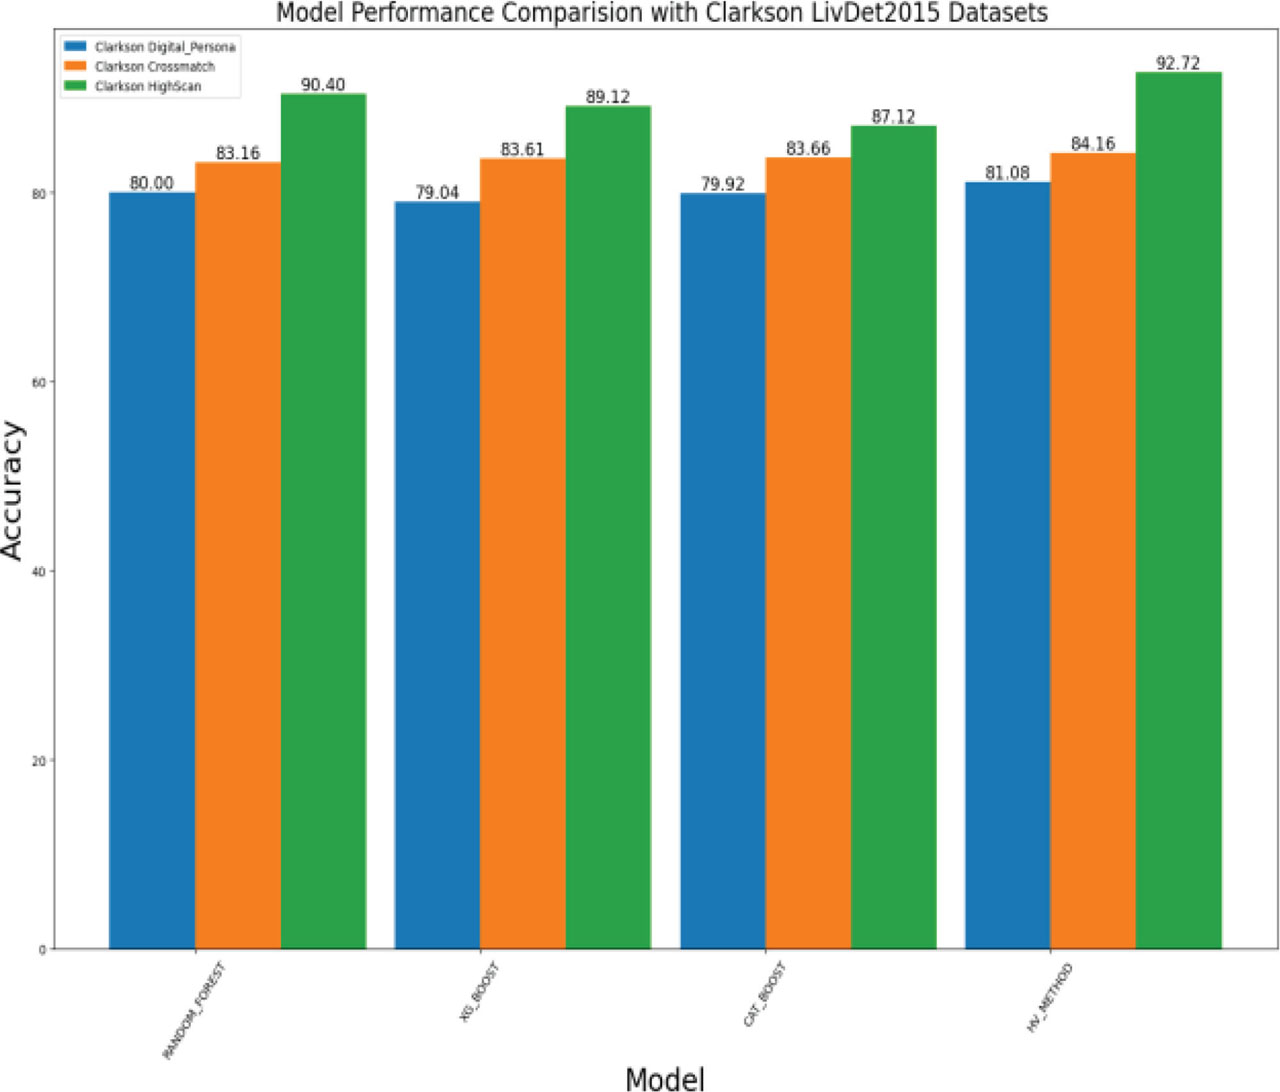
Figure 14:
Performance comparison of models with the datasets.
Algorithm Steps
Model Training: Each model is trained independently on the same training dataset (xtrain, ytrain). Random Forest Classifier: RF model ← Train(RandomForestClassifier, xtrain, ytrain)
XGBoost Classifier: XGB model ← Train (XGBClassifier, xtrain, ytrain)
CatBoost Classifier: CatBoost model ← Train (CatBoostClassifier, xtrain, ytrain, params)
Prediction Generation: Each model generates predictions for the testing dataset Xtest.
Random Forest: ŷRF = RF_model.predict(Xtest)
XGBoost: ŷXGB = XGB_model.predict(Xtest)
CatBoost: ŷCatBoost = CatBoost_model.predict(Xtest)
Hard Voting Ensemble: Hard voting involves taking the mode of the predictions from each classifier.
For each sample i in the testing dataset, the ensemble prediction ŷi is determined by:
Mathematically, the ensemble prediction for each sample is:
where 1(.) The indicator function equals 1 if the condition is true, and 0 if it is false.Model Evaluation: Accuracy is calculated for each individual model and the ensemble model on both training and testing datasets. Accuracy is defined as:
ROC and Precision-Recall Curves:
(i) ROC Curve: This plots the True Positive Rate (TPR) versus the False Positive Rate (FPR) across different threshold values
(ii) Precision-Recall Curve: This plots Precision versus Recall for different threshold values
Confusion Matrix: The confusion matrix for the ensemble model is calculated to assess its performance. It is a table that provides a summary of the classification algorithm’s results. The confusion matrix is represented as:
where: TP means true positive, FP means false positives, FN means false negative and TN is true negative.
Soft voting relies on well-calibrated probability estimates. If individual classifiers tend to overestimate or underestimate probabilities, soft voting may be misleading. Hard voting is robust in such cases as it only considers the final class decision as shown in Figure 5. If individual models have very different probability outputs, soft voting might over-emphasize uncertain models that produce misleading probability distributions. Hard voting remains stable since it focuses on majority class agreement, avoiding over-reliance on any single model’s uncertainty.
Table 1:
Performance on Clarkson LivDet2015 fingerprint Dataset1
| Model/parameters | F1-Score | Precision | Recall | BPCER | APCER | Accuracy |
|---|---|---|---|---|---|---|
| RF | 0.88879 | 0.79903 | 0.98600 | 0.99600 | 0.00100 | 0.80000 |
| XGBOOST | 0.88272 | 0.79903 | 0.98600 | 0.99200 | 0.01400 | 0.79040 |
| CATBOOST | 0.88830 | 0.80032 | 0.99800 | 0.99600 | 0.00200 | 0.79920 |
| HV Method | 0.88928 | 0.80064 | 1.00000 | 0.99600 | 0.00000 | 0.81080 |
V. Result Analysis
Since accuracy is the key performance parameter, F1-score, precision, and recall are also used to highlight the ability of the proposed method. Besides this, the ROC curve better represents the trade-off between classification of real and fake images.
The performance of the proposed technique was assessed using the Clarkson LivDet2015 fingerprint datasets, which consists of three distinct datasets: DigitalPersona_LiquidEcoflex (Fingdataset1), Crossmatch_Bodydouble (Fingdataset2), and Highscan_Latex (Fingdataset3). Each model was rigorously tested to assess its ability to classify these datasets accurately. The primary evaluation metric was accuracy, defined as the proportion of correctly classified instances, along with additional measures such as F1-score, precision, and recall.
Our results revealed notable variations in accuracy across the three datasets. For the LivDet2015 dataset3 (Highscan_Latex), our method achieved the highest accuracy of 92.72%. On dataset2 (Crossmatch_Bodydouble), the method demonstrated strong consistency, with an accuracy of 81.08%. Similarly, dataset1 (DigitalPersona_LiquidEcoflex) yielded an accuracy of 84.16%.
In order to simulate real-world conditions, we compared the method using template fingerprints from live sources, while the probe fingerprints included both live and spoofed samples. Traditional fingerprint recognition systems tend to perform well in rejecting live impostor fingerprints but often struggle with identifying spoofed fingerprints, revealing vulnerabilities in current systems. The high accuracy of our method emphasizes its ability to effectively classify these datasets, demonstrating its potential for practical deployment, where precise classification is essential. The consistent performance across these diverse datasets highlights the robustness and reliability of our method, making it a valuable tool for data-driven applications requiring high accuracy. A side-by-side comparison of accuracies for these three datasets, as illustrated in Figure 14, underscores the potential of ML to enhance the security and reliability of fingerprint recognition systems. Further research into advanced techniques could improve the robustness and accuracy of anti-spoofing solutions, leading to more secure biometric authentication systems.
Table 2:
Model performance on Clarkson LivDet2015 fingerprint Dataset2
| Model/parameters | F1-Score | Precision | Recall | BPCER | APCER | Accuracy |
|---|---|---|---|---|---|---|
| RF | 0.90298 | 0.86876 | 0.94000 | 0.71000 | 0.06000 | 0.83167 |
| XGBOOST | 0.90542 | 0.87214 | 0.94133 | 0.69000 | 0.05867 | 0.83611 |
| CATBOOST | 0.90684 | 0.86413 | 0.95400 | 0.75000 | 0.04600 | 0.83667 |
| HV Method | 0.90967 | 0.86707 | 0.95667 | 0.73333 | 0.04333 | 0.84167 |
Table 3:
Model performance on Clarkson LivDet2015 fingerprint dataset3
| Model/parameters | F1-score | Precision | Recall | BPCER | APCER | Accuracy |
|---|---|---|---|---|---|---|
| RF | 0.94203 | 0.91121 | 0.97500 | 0.38000 | 0.02500 | 0.90400 |
| XGBOOST | 0.93417 | 0.90525 | 0.96500 | 0.40400 | 0.03500 | 0.89120 |
| CATBOOST | 0.92366 | 0.87827 | 0.97400 | 0.54000 | 0.02600 | 0.87120 |
| HV Method | 0.95488 | 0.94690 | 0.96300 | 0.21600 | 0.03700 | 0.92720 |
VI. Conclusion
The proposed method consistently demonstrated low error rates across all three datasets, outperforming current state-of-the-art techniques. The leveraged hard voting method (LHVM) we developed is fully software-based, providing computational efficiency, speed, and flexibility for future enhancements. This makes it particularly well-suited for real-time applications. Our results significantly exceed those of existing methods, underscoring the effectiveness of our approach. A crucial aspect of our method is the dynamic score-level integration module, which aggregates the outputs from the three individual classifiers. We performed experiments using three databases from the Clarkson Liveness Detection competition 2015, providing a comprehensive comparison with the latest methods, including the winners of the LivDet 2011 and 2013 fingerprint liveness detection competitions. Our method achieved accuracies of 81.08%, 84.16%, and 92.72% on the Clarkson LivDet2015 Digital_Persona, CrossMatch, and HighScan fingerprint datasets, respectively. Enhancing the robustness and generalization of PAD methods is essential for strengthening the security of fingerprint recognition systems. We validated the effectiveness of our approach through experiments on the Clarkson LivDet2015 fingerprint dataset, one of the latest publicly available datasets. Additional validation was performed by comparing our method with top PAD techniques in cross-material and cross-sensor settings, showcasing its superior performance.