
Table 1:
Meta-analysis summary of methodology and outcomes from recent literature
| Method [Ref] | Algorithm | Methodology | Outcomes |
|---|---|---|---|
| [11] | Traditional Segmentation | Preprocessing, segmentation, feature extraction, and dataset exploration | Identifies challenges and provides insights into DR lesion detection |
| [12] | DRL | Identifies DR lesions through reinforcement learning and minimizing false positives | Achieves >95% performance in sensitivity, accuracy, F1, precision, and specificity |
| [13] | MobileNet V2 | Feature extraction from retinal images and classification using DL model | Achieves 92.42% classification accuracy |
| [14] | ColonSegNet | Modified segmentation model for retinal vessel segmentation with data augmentation | High sensitivity (0.839), specificity (0.979), and accuracy (0.966) |
| [15] | DL | Automated framework for diagnosing eye diseases using deep neural networks | Demonstrates effectiveness in disease detection |
| [16] | SE-ResCA-GTNet | Transformer-based architecture with attention mechanisms for DR classification | Accuracy (99.8%), recall (99.4%), and F1-score (99.3%) |
| [18] | U-Net with GSCA | GSCA enabled lesion segmentation with a deep CNN | Enhanced segmentation accuracy with optimized hyperparameters, as described in Appendix B. |
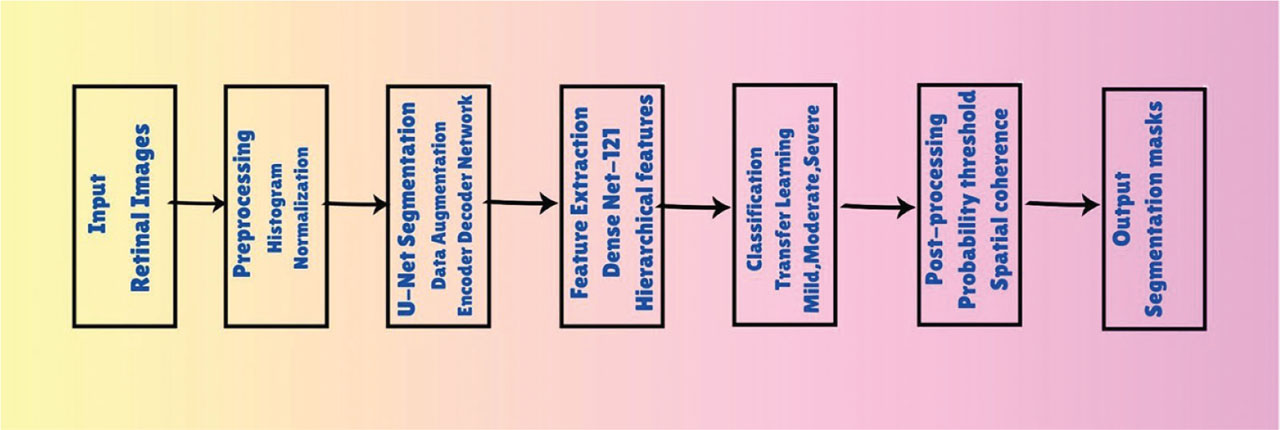
Figure 1:
Workflow of the proposed U-Net–DenseNet-based DR exudate analysis system. DR, diabetes retinopathy.
Table 2:
Experimental setup and parameters
| Parameter | Value | Description |
|---|---|---|
| Dataset | DRIVE, STARE, DIARETDB1, and IDRiD | Retinal fundus image datasets for training and evaluation |
| Image resolution | 512 × 512 | Resized the resolution of the input images |
| Segmentation model | U-Net | CNN-based architecture for pixel-wise segmentation |
| Classification model | DenseNet (transfer learning) | Pretrained DenseNet for exudate classification |
| Batch size | 16 | Number of images per training iteration |
| Optimizer | Adam | Adaptive moment estimation optimizer |
| Learning rate | 0.0001 | Initial learning rate for optimization |
| Epochs | 50 | Number of training iterations |
| Data augmentation | Rotation, zoom, and flipping | Techniques to increase training data diversity |
| Confidence threshold | 0.7 | Probability threshold for classification |
| Morphological kernels | k1 = 3, k2 = 5 | Kernel sizes for erosion and dilation |
| Minimum region size | 50 pixels | Minimum area for valid exudate regions |
Table 3:
U-Net segmentation architecture configuration
| Layer name | Filters | Kernel size | Output size |
|---|---|---|---|
| Input Layer | – | – | 512 × 512 × 3 |
| Conv1_1 | 64 | 3 × 3 | 512 × 512 × 64 |
| Conv1_2 | 64 | 3 × 3 | 512 × 512 × 64 |
| MaxPool1 | – | 2 × 2 | 256 × 256 × 64 |
| Conv2_1 | 128 | 3 × 3 | 256 × 256 × 128 |
| Conv2_2 | 128 | 3 × 3 | 256 × 256 × 128 |
| MaxPool2 | – | 2 × 2 | 128 × 128 × 128 |
| Conv3_1 | 256 | 3 × 3 | 128 × 128 × 256 |
| Conv3_2 | 256 | 3 × 3 | 128 × 128 × 256 |
| MaxPool3 | – | 2 × 2 | 64 × 64 × 256 |
| Conv4_1 | 512 | 3 × 3 | 64 × 64 × 512 |
| Conv4_2 | 512 | 3 × 3 | 64 × 64 × 512 |
| Bottleneck | 1024 | 3 × 3 | 32 × 32 × 1024 |
| UpConv4 | 512 | 2 × 2 | 64 × 64 × 512 |
| UpConv3 | 256 | 2 × 2 | 128 × 128 × 256 |
| Output Conv | 1 | 1 × 1 | 512 × 512 × 1 |
Table 4:
DC comparison over 50 epochs
Table 5:
Accuracy comparison over 50 epochs
| Epochs | Proposed | DRL [12] | MobileNet V2 [13] | U-Net GSCA [18] | SE-ResCA-GTNet [16] |
|---|---|---|---|---|---|
| 10 | 0.81 | 0.73 | 0.75 | 0.78 | 0.79 |
| 20 | 0.85 | 0.77 | 0.78 | 0.81 | 0.82 |
| 30 | 0.88 | 0.80 | 0.82 | 0.84 | 0.86 |
| 40 | 0.90 | 0.82 | 0.85 | 0.87 | 0.88 |
| 50 | 0.92 | 0.84 | 0.87 | 0.89 | 0.90 |
[ii] The proposed method consistently outperforms all comparative models across epochs, achieving the highest accuracy of 92% at 50 epochs, indicating superior learning capability and robustness. The steady improvement after epoch 30 highlights its effectiveness in leveraging enhanced data augmentation, transfer learning, and integrated segmentation–feature extraction for reliable clinical predictions.
Table 6:
Comprehensive performance comparison across train sets
| Metric | DRL [12] | MobileNet V2 [13] | U-Net GSCA [18] | SE-ResCA-GTNet [16] | Proposed |
|---|---|---|---|---|---|
| DC | 0.83/0.81/0.79 | 0.84/0.82/0.80 | 0.86/0.84/0.82 | 0.87/0.85/0.83 | 0.91/0.89/0.88 |
| Precision | 0.81/0.79/0.77 | 0.83/0.81/0.79 | 0.84/0.82/0.80 | 0.86/0.84/0.82 | 0.89/0.87/0.85 |
| Recall | 0.77/0.75/0.73 | 0.79/0.77/0.75 | 0.81/0.79/0.77 | 0.83/0.81/0.79 | 0.90/0.88/0.86 |
| Accuracy | 0.84/0.82/0.80 | 0.86/0.84/0.82 | 0.88/0.86/0.84 | 0.89/0.87/0.85 | 0.92/0.90/0.88 |
| Specificity | 0.85/0.83/0.81 | 0.87/0.85/0.83 | 0.89/0.87/0.85 | 0.90/0.88/0.86 | 0.94/0.92/0.90 |
| F1-score | 0.78/0.76/0.74 | 0.80/0.78/0.76 | 0.82/0.80/0.78 | 0.84/0.82/0.80 | 0.90/0.88/0.86 |
Table 7:
Computational cost comparison
| Metric | Proposed method | SE-ResCA-GTNet [16] |
|---|---|---|
| Training time (per epoch) | 3.5 min | 4.2 min |
| Total GPU memory used | 6.8 GB | 7.5 GB |
| Inference speed | 22 | 17 |
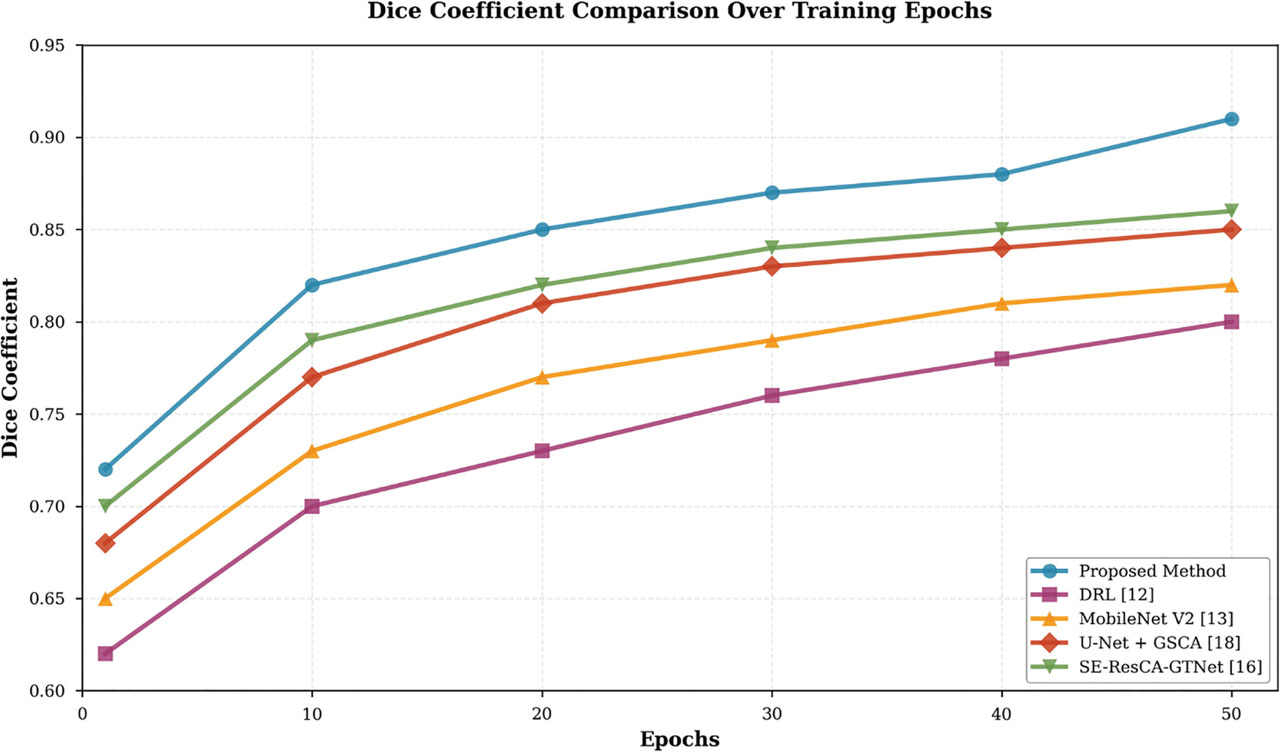
Figure 2:
DC comparison over training epochs. DC, dice coefficient; DRL, deep reinforcement learning; GSCA, Gannet Sine Cosine Algorithm.
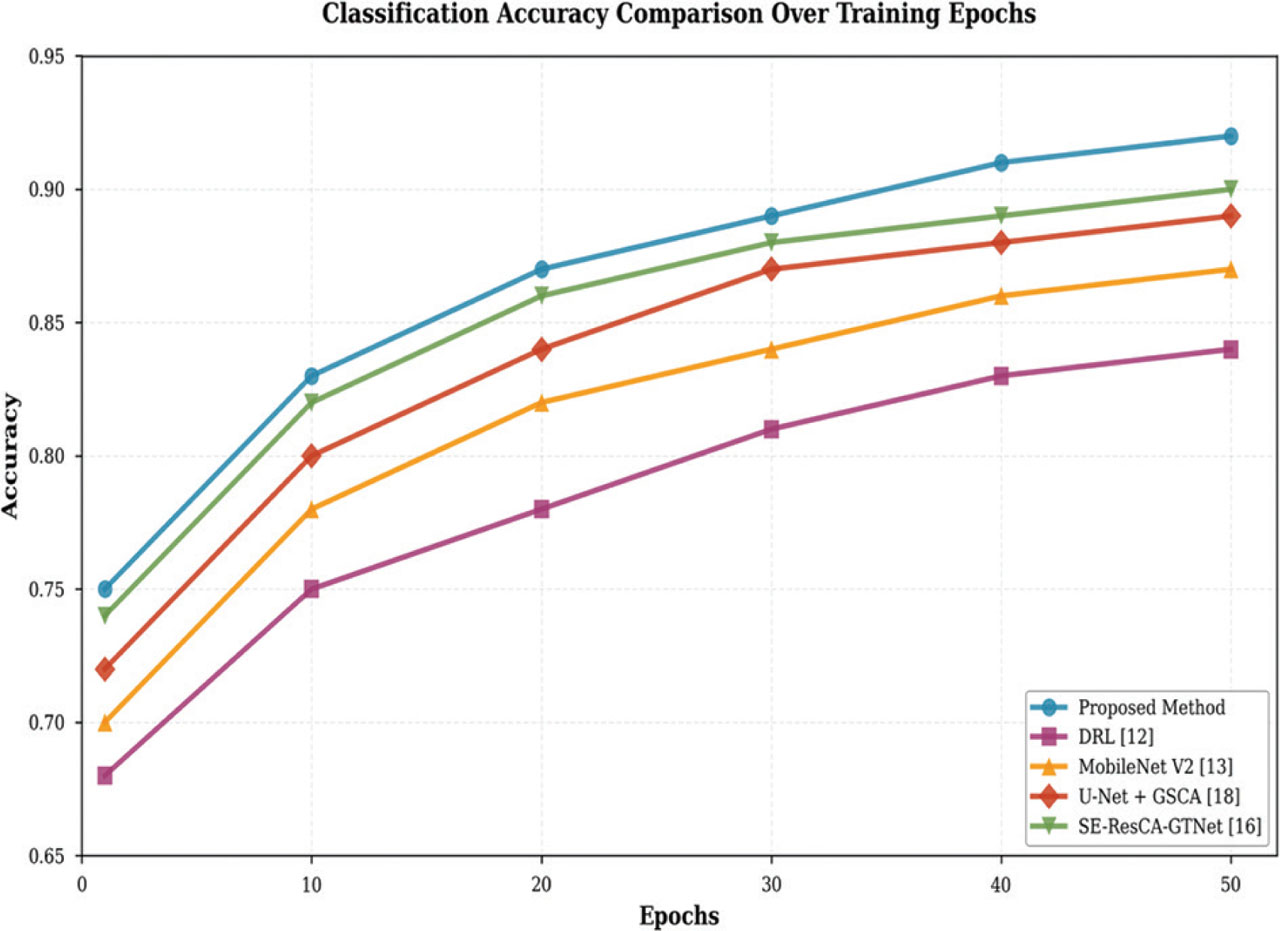
Figure 3:
Classification accuracy comparison over training epochs. DRL, deep reinforcement learning; GSCA, Gannet Sine Cosine Algorithm.
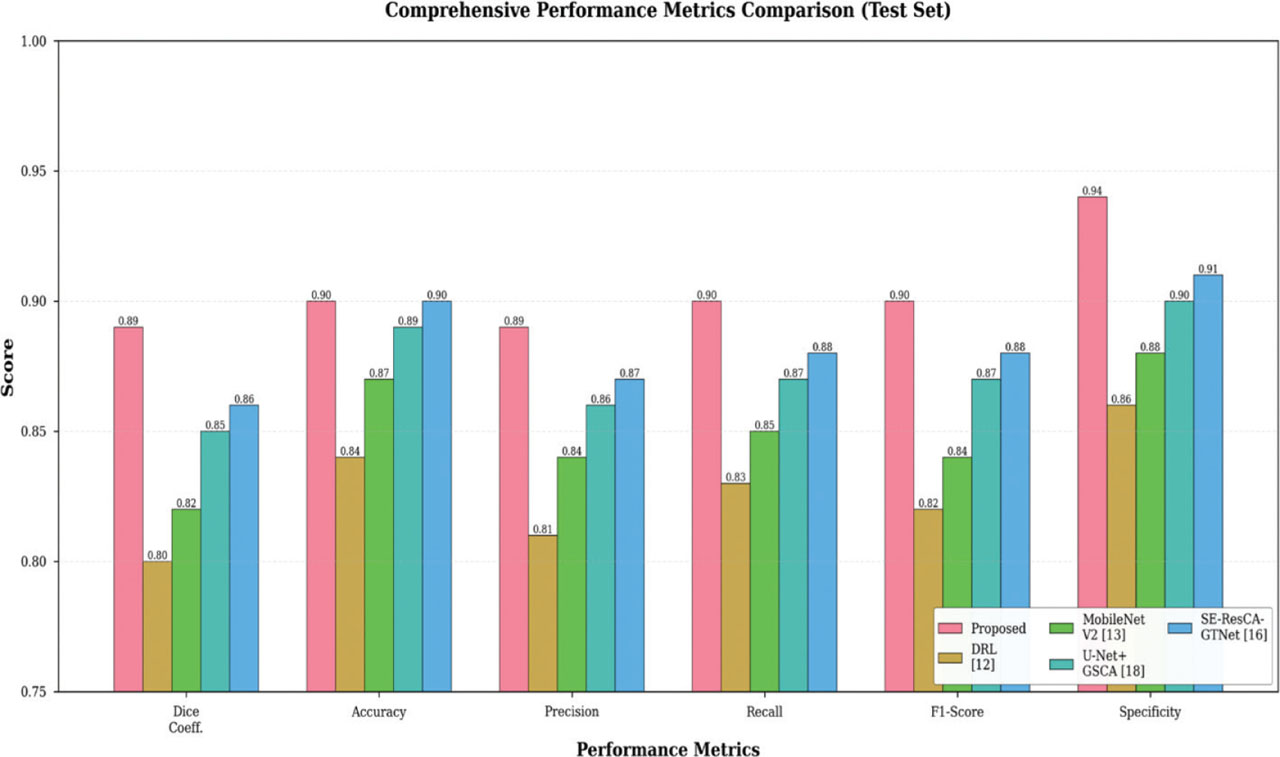
Figure 4:
Comprehensive performance metrics comparison (test set). DRL, deep reinforcement learning; GSCA, Gannet Sine Cosine Algorithm.
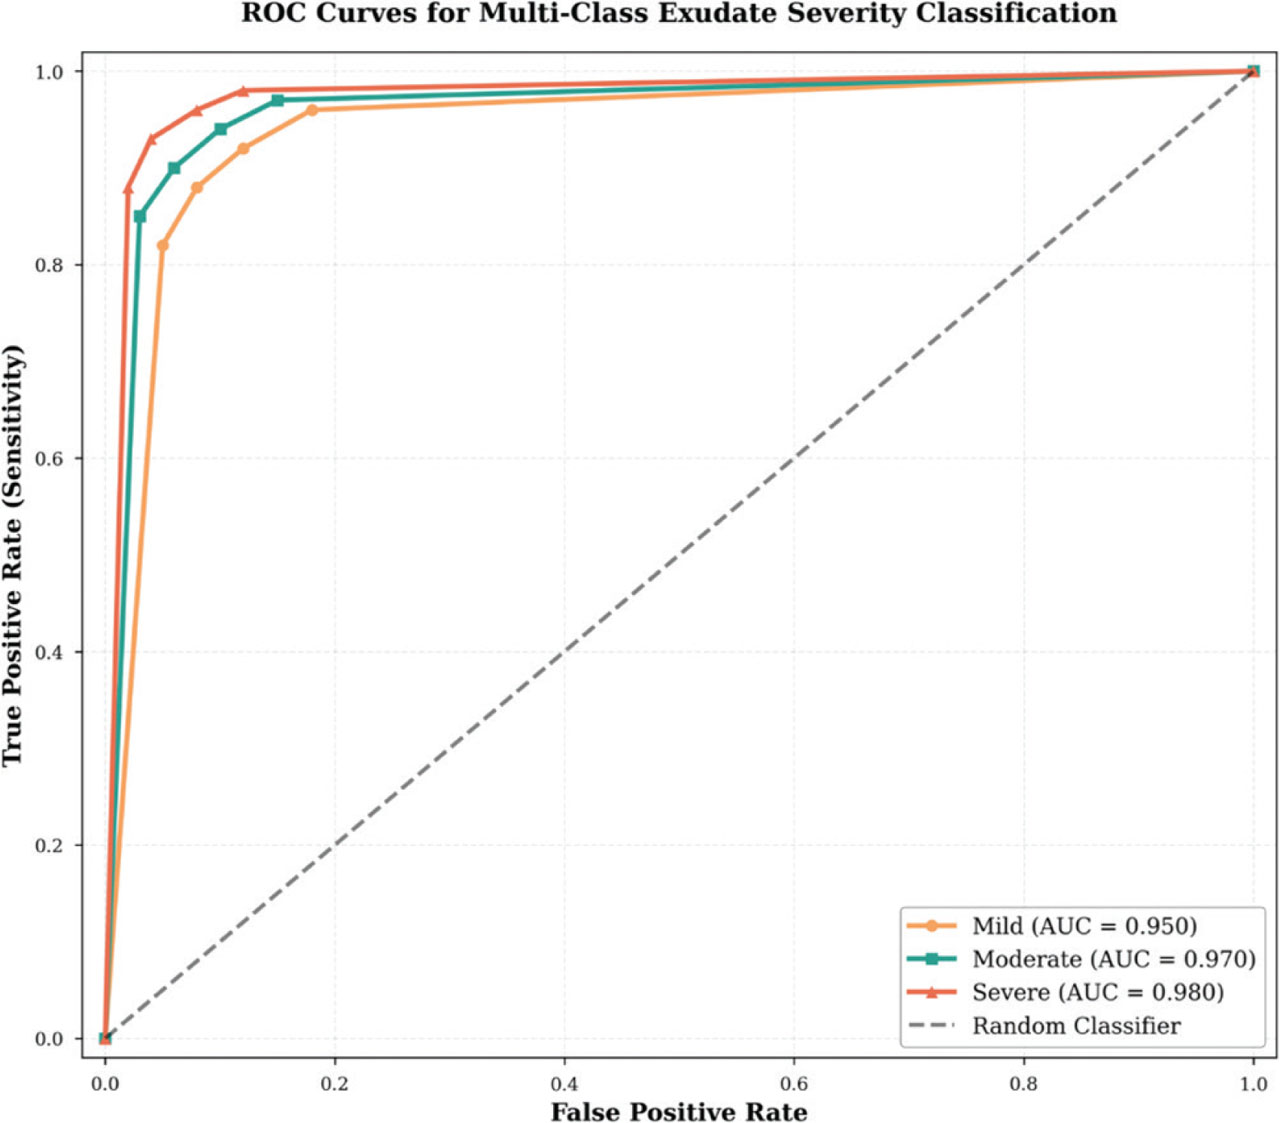
Figure 5:
ROC curves for multiclass exudate severity classification. AUC, area under the curve.
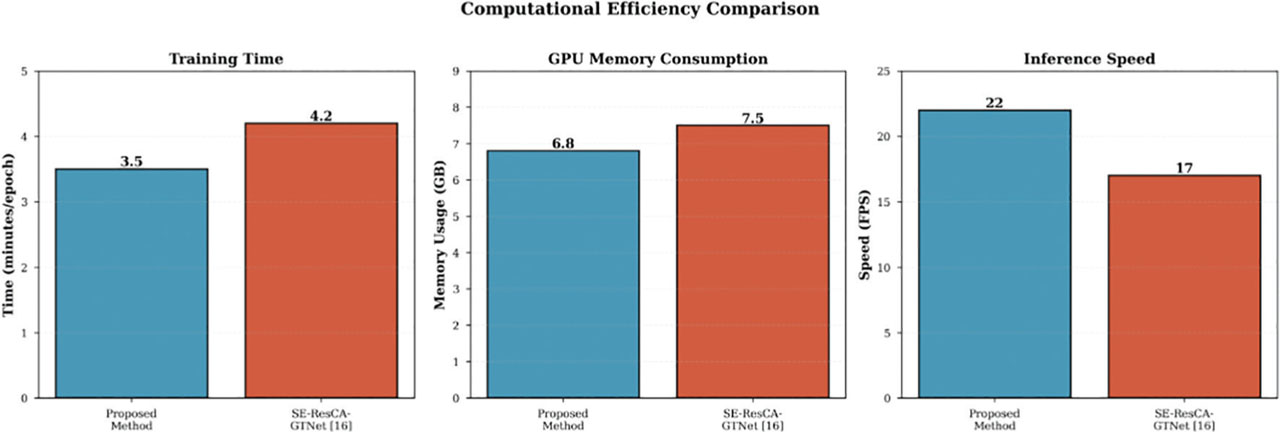
Figure 6:
Computational efficiency comparison.
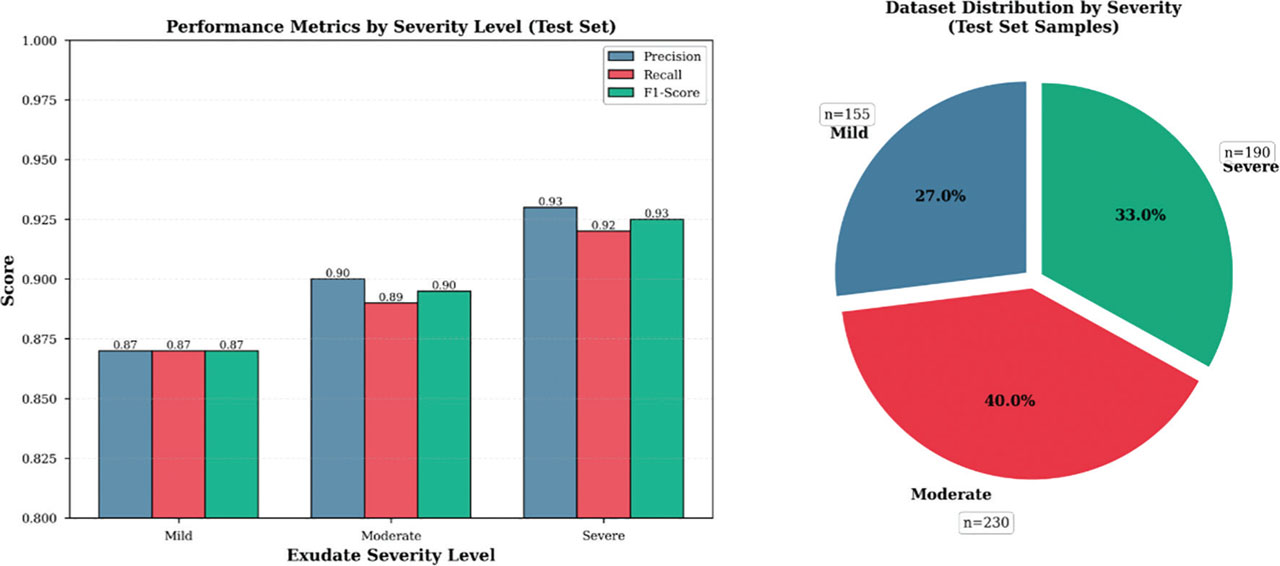
Figure 7:
Performance metrics by severity level (test set).
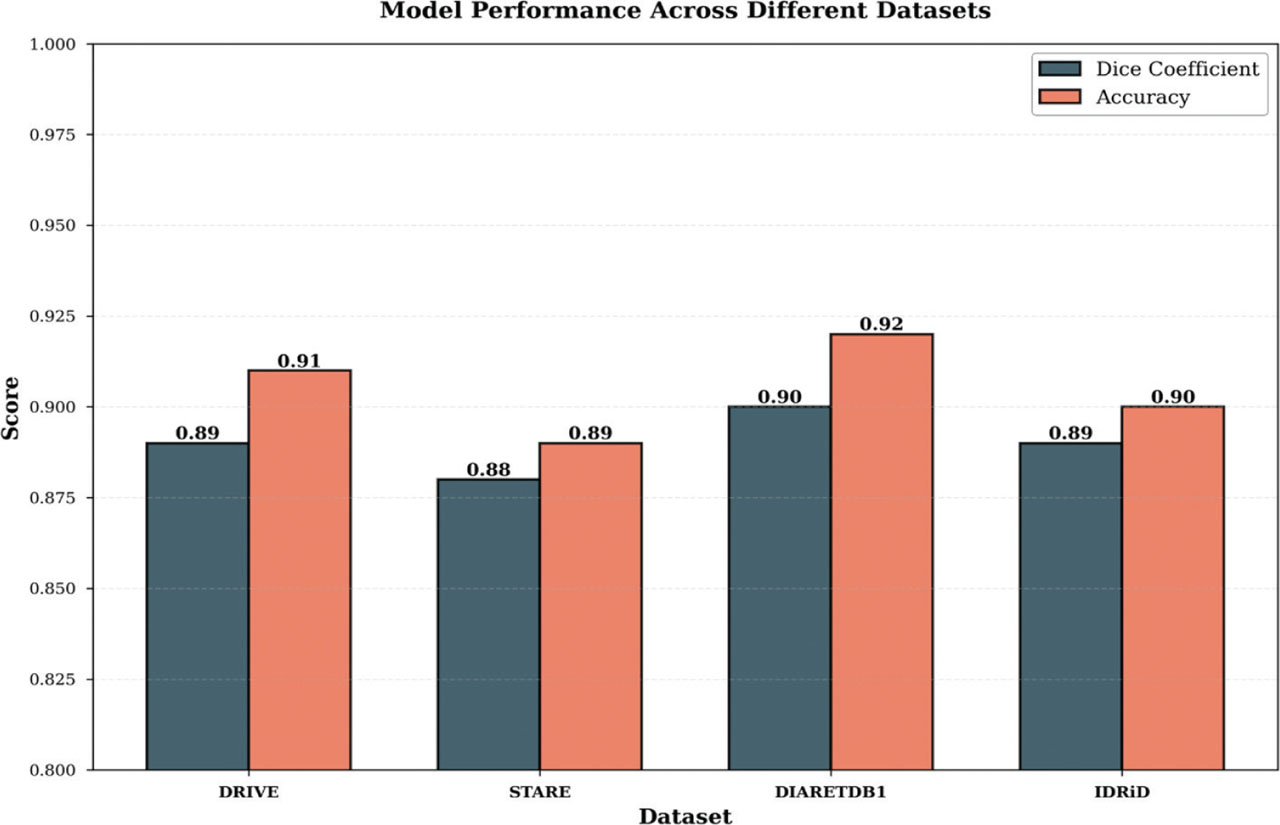
Figure 8:
Model performance across different datasets.