
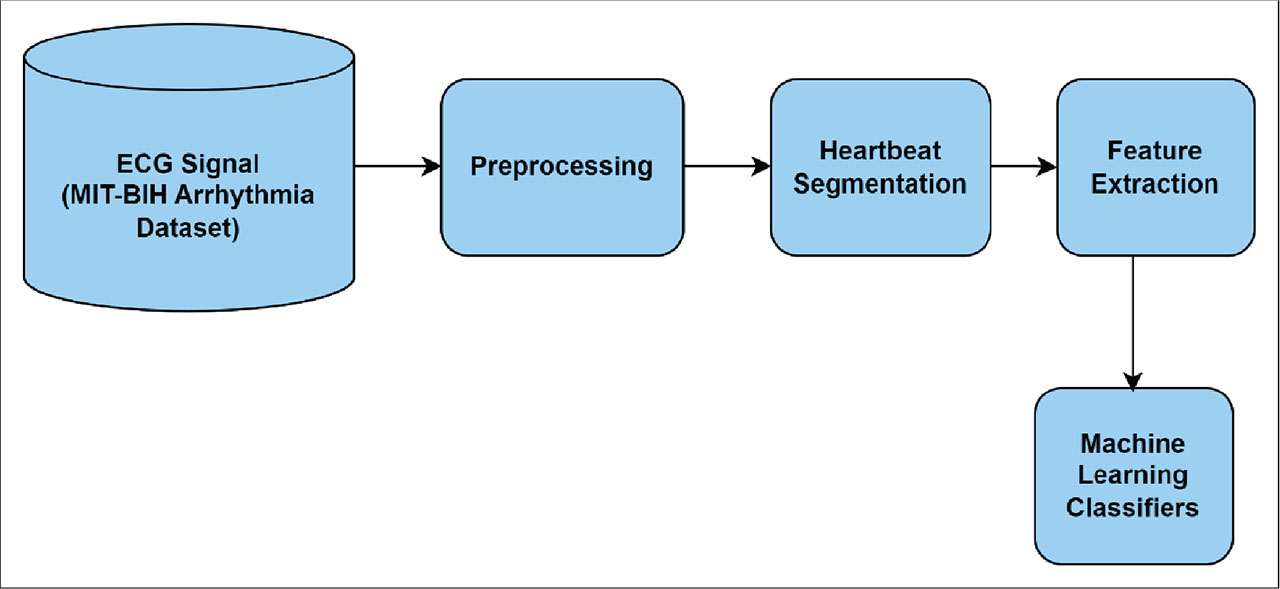
Figure 1:
Classification of the ECG arrhythmia system.
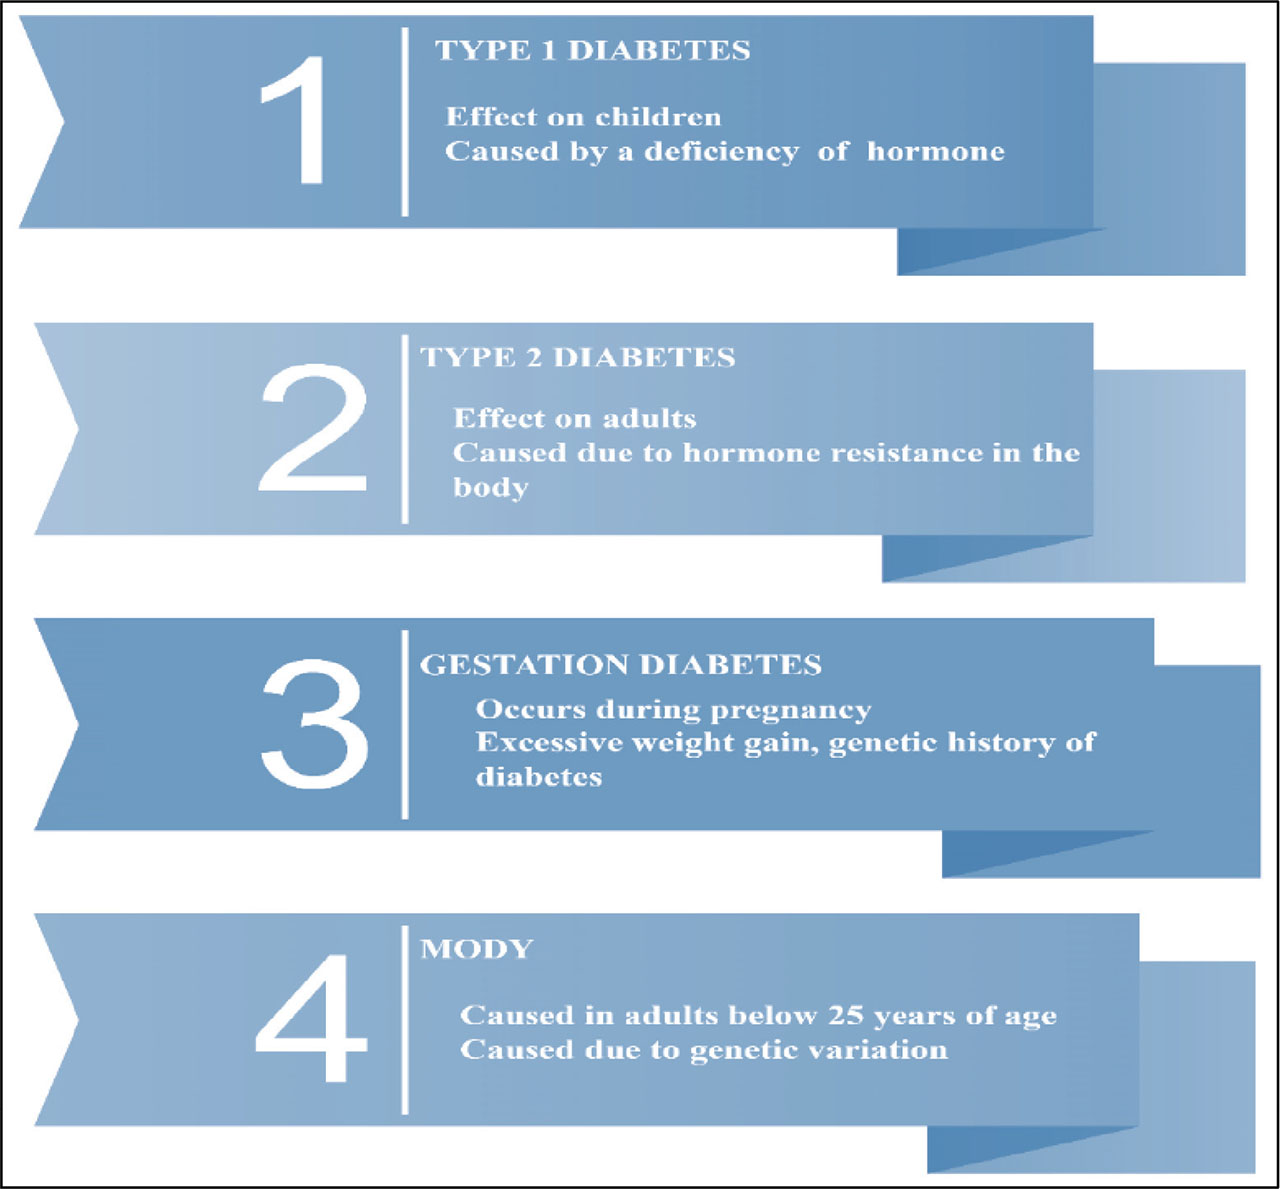
Figure 2:
Different forms of diabetes.
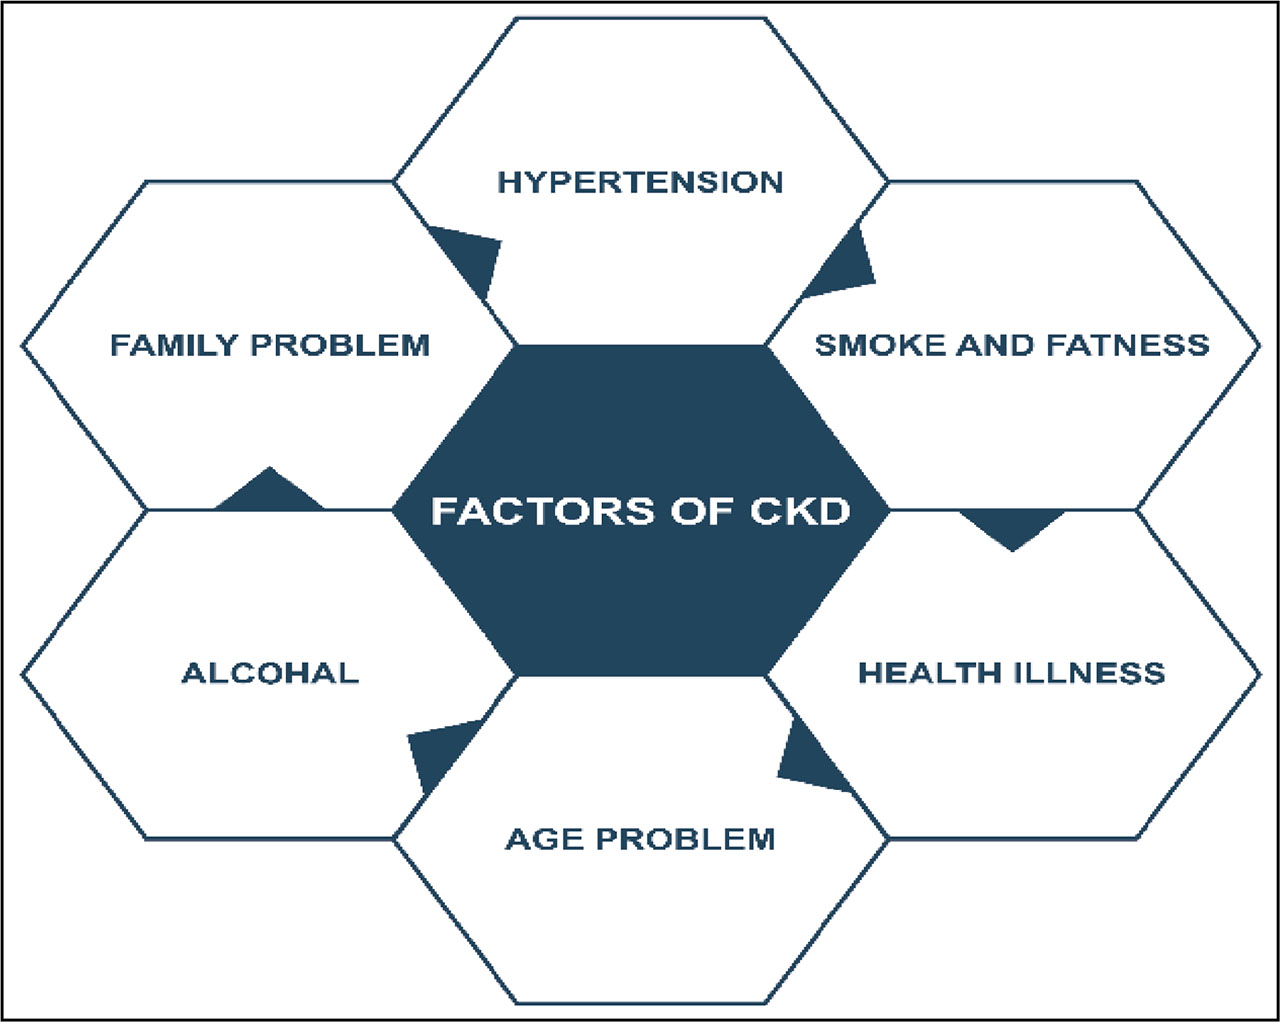
Figure 3:
Factors of CKD. CKD, chronic kidney disease.
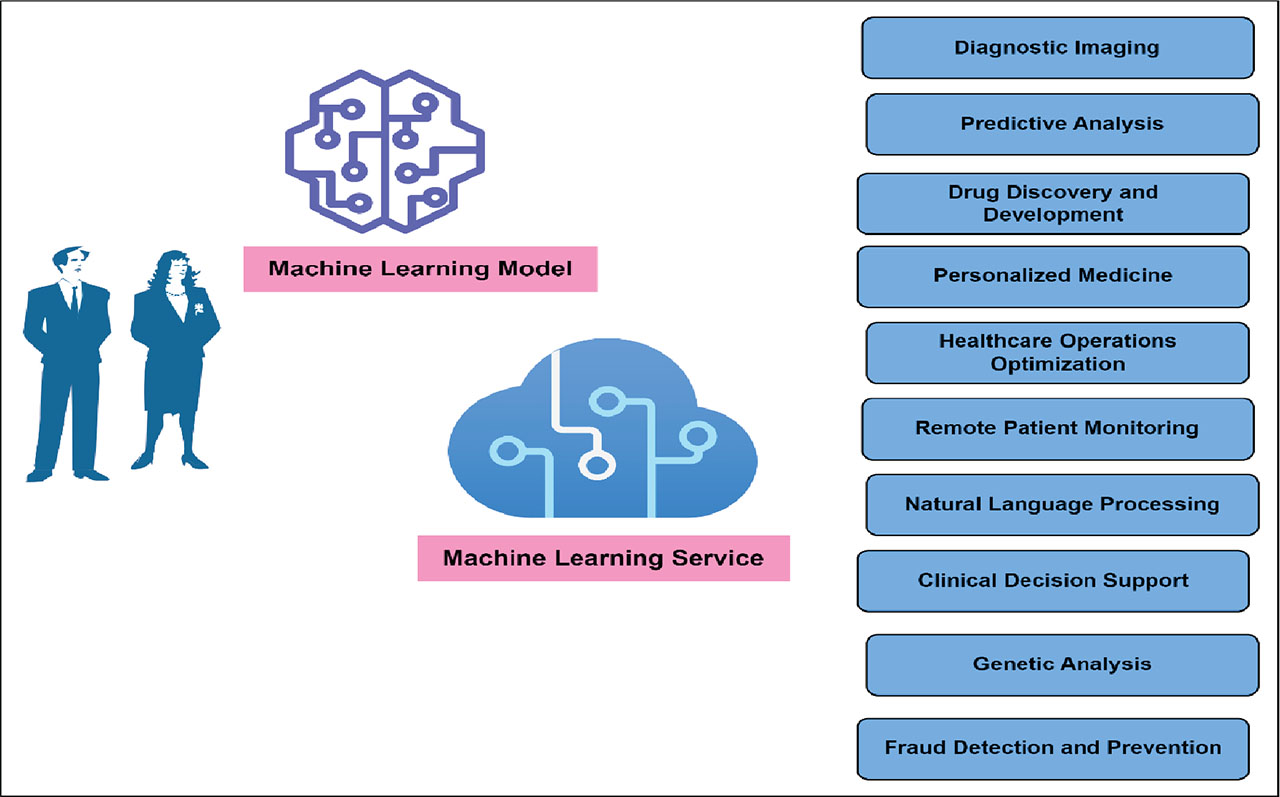
Figure 4:
Application of ML in the healthcare industry. ML, machine learning.
Table 1:
Summary of the ML classification and clustering algorithms in terms of accuracy.
| Supervised ML | ||||
|---|---|---|---|---|
| Classification algorithms | References | Year | Task | Accuracy (%) |
| Support vector regression | [18] | 2022 | Predicting and illustrating the COVID-19 pandemic | 94 |
| Decision trees | [19] | 2022 | Prediction of diabetes | 96 |
| Naïve Bayes | [20] | 2020 | Skin disease detection | 94.3 |
| Naïve Bayes | [21] | 2020 | Heart disease detection | 88.16 |
| Ensemble techniques | [22] | 2020 | Predict the normal weekly cost that patients will spend on specific medicines | 98 |
| Decision trees | [23] | 2020 | Heart disease prediction | 88 |
| SVM | [24] | 2019 | Speech recognition, facial recognition | 91.3 |
| Unsupervised ML | ||||
|---|---|---|---|---|
| Clustering algorithms | References | Year | Task | Accuracy (%) |
| Gaussian mixture model | [25] | 2021 | Anomaly decision | 95 |
| K-Medoids | [26] | 2021 | Detecting problems in smart healthcare | 75.89 |
| K-Means | [27] | 2021 | Heart disease prediction | 88 |
| Fuzzy c-means | [28] | 2019 | Review of patient satisfaction | 76 |
| Hierarchical clustering | [29] | 2018 | Mental health prediction | 90 |
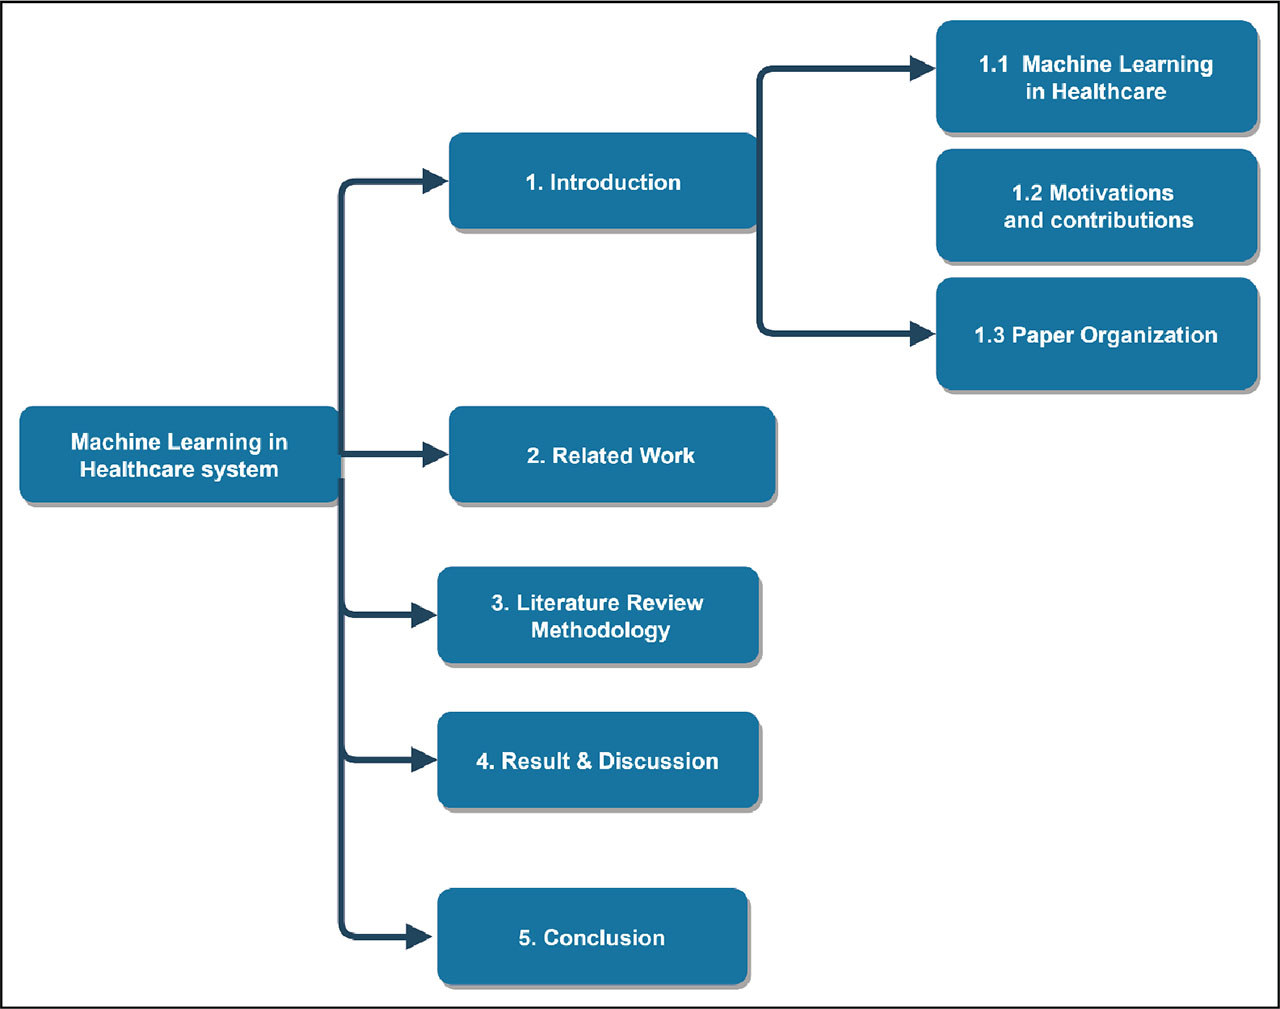
Figure 5:
Review’s structural flow.
Table 2:
Literature review from 2020 to 2024.
| Reference | Year | Algorithm implemented | Contribution |
|---|---|---|---|
| [42] | 2024 | 12 different classifiers that belong to six learning strategies were evaluated using two datasets. | Diagnosing diabetes |
| [43] | 2024 | Ten ML classifiers were used | Prediction of diabetes disease through a mobile app |
| [35] | 2024 | Used sensor technology | Work on gestational diabetes |
| [7] | 2023 | Gradient boosting tree, RF, KNN, and SVM | The authors study an automatic arrhythmia classification method for the healthcare system, the MHO algorithm, and the ML classifier. |
| [6] | 2023 | Convolutional neural network | The CNN algorithm is used for feature extraction on the ECG image dataset |
| [44] | 2023 | NB, LR, SVM, KNN, DT, AdaBoost, XGboost | Compared the performance level by using AUC |
| [40] | 2022 | SVM, LR, DT, XGBOOST, RF, AdaBoost | ADAboost provides 100% sensitivity for the detection of CKD |
| [45] | 2022 | SVM, RF, Gradient boosting, Ada boost | Predicting breast cancer based on different medical symptoms |
| [41] | 2021 | RF, XGBOOST, neural network | Evaluated the risk of CKD |
| [10] | 2021 | 8 ML classifiers were used | Performance analysis of CKD |
| [46] | 2021 | SVM, RF, LR, DT, KNN | Breast cancer prediction and diagnosis |
| [47] | 2020 | Six supervised ML algorithms | Prediction of breast cancer using various ML algorithms |
| [9] | 2020 | K-nearest neighbor, LR, RF, SVM, and decision tree | Diabetes prediction |
| [38] | 2020 | Eleven ML classifiers were used | Prediction of CKD |
| [39] | 2020 | Seven ML techniques are utilized | Classifying the kidney patient dataset as CKD or NOTCKD |
| [30] | 2020 | SVM | An SVM classifier is proposed to classify the heartbeat. The result of SVM was compared with other classifiers |
| [29] | 2020 | SVM, KNN, ANN | Construct a biometric recognition system |
[i] ANN, artificial neural network; AUC, area under the curve; CKD, chronic kidney disease; CNN, convolutional neural network; DT, decision tree; KNN, k-nearest neighbors; LR, logistic regression; MHO, metaheuristic optimisation; ML, machine learning; NB, Naïve Bayes; NOTCKD, not chronic kidney disease; RF, random forest; SVM, support vector machine.
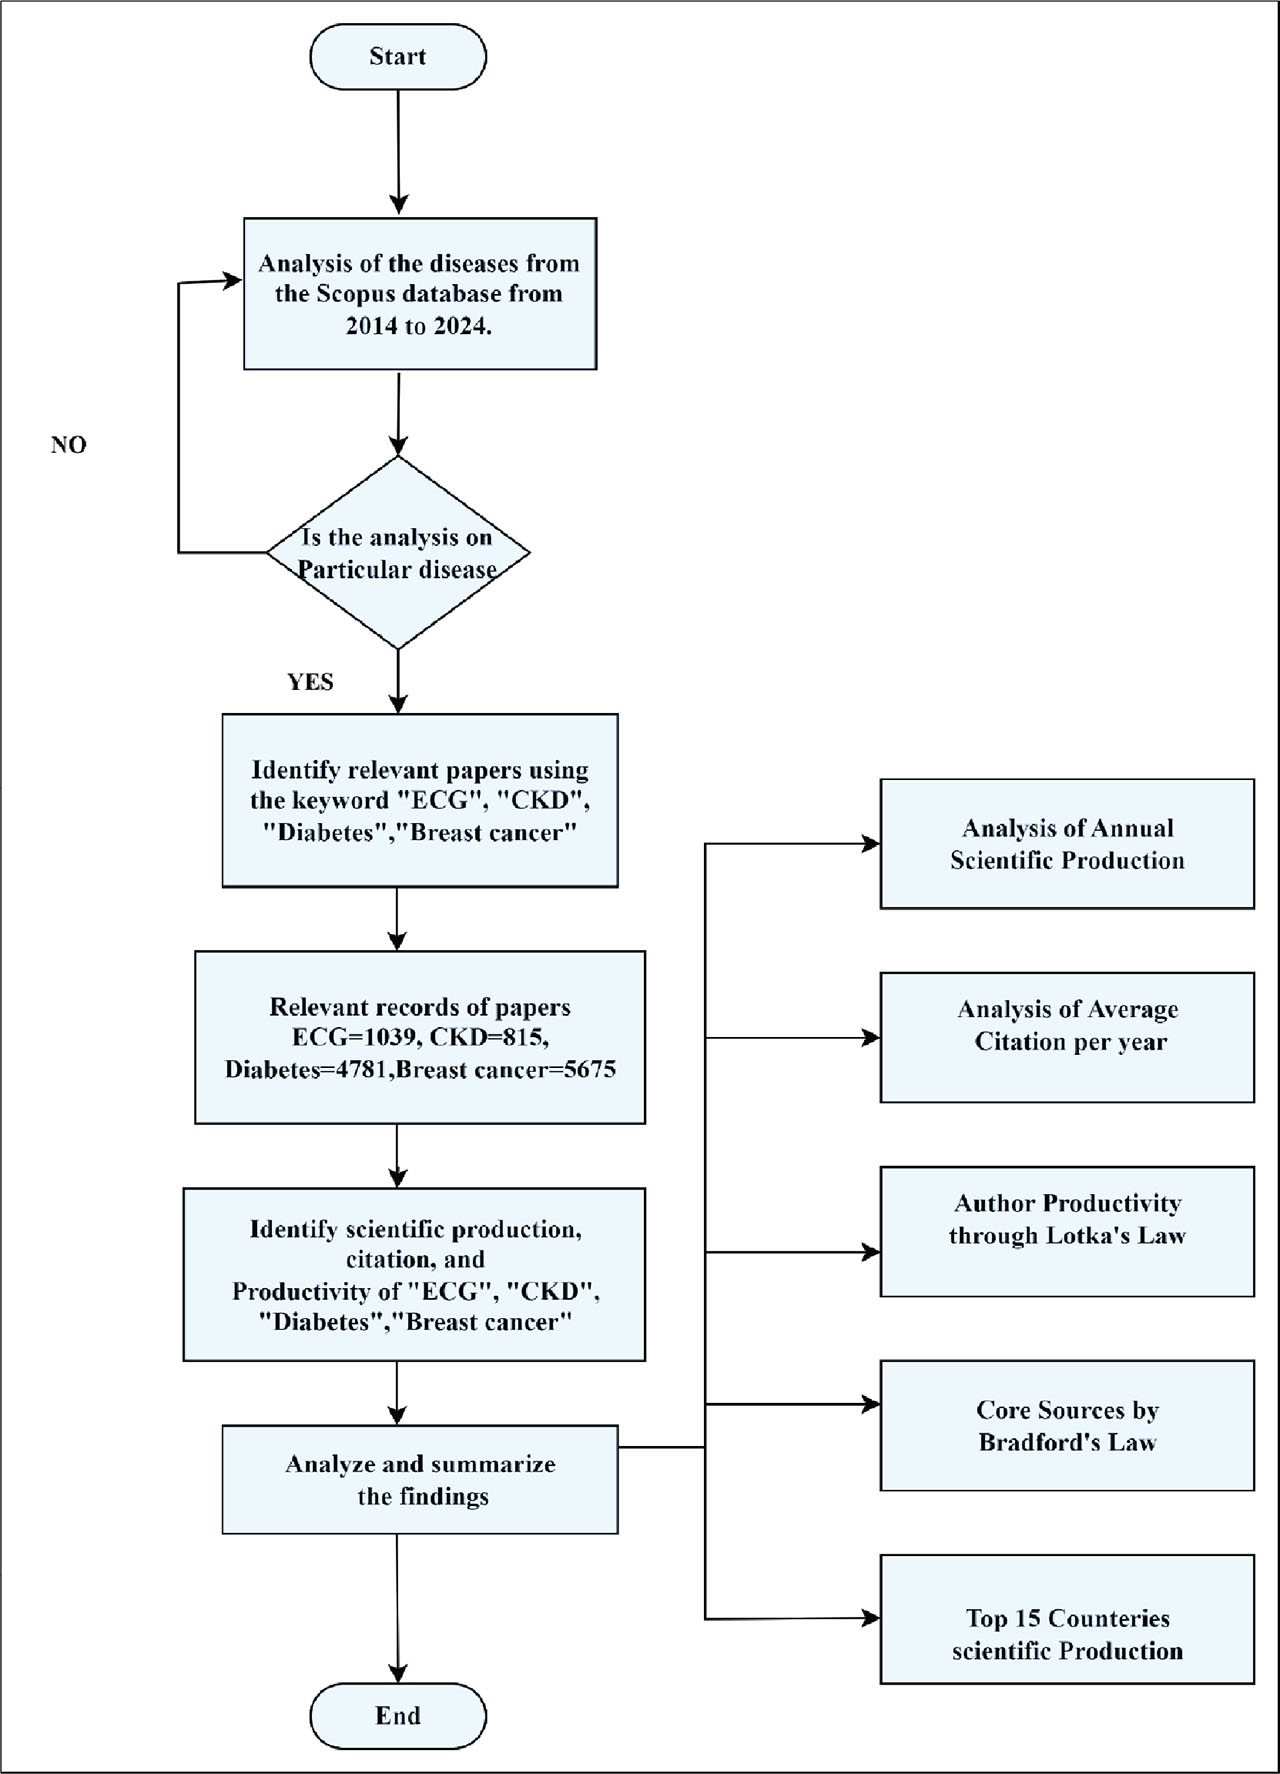
Figure 6:
Methodology framework from data analysis. CKD, chronic kidney disease.
Table 3:
Research questions.
| Research question No. | Research question | Objective |
|---|---|---|
| 1. | How can the integration of AI-driven methodologies in breast cancer research improve early detection and personalized treatment plans? |
|
| 2. | How does the volume of research publications in ECG, CKD, diabetes, and breast cancer correlate with healthcare challenges and research priorities in different countries? | Interpret how these research patterns might indicate the healthcare challenges faced by these countries. |
| 3. | How does author productivity vary among ECG, diabetes, CKD, and breast cancer research fields according to Lotka’s law? | Determine which field has the highest and lowest percentage of highly productive authors. |
| 4. | What insights can Biblioshiny keyword co-occurrence analysis provide for a specific field of research? | Keyword co-occurrence analysis identifies the most frequent terms in a field, revealing key research themes, emerging trends, and areas of academic focus or future opportunities. |
Table 4:
Inclusion and exclusion criteria.
| Inclusion criteria | Exclusion criteria |
|---|---|
|
|
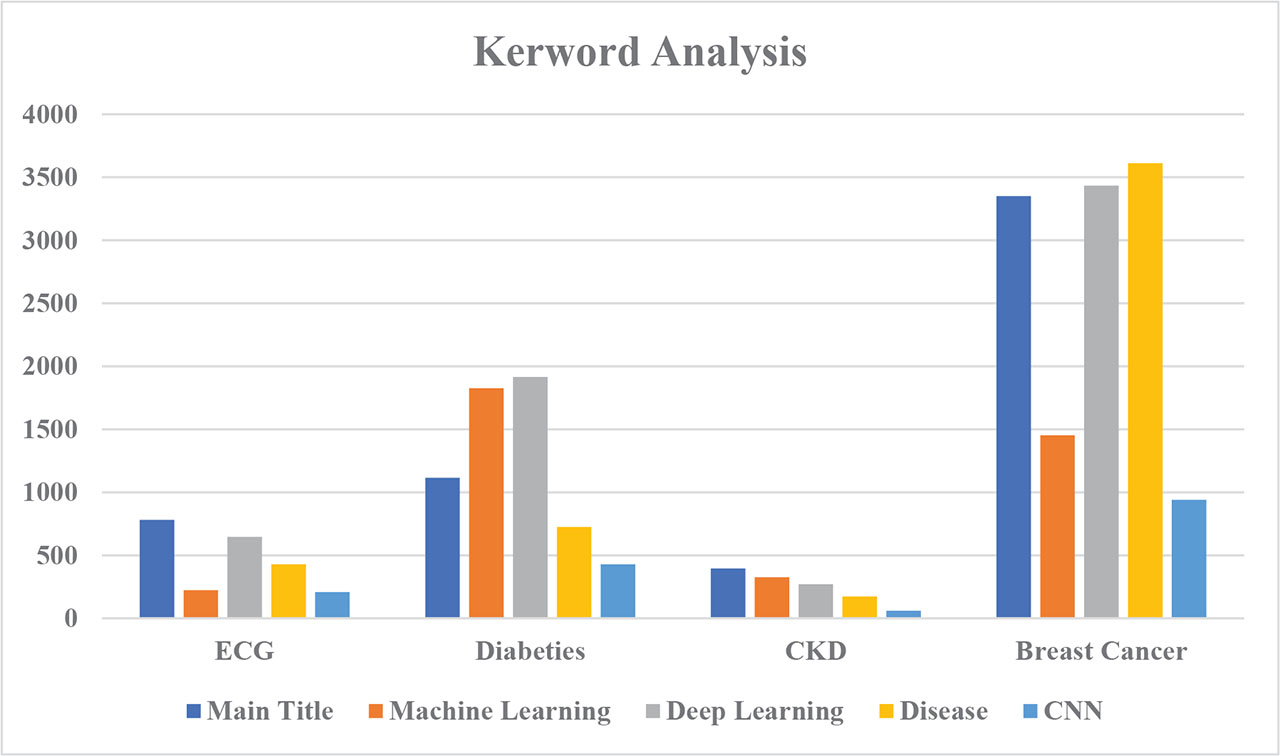
Figure 7:
Keyword analysis. CKD, chronic kidney disease.
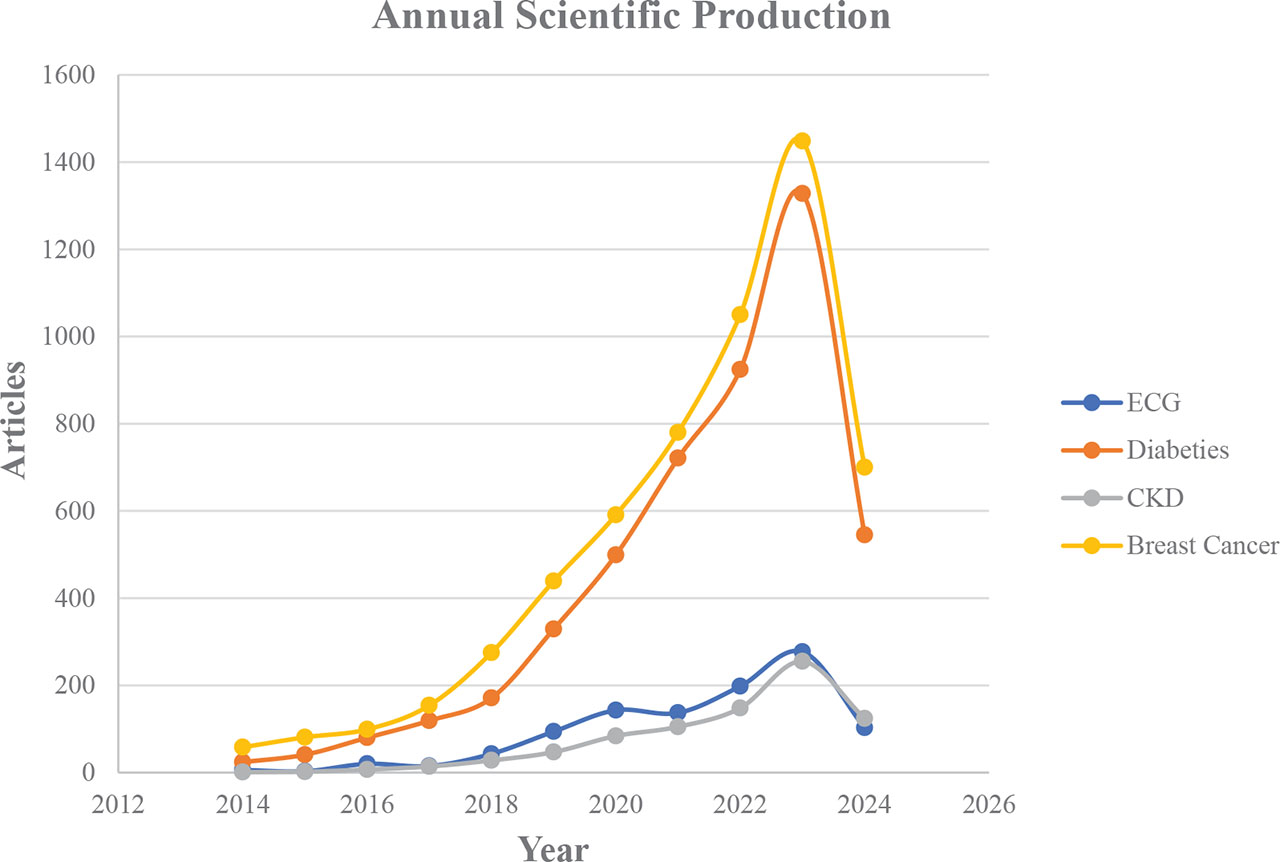
Figure 8:
Year-wise annual scientific production of diseases. CKD, chronic kidney disease.
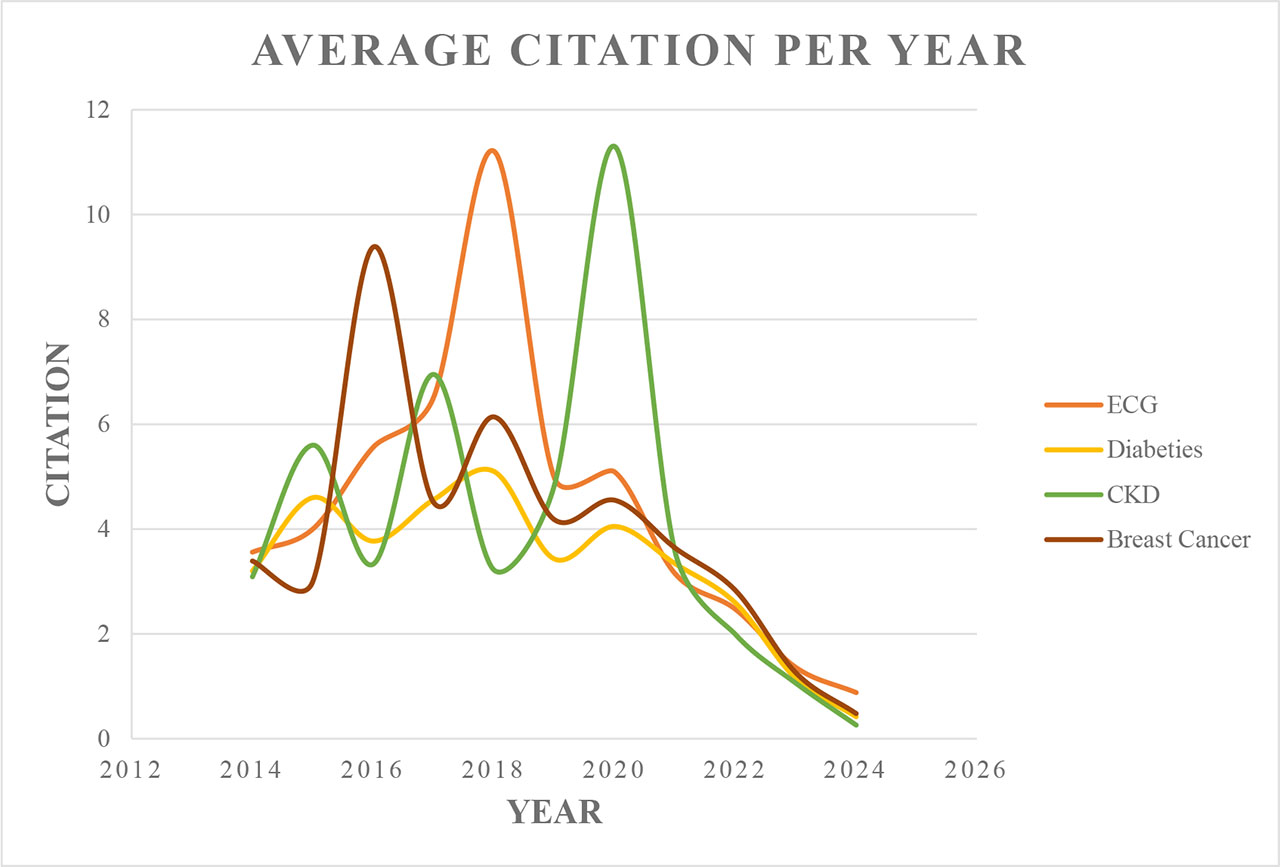
Figure 9:
Average citation per year. CKD, chronic kidney disease.
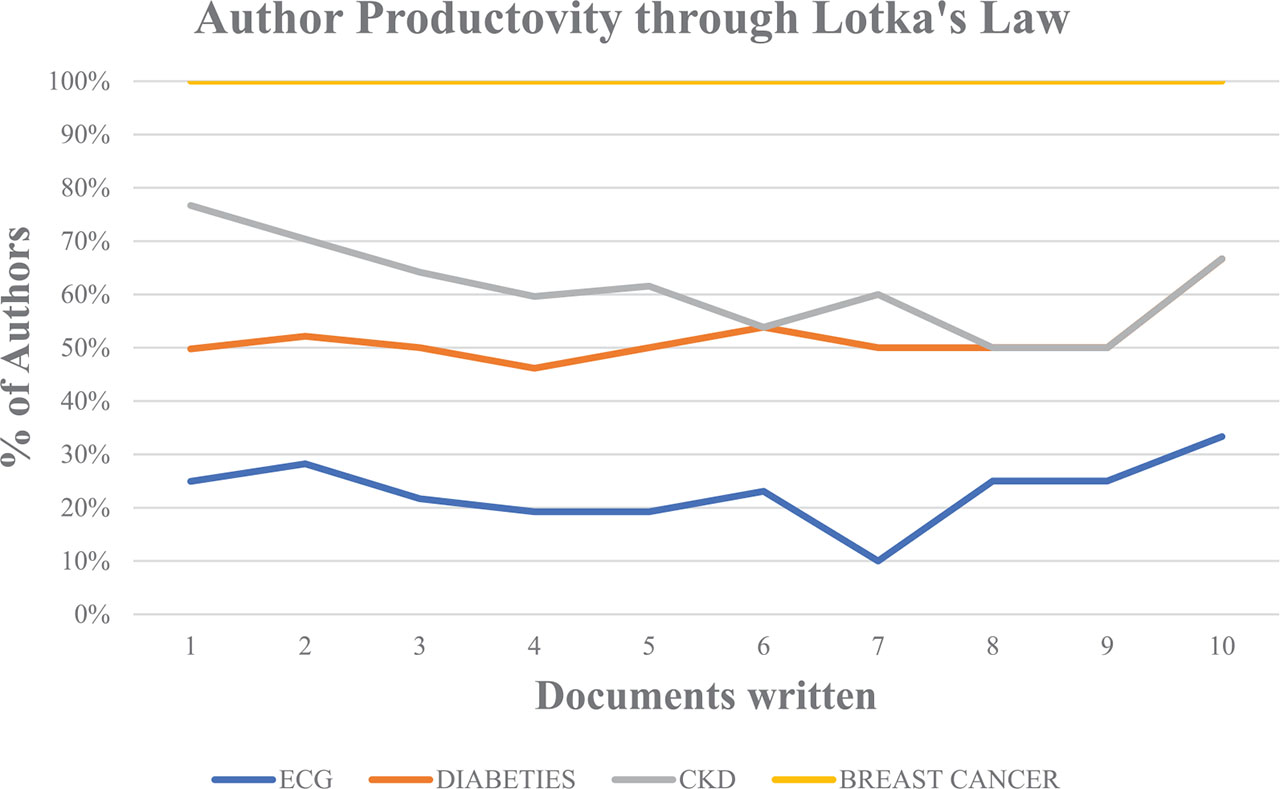
Figure 10:
Author productivity through Lotka’s law. CKD, chronic kidney disease.
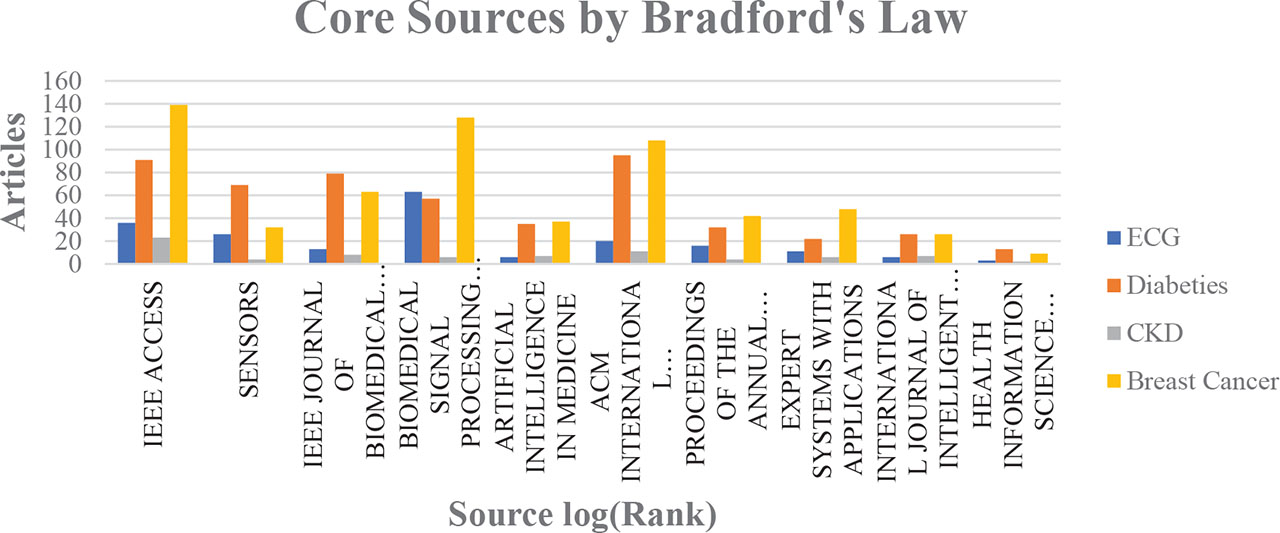
Figure 11:
Core sources by Bradford’s law. CKD, chronic kidney disease.
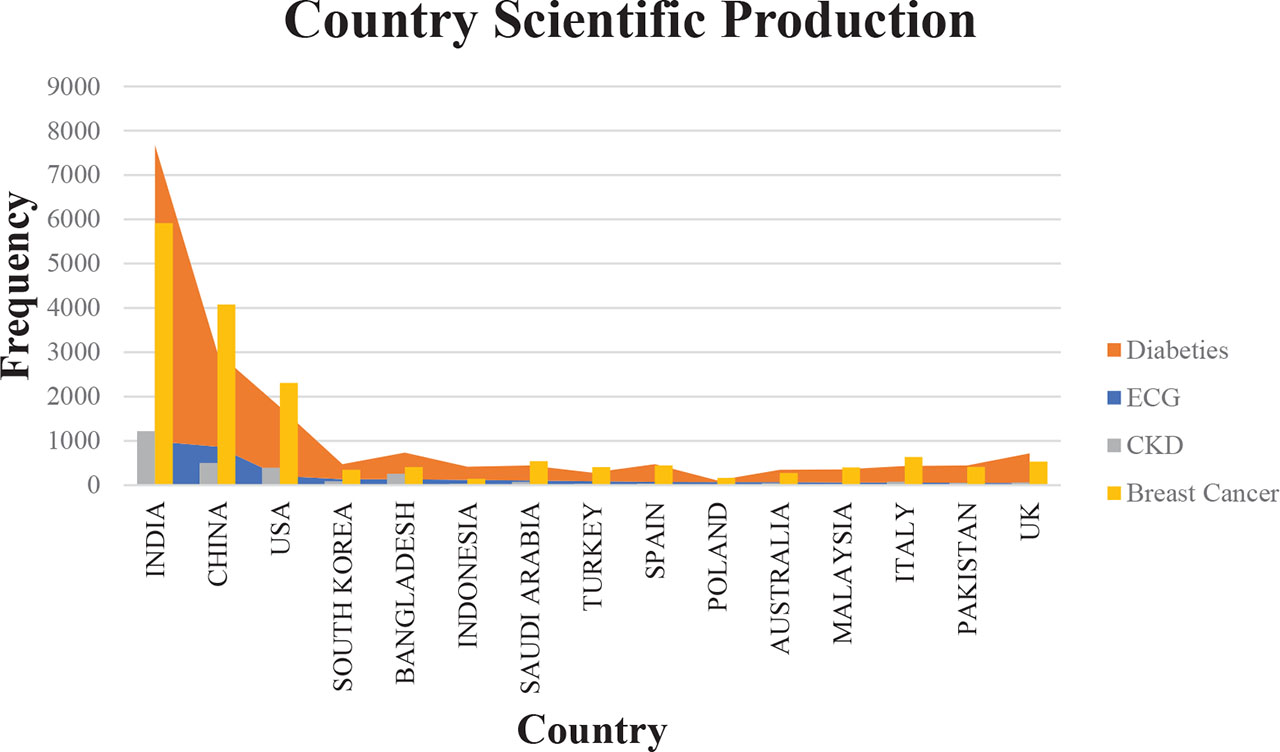
Figure 12:
Country scientific production. CKD, chronic kidney disease.
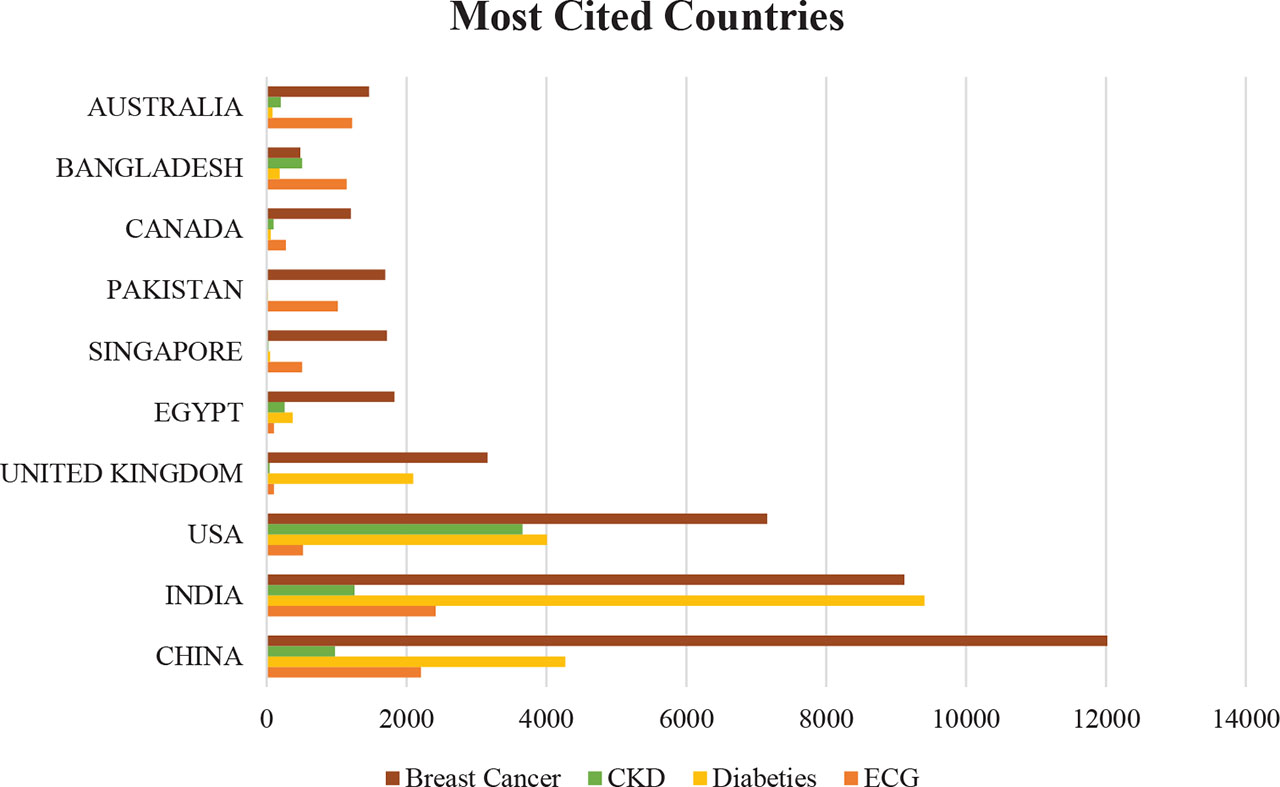
Figure 13:
Most cited countries. CKD, chronic kidney disease.
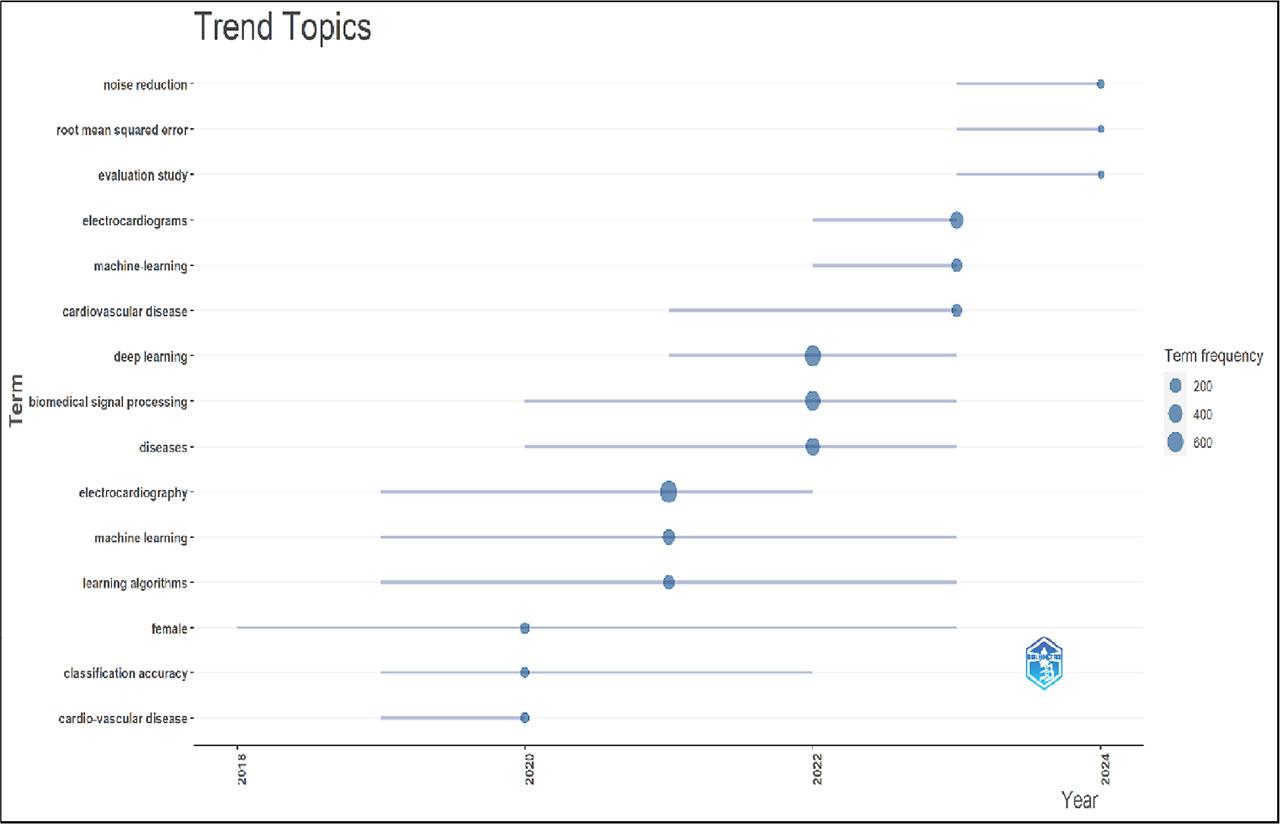
Figure 14:
ECG trend topics.
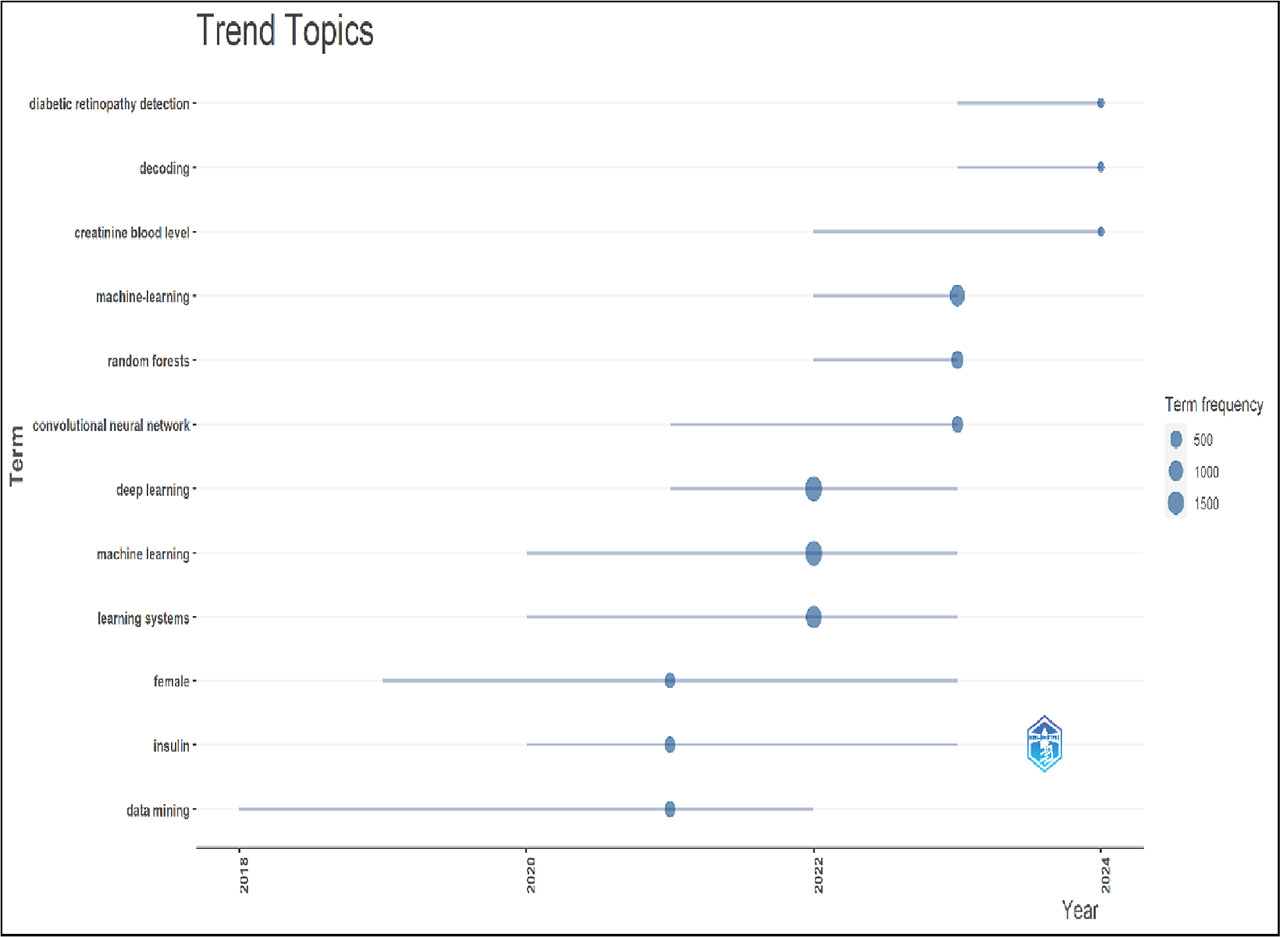
Figure 15:
Diabetes trend topics.
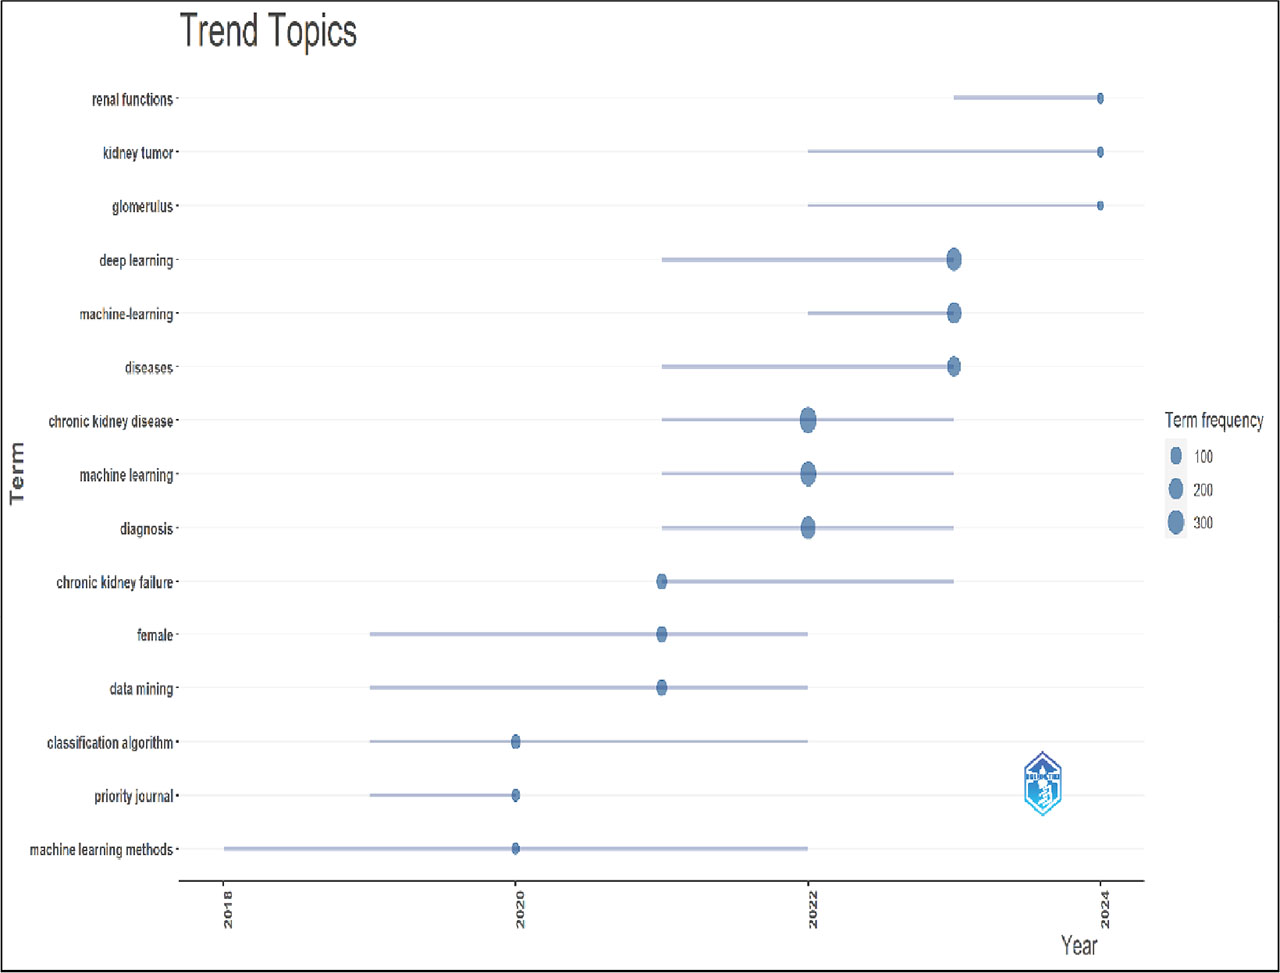
Figure 16:
CKD trend topics. CKD, chronic kidney disease.
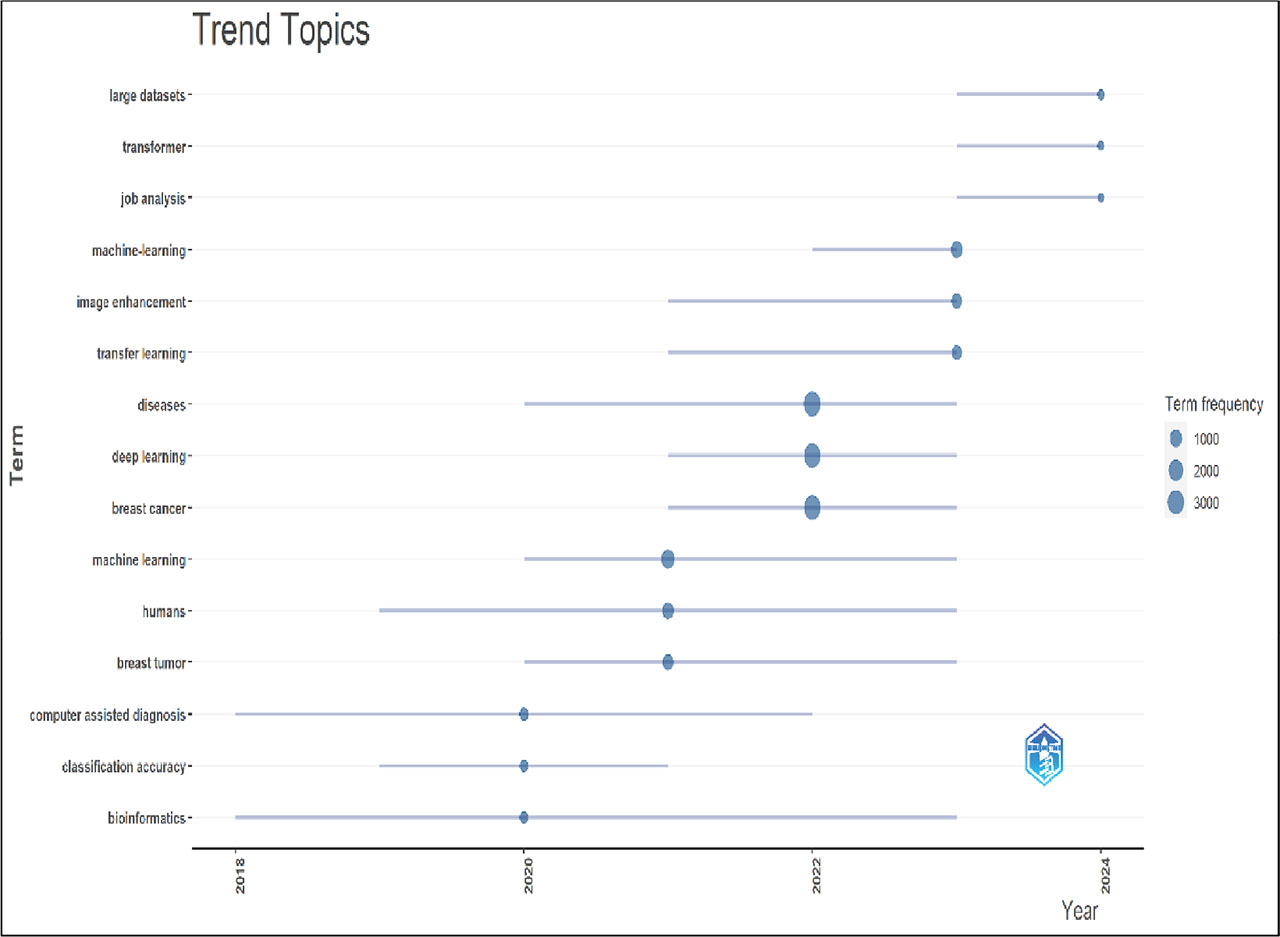
Figure 17:
Breast cancer trend topics.
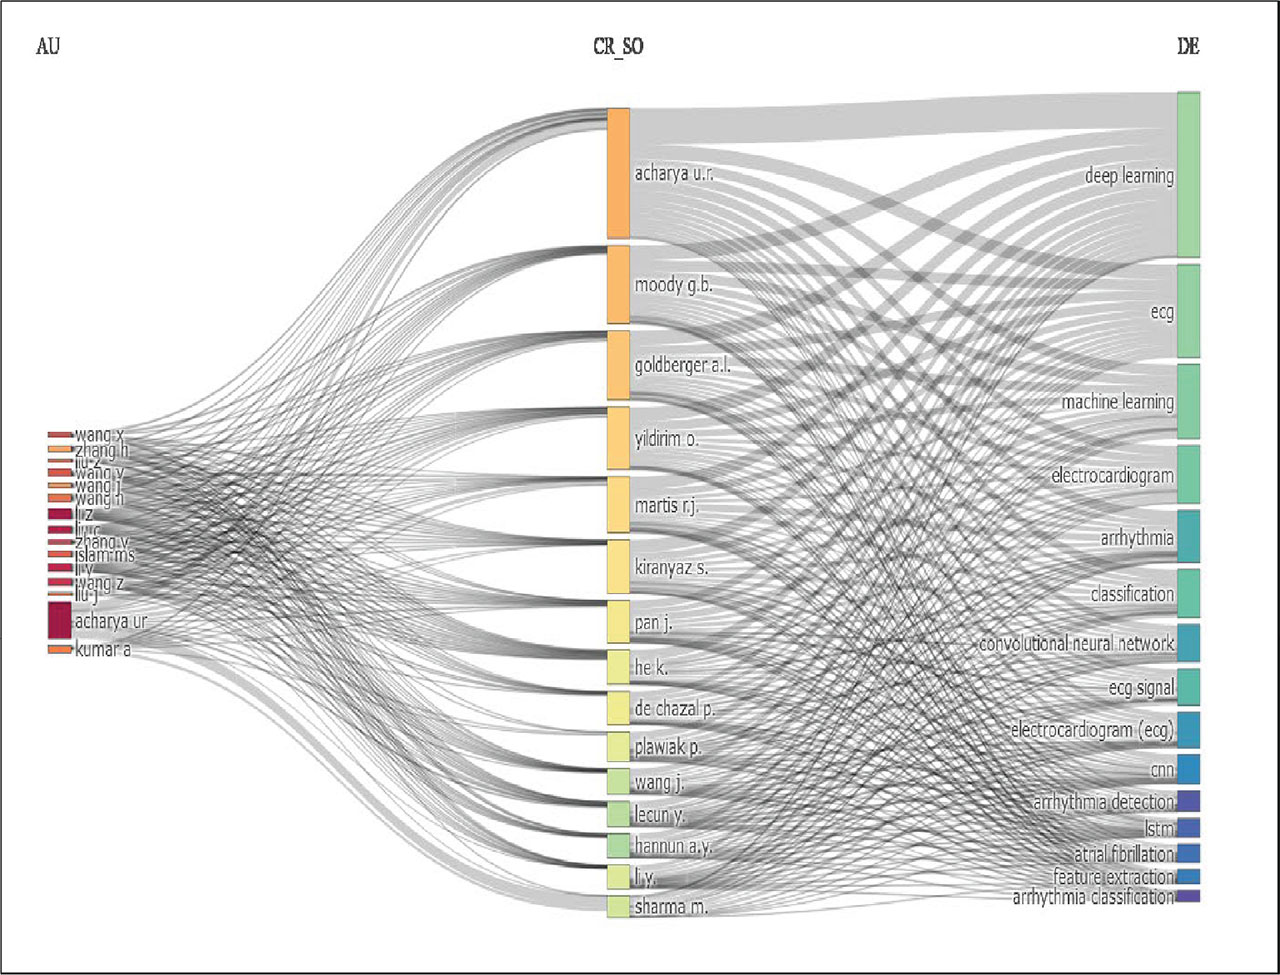
Figure 18:
ECG three fields plot.
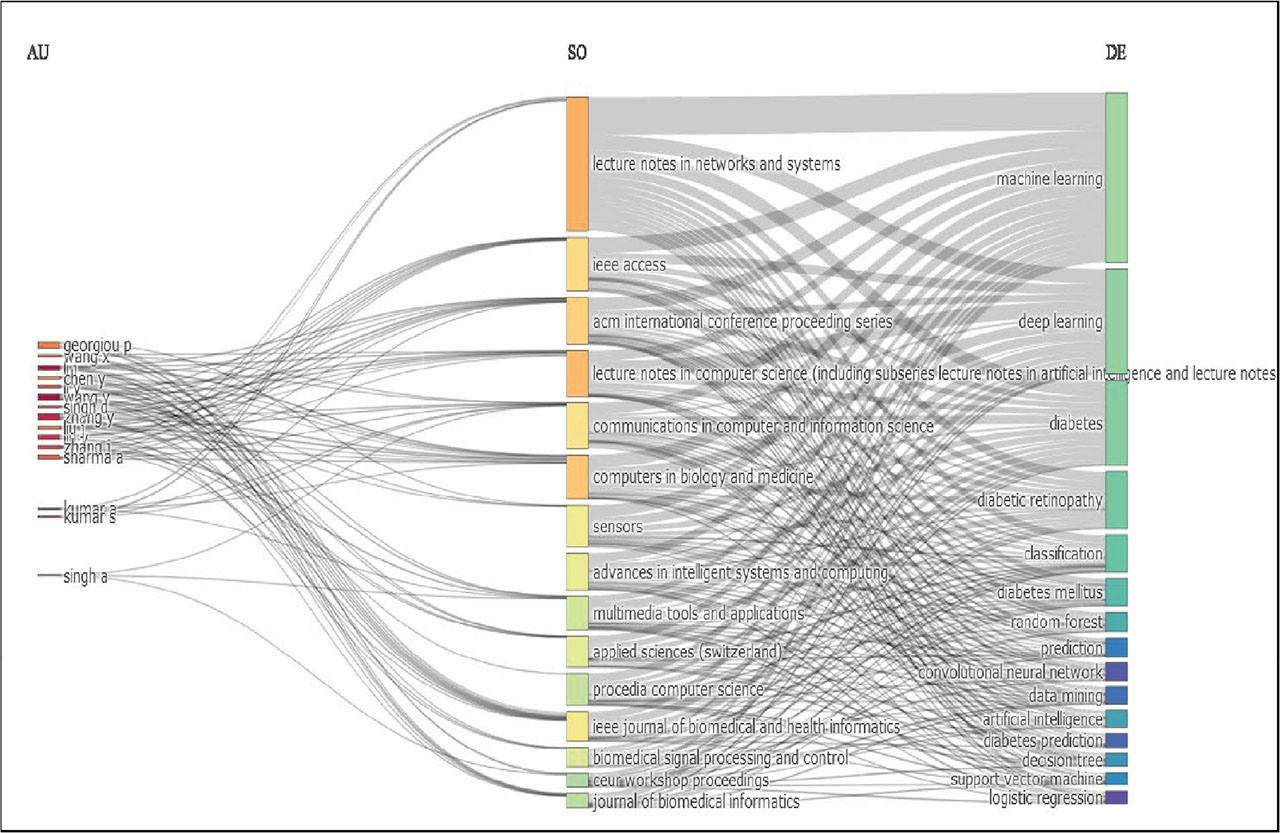
Figure 19:
Diabetes three fields plot.
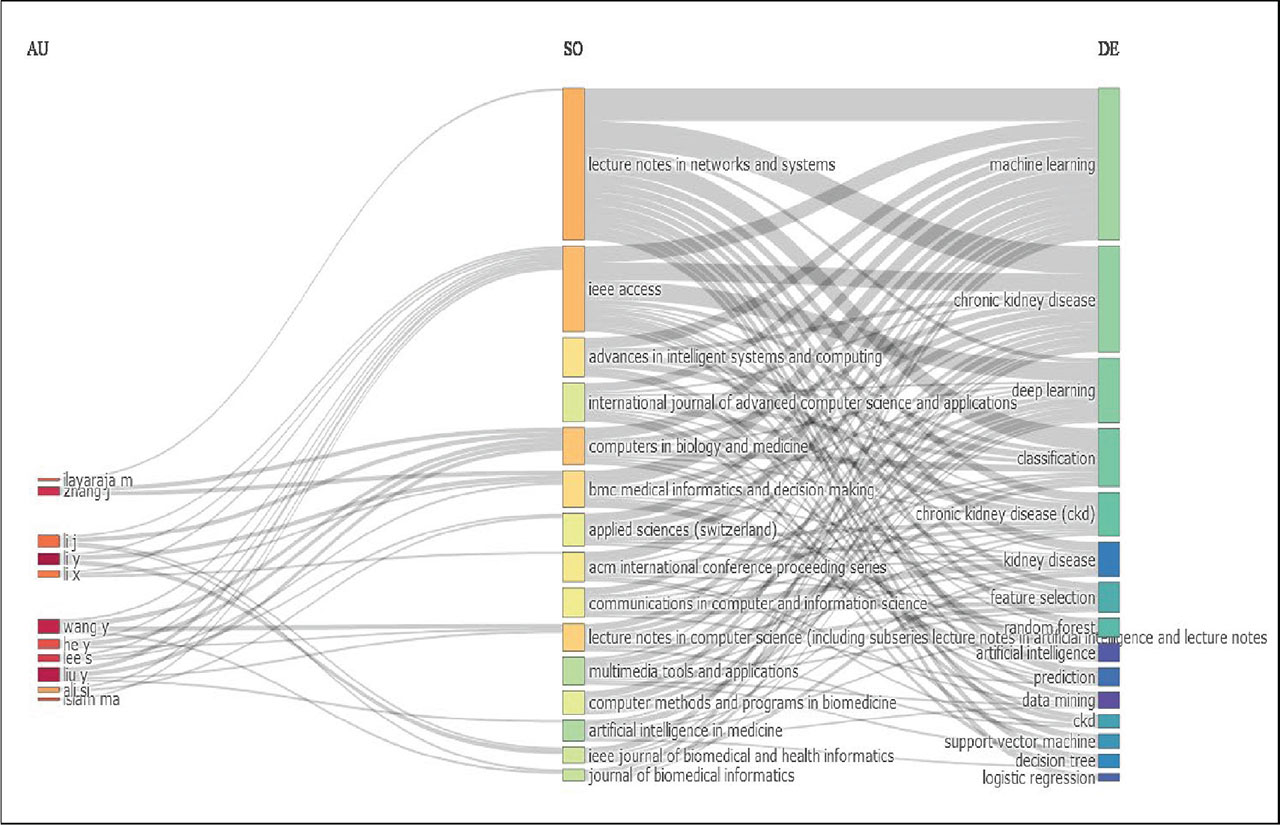
Figure 20:
CKD three fields plot. CKD, chronic kidney disease.
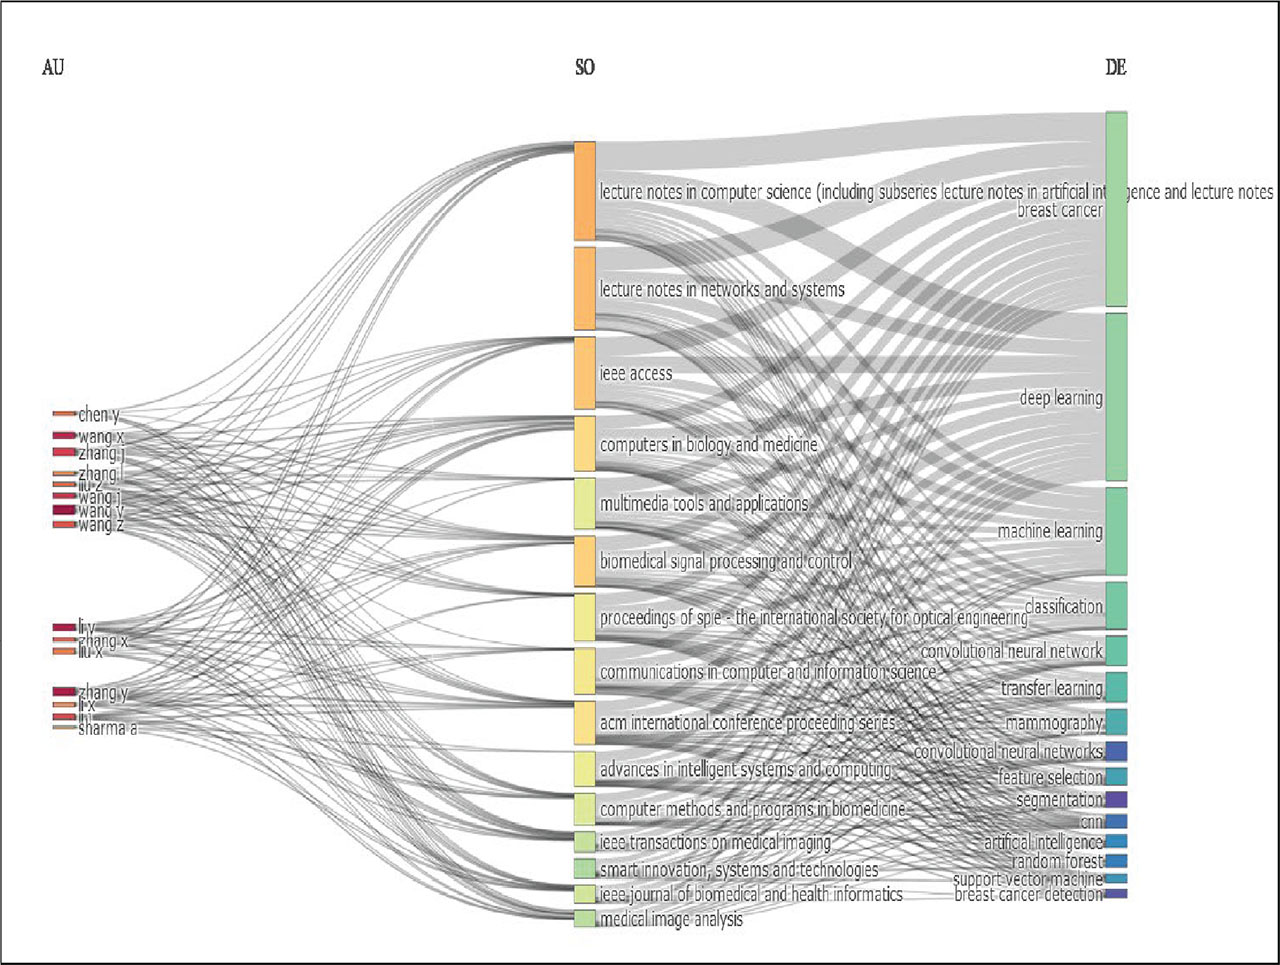
Figure 21:
Breast cancer three-field plot.