
I. Introduction
The contemporary educational landscape is increasingly shaped by rapid technological advancements, with digital technologies playing a central role in enhancing teaching and learning experiences [1]. Among these emerging technologies, eye-tracking systems have gained significant attention for their ability to provide objective insights into learners’ visual attention, cognitive engagement, and information processing. One such advanced technique is videonystagmography (VNG), which has evolved over the past two decades as a gold-standard method for precise and efficient eye-movement assessment [2]. Earlier, eye-tracking was complex, expensive, and largely confined to research laboratories. However, recent advancements in high-performance processors and digital video processing have enabled its wider application across several domains, including education [3].
Technology-based education involves the effective use of digital tools and resources to enhance learning processes and learner understanding [4]. Innovative applications of eye-tracking in education have contributed substantially to educational research by enabling direct measurement of visual attention and interaction with learning materials [5]. Beyond education, eye-tracking technologies are extensively used in psychological and sociological research for applications such as lie detection, neuropsychological studies, and analysis of reading behavior [6, 7]. More recently, these technologies have been successfully implemented in educational and psychological settings to assess students’ interaction patterns with digital content and instructional materials [8].
Recent trends in educational research emphasize understanding both the processes and outcomes of learning [9]. Traditional methods for measuring cognitive activity—such as behavioral observations and self-report questionnaires—often suffer from subjectivity and validity limitations [10]. Eye-tracking methodology offers an effective solution to overcome these challenges by providing accurate, real-time, and objective measurements of visual and cognitive behavior [11]. Consequently, eye-movement analysis has been widely used to investigate learning processes such as reading, memory, language acquisition, and problem-solving. These studies have demonstrated that eye movements serve as reliable indicators of underlying cognitive processing, enabling deeper insights into how learners acquire and process information.
A primary clinical application of VNG is the detection and measurement of nystagmus, which refers to involuntary, rhythmic eye movements [12]. Nystagmus may occur in horizontal, vertical, or torsional directions [13]. Clinically, VNG is widely used to diagnose balance disorders, dizziness, and vestibular dysfunction, and to evaluate gaze stability [14, 15]. High-resolution infrared video goggles enable the detection of extremely small and rapid eye movements that are otherwise unobservable with the naked eye [16]. VNG data are highly accurate and consistent, providing quantitative information on an individual’s ability to track visual targets [17]. Oculomotor functions—including spontaneous nystagmus, gaze stability, saccades, smooth pursuit, and optokinetic responses—can be precisely assessed using VNG. Nearly 90% of central vestibular lesions are associated with oculomotor dysfunction [18], and studies indicate that impairments in oculomotor control can adversely affect reading fluency and comprehension in students [19]. These findings highlight the potential relevance of VNG-based eye-movement analysis beyond clinical diagnosis and into educational research.
Eye-tracking technology offers wide-ranging applications in the education system [9]. Analyzing students’ responses to visual stimuli, it enables continuous assessment of their cognitive and emotional engagement [8]. Eye movements recorded in real time can provide educators with valuable insights into students’ attention span, visual scanning patterns, and learning behaviors [20]. Such objective indicators can support instructional design, curriculum development, and assessment strategies.
The present study is significant as it explores the influence of advanced eye-tracking technology parameters on learning outcomes—an area that remains insufficiently investigated, particularly in engineering education. Learning outcomes form the foundation of higher education, guiding curriculum design, teaching methodologies, and assessment practices [21]. Prior research suggests that variations in learning are influenced not only by individual differences but also by learners’ ontological and epistemological perspectives [22, 23]. By analyzing gaze behavior in predefined areas of interest, it becomes possible to understand how students visually integrate and process knowledge [24]. While extensive studies have documented the use of eye-tracking in cognitive psychology [25] as well as in educational research [26], large-scale studies conducted in authentic classroom environments demonstrate that eye-tracking tools can be used not merely for observation but also for evaluating instructional effectiveness [27]. However, identifying suitable application profiles and meaningful performance indicators remains a challenge.
The core objective of this work is to perform a statistical analysis of VNG-based eye-movement recordings of engineering students and to investigate their relationship with academic performance. As suggested in earlier research [28], eye movements are closely related to cognitive and mental processes. The fundamental assumption underlying eye-tracking research is that ocular behavior reflects cognitive processing related to learning capability [29]. Accordingly, the present study examines the statistical significance of VNG parameters in relation to students’ performance scores. The analysis further extends to comparing VNG data across distinct student groups, including male–female and slow–fast learners.
Based on this framework, the present investigation is guided by the following research questions:
RQ1: Is there a significant difference in the VNG parameters between male and female students?
RQ2: How do horizontal and vertical saccadic latencies of the right and left eyes predict student academic performance, and does the strength of prediction vary across parameters?
II. Material and Methods
Most eye-tracking devices have three different setups.
(1) Setups with an unrestrained head and such eye-tracking signals were referred to as head-free setups.
(2) Setups with an unrestrained head and an eye tracker signal with a reference frame attached to the world were referred to as head-boxed setups.
(3) Setups with a retrained head and a single or dual eye-tracking setup that can record one or two participants’ gazes, respectively [30].
The response of the eye was provided by the recording [31]. The unrestrained head setup was used in the present work.
a. Participants
Third semester engineering undergraduate students from a private engineering college in Karnataka, India, participated in the study. The recordings were conducted on 36 students (18 males and 18 females) whose performance in six theory subjects from the previous year’s undergraduate engineering program is documented. The voluntary students participated, and a written informed consent was obtained prior to the experiment. Except for the farsightedness, there was no evidence of any visual or oculomotor defect amongst the participants. Most of the students had normal vision; however, two students had difficulty seeing distant objects and had corrected-to-normal visual acuity.
VNG records the eye movement from the infrared (IR) cameras that are mounted on the goggles. Firstly, the system detects the location of the eye. From the eye region and the head position, the robust software estimates the position and center of the pupil [32]. The clinician or examiner selects the test of interest from the software. The complete set of available VNG assessment modules is shown in Figure 1. These provocative tests reveal a certain pathology or a latent unilateral vestibular hypofunction. In an ocular mobility test, the person under test will be asked to follow an object or a dot on the computer screen that changes its position from one point to another, move smoothly (smooth pursuit), or remain still (saccades) [33].

Figure 1:
Screenshot of the VNG test interface showing the complete set of available ocular and vestibular assessment modules, including saccades, smooth pursuit, caloric test, optokinetic test, spontaneous nystagmus, gaze test, positional test, Subjective Mid-Point, Subjective Visual Vertical, Pupillometry, Head Impulse Test, and Video Frenzal. VNG, videonystagmography.
The recorded parameters for saccades (horizontal and vertical) tests are velocity, precision, and latency for both the left and right eyes. Velocity is the time taken to complete the saccades after initiation. Precision is the amplitude of the eye movement relative to the stimulus, and latency is the delay between the onset of the stimulus and the initiation of the eye movements. The person under test will be asked to gaze at the constantly moving dot image on the screen. The examiner is looking for any delays or inaccuracies in the person’s ability to match the visual target. As discussed in the previous initial work [34], a significant correlation was found only with saccades data among other tests like sinusoidal wave pursuit or the optokinetic tests. Hence, in this study, only the saccades horizontal and vertical data of both the left and right eyes were considered for further analysis. In total, there were 12 quantitative data parameters from the recordings of 36 students. The 12 parameters were the velocity, precision, and latency of the right and left eye for both horizontal and vertical saccades.
b. Apparatus
Balance Eye (Cyclops MedTech Pvt. Ltd., Bangalore, India.) comprises an infrared video-based eye tracking system and a processing system, the hardware configuration of the Balance Eye system is illustrated in Figure 2.
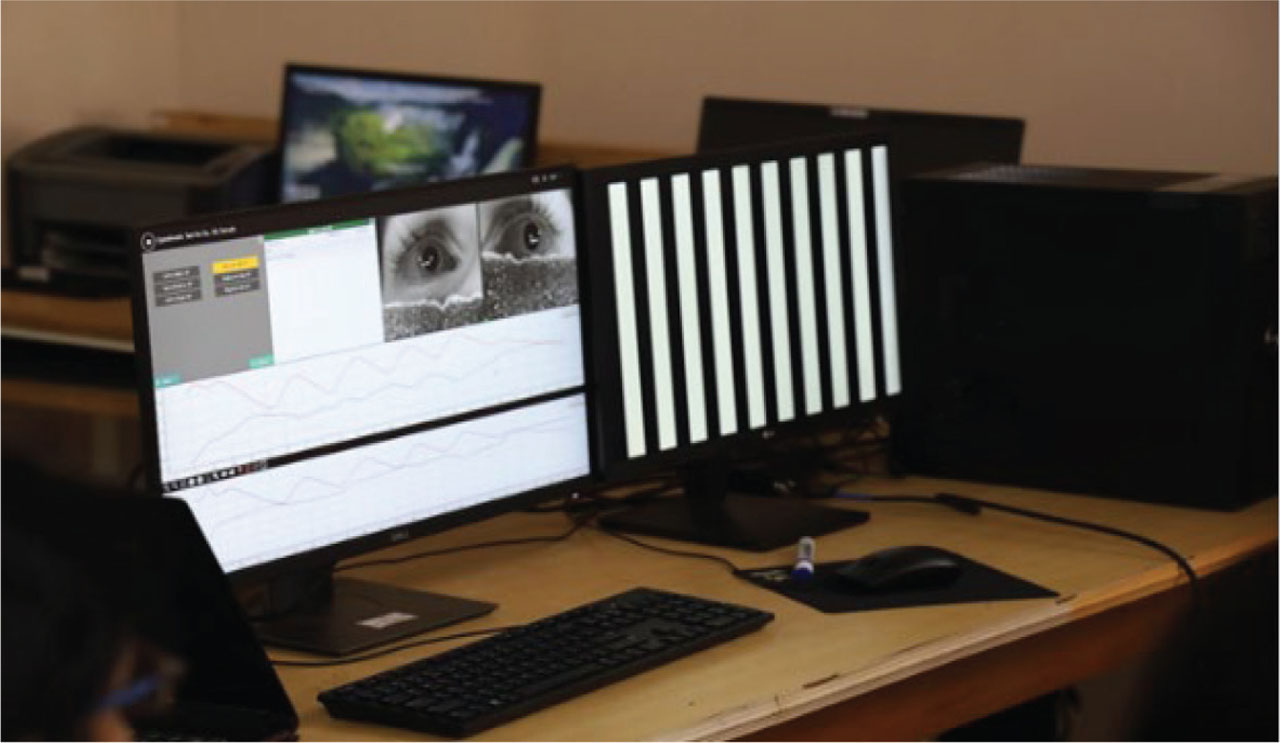
Figure 2:
Hardware configuration of the Balance Eye VNG system (Cyclops MedTech Pvt. Ltd.), comprising the infrared video goggles for binocular eye tracking and the processing unit for real-time recording and analysis of horizontal and vertical eye movements. VNG, videonystagmography.
The balanced eye tracks and records the movement of the pupil. The software has protocols that give the target protocol to the person under test to follow, and the software tracks the eye movement for each test and gives the necessary data points for further analysis. The eye tracking system records the horizontal and vertical parameters for both eyes with a spatial resolution of 0.5° of visual angle and a temporal resolution of 40 ms.
The participant was seated in a relaxed position at 40 cm from the secondary screen, wearing infrared goggles. Students were instructed to fixate on the white square or dot as it moved to distinct locations on the screen. The presentation of the stimuli, data recording, and storage of the data were controlled by the Power Edge T20 Tower Server/Intel Xeon Processor, 3.2 GHz/16 GB Ram/2TBx2HDD, Windows Server. Stimuli were presented on a 20-inch Sony monitor with a resolution of 1,280 × 768. The system needs to be calibrated before commencing the recording. The system plots the graph, capturing data every 15 s. The recorded data was transmitted to the main computer via a USB cable and stored on the drive for further analysis.
c. Procedure
The Balance eye system is meant to be used by trained clinicians, such as Ear, Nose, and Throat (ENT) specialists, neuro-vestibular specialists, neurologists, audiologists, or researchers. The experimental setup for VNG-based recording is presented in Figure 3. At the onset, the participants were given the prior basic information on the VNG equipment (Balance Eye), the purpose of the study, and the steps involved. The participant was instructed to position the head so that all the edges of the stimulation screen were visible only by moving the eyes (without moving the head) and to follow the target using only their eyes.
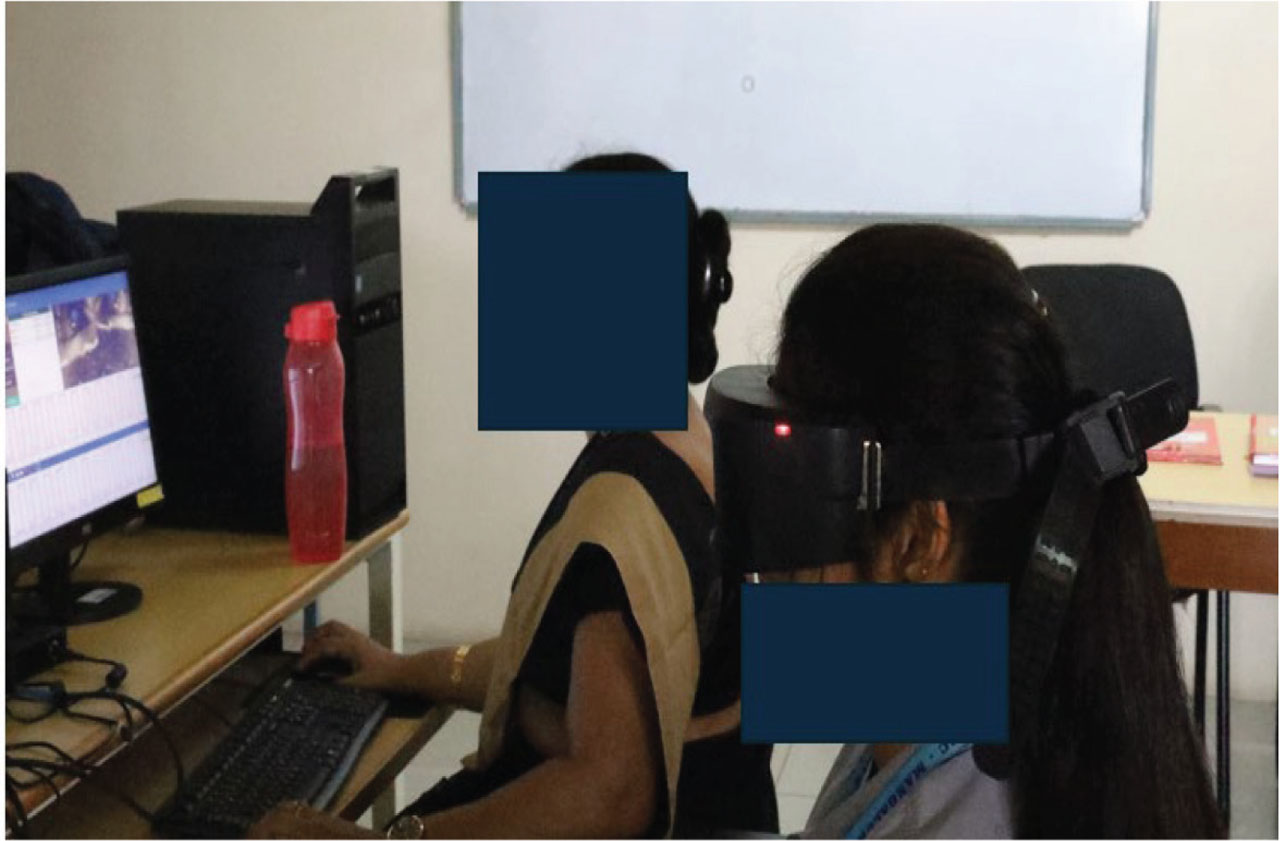
Figure 3:
Experimental setup for VNG-based eye-movement recording using the Balance Eye system, illustrating the participant seated in front of the visual stimulus display while wearing infrared video goggles for real-time acquisition of horizontal and vertical saccadic eye movements under controlled laboratory conditions. VNG, videonystagmography.
The tests were conducted in the morning session. Each test lasted 1 min. First, the system was calibrated with the pupil’s position. Next, the students moved their eyes to target locations on the screen. A dot (0.4 Hz) randomly appeared horizontally or vertically, and the student followed it while keeping their head stable (saccades test). Eye movement was captured in real-time and transferred to the main personal computer (PC). The Balance Eye software plotted a 2D graph of the eye movement relative to the target movement. The quantitative data and video recordings were saved, and a report was generated.
d. Ethical considerations and data privacy
Ethical approval for the study was obtained from the institutional research ethics committee before data collection. All participants provided written informed consent after being clearly informed about the purpose of the study, experimental procedures, and their rights as participants. Participation was completely voluntary, and students were allowed to withdraw from the study at any stage without any academic consequences.
To ensure data privacy and confidentiality, all recorded VNG data and academic performance records were anonymized using coded identifiers. No personally identifiable information was stored alongside the experimental data. The collected data were stored in password-protected systems accessible only to the research team. Video recordings were used strictly for scientific analysis and were not shared with third parties. These procedures were followed in accordance with standard ethical research guidelines for human-subject studies.
III. Results and Discussions
The quantitative recorded data consisted of the velocity, precision, and latency of the Horizontal and Vertical saccades of both the left and right eyes. The result obtained from the SPSS analysis is illustrated. Reliability of the measured parameters was confirmed using Cronbach’s alpha (Table 1). The Cronbach alpha value was found to be 0.738, suggesting that all 12 parameters have high internal consistency.
Table 1:
Reliability analysis of saccadic eye-movement parameters using Cronbach’s alpha.
| N | % | ||
|---|---|---|---|
| Cases | Valid | 36 | 100.0 |
| Excluded | 0 | 0.0 | |
| Total | 36 | 100.0 | |
| Reliability statistics | |||
| Cronbach’s alpha | Cronbach’s alpha based on standardized items | N of Items | |
| 0.738 | 0.846 | 12 | |
The reliability coefficient of 0.70 and above is acceptable in most social science research. To determine if a data set is well-modeled by a normal distribution, the normality checks on students’ performance and VNG data are performed. Table 2 shows the results of the normality check with only saccade latency and average marks. As the Lilliefors Significance Correction is 0.200, it is accepted that the data is distributed normally. A correlation check was performed to find the relationship between the variables. Inter-parameter relationships are examined in the Pearson correlation matrix (Table 3). Three stages of analysis were carried out. RQ1 is investigated by testing hypotheses 1 and 2. RQ2 is investigated by testing hypothesis 3. The hypothesis are as follows:
Hypothesis 1: There is no correlation between the VNG parameters. The alternative hypothesis is that there exists a correlation between the VNG parameters.
Hypothesis 2: The eye movements of male and female students did not vary. The hypothesis alternative is that there is a significant difference in the male and female student’s eye movement.
Hypothesis 3: Vertical and horizontal saccade latencies for both the right and left eyes do not significantly predict student performance. The hypothesis alternative is- Vertical and/or horizontal saccade latencies for the right and/or left eyes significantly predict student performance.
Table 2:
Normality assessment of saccadic latency and academic performance scores.
| Tests of normality on saccades latency | Shapiro–Wilk | |||||
|---|---|---|---|---|---|---|
| Kolmogorov–Smirnova | ||||||
| Statistic | df | Sig. | Statistic | df | Sig. | |
| Saccades latency | 0.090 | 36 | 0.200* | 0.974 | 36 | 0.537 |
| Tests of normality on average marks | Shapiro–Wilk | |||||
|---|---|---|---|---|---|---|
| Kolmogorov–Smirnova | ||||||
| Statistic | df | Sig. | Statistic | df | Sig. | |
| Average marks | 0.094 | 36 | 0.200* | 0.980 | 36 | 0.742 |
Hypothesis 1 is supported by Table 3. It is observed from the results that a strong correlation exists between the left and right eyes for saccades and horizontal right eye velocity. The values for saccades horizontal right and left eye velocity (r = 0.823, p < 0.01), precision (r = 0.866, p < 0.01), and latency (r = 0.892, p < 0.01), respectively. Similarly, for saccades vertical right and left eye velocity (r = 0.797, p < 0.01), precision (r = 0.858, p < 0.01), and latency (r = 0.938, p < 0.01), respectively, High correlations are found between the corresponding parameters of the right and left eyes, indicating that movements and precision in one eye are strongly related to the other eye for both horizontal and vertical movements. Significant correlations between horizontal and vertical parameters suggest a strong interdependency between these movements in both the right and left eyes. The precision of eye movements also tends to correlate with velocity, suggesting that higher-velocity movements may come with changes in precision. The latency of one eye correlates with the latency of the other eye but shows weak or no significant correlation with velocity and precision, indicating that latency might be a more independently varying parameter.
Table 3:
Pearson correlation matrix of horizontal and vertical saccadic parameters.
| SHRV | SHRP | SHRL | SHLV | SHLP | SHLL | SVRV | SVRP | SVRL | SVLV | SVLP | SVLL | ||
|---|---|---|---|---|---|---|---|---|---|---|---|---|---|
| SHRV | Pearson correlation | 1 | 0.679** | −0.150 | 0.823** | 0.448** | −0.202 | 0.508** | 0.357* | −0.366* | 0.311 | 0.230 | −0.403* |
| Sig. (two-tailed) | 0.000 | 0.383 | 0.000 | 0.006 | 0.238 | 0.002 | 0.033 | 0.028 | 0.065 | 0.178 | 0.015 | ||
| N | 36 | 36 | 36 | 36 | 36 | 36 | 36 | 36 | 36 | 36 | 36 | 36 | |
| SHRP | Pearson correlation | 0.679** | 1 | 0.242 | 0.770** | 0.866** | 0.207 | 0.426** | 0.474** | −0.152 | 0.426** | 0.363* | −0.161 |
| Sig. (two-tailed) | 0.000 | 0.156 | 0.000 | 0.000 | 0.225 | 0.009 | 0.003 | 0.376 | 0.010 | 0.029 | 0.349 | ||
| N | 36 | 36 | 36 | 36 | 36 | 36 | 36 | 36 | 36 | 36 | 36 | 36 | |
| SHRL | Pearson correlation | −0.150 | 0.242 | 1 | 0.013 | 0.380* | 0.892** | 0.044 | 0.284 | 0.453** | 0.139 | 0.315 | 0.511** |
| Sig. (two-tailed) | 0.383 | 0.156 | 0.941 | 0.022 | 0.000 | 0.800 | 0.093 | 0.005 | 0.419 | 0.061 | 0.001 | ||
| N | 36 | 36 | 36 | 36 | 36 | 36 | 36 | 36 | 36 | 36 | 36 | 36 | |
| SHLV | Pearson correlation | 0.823** | 0.770** | 0.013 | 1 | 0.697** | 0.031 | 0.456** | 0.450** | −0.169 | 0.364* | 0.380* | −0.238 |
| Sig. (two-tailed) | 0.000 | 0.000 | 0.941 | 0.000 | 0.856 | 0.005 | 0.006 | 0.325 | 0.029 | 0.022 | 0.163 | ||
| N | 36 | 36 | 36 | 36 | 36 | 36 | 36 | 36 | 36 | 36 | 36 | 36 | |
| SHLP | Pearson correlation | 0.448** | 0.866** | 0.380* | 0.697** | 1 | 0.396* | 0.291 | 0.560** | 0.118 | 0.395* | 0.577** | 0.066 |
| Sig. (two-tailed) | 0.006 | 0.000 | 0.022 | 0.000 | 0.017 | 0.085 | 0.000 | 0.494 | 0.017 | 0.000 | 0.702 | ||
| N | 36 | 36 | 36 | 36 | 36 | 36 | 36 | 36 | 36 | 36 | 36 | 36 | |
| SHLL | Pearson correlation | −0.202 | 0.207 | 0.892** | 0.031 | 0.396* | 1 | 0.024 | 0.295 | 0.491** | 0.118 | 0.339* | 0.495** |
| Sig. (two-tailed) | 0.238 | 0.225 | 0.000 | 0.856 | 0.017 | 0.888 | 0.081 | 0.002 | 0.493 | 0.043 | 0.002 | ||
| N | 36 | 36 | 36 | 36 | 36 | 36 | 36 | 36 | 36 | 36 | 36 | 36 | |
| SVRV | Pearson correlation | 0.508** | 0.426** | 0.044 | 0.456** | 0.291 | 0.024 | 1 | 0.770** | −0.141 | 0.797** | 0.588** | −0.155 |
| Sig. (two-tailed) | 0.002 | 0.009 | 0.800 | 0.005 | 0.085 | 0.888 | 0.000 | 0.414 | 0.000 | 0.000 | 0.367 | ||
| N | 36 | 36 | 36 | 36 | 36 | 36 | 36 | 36 | 36 | 36 | 36 | 36 | |
| SVRP | Pearson correlation | 0.357* | 0.474** | 0.284 | 0.450** | 0.560** | 0.295 | 0.770** | 1 | 0.118 | 0.754** | 0.858** | 0.105 |
| Sig. (two-tailed) | 0.033 | 0.003 | 0.093 | 0.006 | 0.000 | 0.081 | 0.000 | 0.492 | 0.000 | 0.000 | 0.544 | ||
| N | 36 | 36 | 36 | 36 | 36 | 36 | 36 | 36 | 36 | 36 | 36 | 36 | |
| SVRL | Pearson correlation | −0.366* | −0.152 | 0.453** | −0.169 | 0.118 | 0.491** | −0.141 | 0.118 | 1 | 0.053 | 0.245 | 0.938** |
| Sig. (two-tailed) | 0.028 | 0.376 | 0.005 | 0.325 | 0.494 | 0.002 | 0.414 | 0.492 | 0.759 | 0.151 | 0.000 | ||
| N | 36 | 36 | 36 | 36 | 36 | 36 | 36 | 36 | 36 | 36 | 36 | 36 | |
| SVLV | Pearson correlation | 0.311 | 0.426** | 0.139 | 0.364* | 0.395* | 0.118 | 0.797** | 0.754** | 0.053 | 1 | 0.716** | 0.027 |
| Sig. (two-tailed) | 0.065 | 0.010 | 0.419 | 0.029 | 0.017 | 0.493 | 0.000 | 0.000 | 0.759 | 0.000 | 0.874 | ||
| N | 36 | 36 | 36 | 36 | 36 | 36 | 36 | 36 | 36 | 36 | 36 | 36 | |
| SVLP | Pearson correlation | 0.230 | 0.363* | 0.315 | 0.380* | 0.577** | 0.339* | 0.588** | 0.858** | 0.245 | 0.716** | 1 | 0.179 |
| Sig. (two-tailed) | 0.178 | 0.029 | 0.061 | 0.022 | 0.000 | 0.043 | 0.000 | 0.000 | 0.151 | 0.000 | 0.295 | ||
| N | 36 | 36 | 36 | 36 | 36 | 36 | 36 | 36 | 36 | 36 | 36 | 36 | |
| SVLL | Pearson correlation | −0.403* | −0.161 | 0.511** | −0.238 | 0.066 | 0.495** | −0.155 | 0.105 | 0.938** | 0.027 | 0.179 | 1 |
| Sig. (two-tailed) | 0.015 | 0.349 | 0.001 | 0.163 | 0.702 | 0.002 | 0.367 | 0.544 | 0.000 | 0.874 | 0.295 | ||
| N | 36 | 36 | 36 | 36 | 36 | 36 | 36 | 36 | 36 | 36 | 36 | 36 |
SHLL, saccade horizontal left eye latency; SHLP, saccade horizontal left eye precision; SHLV, saccade horizontal left eye velocity; SHRL, saccade horizontal right eye latency; SHRP, saccade horizontal right eye precision; SHRV, saccade horizontal right eye velocity; SVLL, saccade vertical left eye latency; SVLP, saccade vertical left eye precision; SVLV, saccade vertical left eye velocity; SVRL, saccade vertical right eye latency; SVRP, saccade vertical right eye precision; SVRV, saccade vertical right eye velocity.
Hypothesis 2 is supported by Table 4. Gender differences in saccadic metrics were evaluated using the independent sample t-tests reported in Table 4. Both horizontal and vertical of right and left eyes saccades data show significant differences (p < 0.05). After assessing the results significant differences were found between the two groups.
Table 4:
Independent sample t-Test results comparing saccadic eye-movement parameters by gender.
| Levene’s test for equality of variances | t-Test for equality of means | |||||||||
|---|---|---|---|---|---|---|---|---|---|---|
| F | Sig. | t | df | Sig. (two-tailed) | Mean difference | Std. error difference | 95% confidence interval of the difference | |||
| Lower | Upper | |||||||||
| SHRV | Equal variances assumed | 913.363 | 0.000 | 15.209 | 5337 | 0.000 | 26.00878 | 1.71005 | 22.65639 | 29.36117 |
| Equal variances not assumed | 14.635 | 3,665.988 | 0.000 | 26.00878 | 1.77715 | 22.52448 | 29.49307 | |||
| SHRP | Equal variances assumed | 250.421 | 0.000 | 7.471 | 5,337 | 0.000 | 2.28499 | 0.30586 | 1.68538 | 2.88460 |
| Equal variances not assumed | 7.212 | 3,813.823 | 0.000 | 2.28499 | 0.31685 | 1.66379 | 2.90619 | |||
| SHRL | Equal variances assumed | 45.024 | 0.000 | −18.683 | 5,337 | 0.000 | −17.27987 | 0.92492 | −19.09309 | −15.46666 |
| Equal variances not assumed | −18.514 | 4,979.906 | 0.000 | −17.27987 | 0.93332 | −19.10958 | −15.45016 | |||
| SHLV | Equal variances assumed | 357.325 | 0.000 | 26.236 | 5,337 | 0.000 | 44.13396 | 1.68218 | 40.83620 | 47.43172 |
| Equal variances not assumed | 25.441 | 4,025.262 | 0.000 | 44.13396 | 1.73477 | 40.73285 | 47.53507 | |||
| SHLP | Equal variances assumed | 842.819 | 0.000 | 9.795 | 5,337 | 0.000 | 3.85816 | 0.39388 | 3.08599 | 4.63033 |
| Equal variances not assumed | 9.349 | 3,305.847 | 0.000 | 3.85816 | 0.41269 | 3.04900 | 4.66732 | |||
| SHLL | Equal variances assumed | 270.582 | 0.000 | −6.851 | 5,337 | 0.000 | −7.04183 | 1.02782 | −9.05677 | −5.02688 |
| Equal variances not assumed | −6.744 | 4,718.012 | 0.000 | −7.04183 | 1.04409 | −9.08874 | −4.99491 | |||
| SVRV | Equal variances assumed | 273.269 | 0.000 | −2.671 | 5,337 | 0.008 | −4.91581 | 1.84023 | −8.52342 | −1.30820 |
| Equal variances not assumed | −2.614 | 4,450.120 | 0.009 | −4.91581 | 1.88068 | −8.60288 | −1.22874 | |||
| SVRP | Equal variances assumed | 416.645 | 0.000 | −0.751 | 5,337 | 0.453 | −0.27302 | 0.36367 | −0.98596 | 0.43991 |
| Equal variances not assumed | −0.724 | 3,756.542 | 0.469 | −0.27302 | 0.37719 | −1.01255 | 0.46650 | |||
| SVRL | Equal variances assumed | 6.181 | 0.013 | 8.238 | 5,337 | 0.000 | 10.49969 | 1.27453 | 8.00109 | 12.99829 |
| Equal variances not assumed | 8.205 | 5,138.282 | 0.000 | 10.49969 | 1.27973 | 7.99088 | 13.00850 | |||
| SVLV | Equal variances assumed | 18.519 | 0.000 | −8.608 | 5,337 | 0.000 | −14.37928 | 1.67038 | −17.65391 | −11.10466 |
| Equal variances not assumed | −8.651 | 5,313.766 | 0.000 | −14.37928 | 1.66219 | −17.63785 | −11.12072 | |||
| SVLP | Equal variances assumed | 223.709 | 0.000 | 7.777 | 5,337 | 0.000 | 3.61782 | 0.46521 | 2.70581 | 4.52983 |
| Equal variances not assumed | 7.581 | 4,277.298 | 0.000 | 3.61782 | 0.47720 | 2.68225 | 4.55339 | |||
| SVLL | Equal variances assumed | 33.708 | 0.000 | −2.404 | 5,337 | 0.016 | −3.22244 | 1.34057 | −5.85049 | −0.59438 |
| Equal variances not assumed | −2.409 | 5,279.145 | 0.016 | −3.22244 | 1.33751 | −5.84452 | −0.60035 | |||
[i] SHLL, saccade horizontal left eye latency; SHLP, saccade horizontal left eye precision; SHLV, saccade horizontal left eye velocity; SHRL, saccade horizontal right eye latency; SHRP, saccade horizontal right eye precision; SHRV, saccade horizontal right eye velocity; SVLL, saccade vertical left eye latency; SVLP, saccade vertical left eye precision; SVLV, saccade vertical left eye velocity; SVRL, saccade vertical right eye latency; SVRP, saccade vertical right eye precision; SVRV, saccade vertical right eye velocity.
These observations can be useful for understanding the dynamics of eye movements and the coordination between the right and left eyes in both horizontal and vertical directions. This can further help in developing models or diagnostics based on eye-tracking data.
a. Regression analysis
Saccades are the rapid eye movements to the visual stimulus. The abnormality in saccades offers important clues in the diagnosis [35]. The time course of horizontal saccades for both eyes is depicted in Figure 4. The green line is the position of a fixation target, and the red line (right eye) and blue line (left eye) are the positions of the fovea. The fovea is in the center of the retina. When the target moves suddenly to the right, there is a delay of about 200 ms before the eye begins to move to the new target position [36].
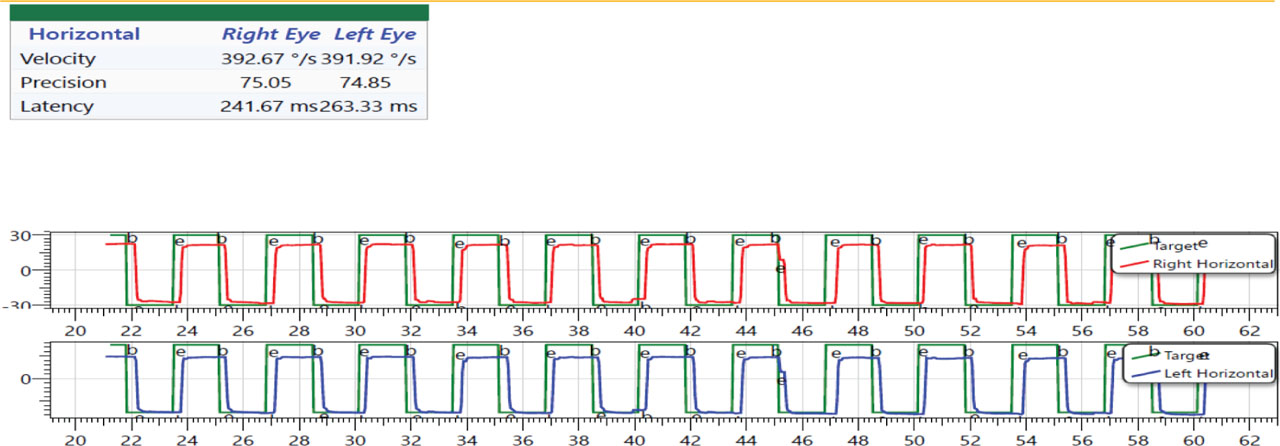
Figure 4:
Time-domain representation of horizontal saccadic eye movements for both the right and left eyes, showing the relative positions of the visual target (green trace), right eye foveal position (red trace), and left eye foveal position (blue trace), highlighting saccadic latency and accuracy during target shifts.
The following are the eye-movement parameters used in the tables: saccade horizontal right eye velocity (SHRV), saccade horizontal right eye precision (SHRP), saccade horizontal right eye latency (SHRL), saccade horizontal left eye velocity (SHLV), saccade horizontal left eye precision (SHLP), saccade horizontal left eye latency (SHLL), saccade vertical right eye velocity (SVRV), saccade vertical right eye precision (SVRP), saccade vertical right eye latency (SVRL), saccade vertical left eye velocity (SVLV), saccade vertical left eye precision (SVLP), and saccade vertical left eye latency (SVLL). The saccadic latency can be a marker for the brain’s speed. When a new target appears on the screen, its image is formed on the retina. This information is carried to the first-level preceptor in the brain, called the primary visual cortex, in the occipital region of the brain. This information is carried to the temporal lobe to determine what the image represents, and it is also carried to the parietal lobe to determine “where” the image is in the 3D space. The two pathways are therefore called “what pathway” and “where pathway” [37]. As this is determined by the brain, the eyes receive the command from the frontal lobe to move and to bring the image into the center of the retinal field for sharper perception. Latency is the time between the target’s appearance on the screen and the eye movement required to bring it to the retina’s center [38]. Thus, latency is one of the indicators of the brain’s processing speed [39]. The perception of cognitive and emotional engagement of a person is provided by eye movement or eye response to the stimuli. The same information could be related to the attentiveness of the students.
To draw inferences from the experimental data, the most widely used technique is Regression analysis [40]. Linear regression involves fitting a linear equation to the observed data to model the relationship between two variables. In this context, one variable (the dependent variable) is predicted based on the other variable (the independent variable). For each of the saccade latencies, the regression model computes the following linear regression equation:
where Y represents the dependent variable (average marks), and X is the independent variable (saccade latency). The regression model fits with average marks as the dependent variable and saccade latency (both horizontal and vertical, corresponding to left and right eye movements) as the independent variables. Table 5 includes coefficients α and β, correlation coefficients R and R2, F-statistic, p-value, and significance indicators for each parameter. Regression outcomes identifying significant predictors of academic performance are reported in Table 5.Table 5:
Linear regression analysis of saccadic latency measures as predictors of academic performance.
| Saccade parameter | α | β | R | R2 | F | P | Indicator |
|---|---|---|---|---|---|---|---|
| Horizontal saccade latency (R) | −0.101 | 44.510 | 0.334 | 0.112 | 4.268 | 0.047 | Significant |
| Horizontal saccade latency (L) | −0.071 | 40.604 | 0.245 | 0.06 | 2.175 | 0.149 | Insignificant |
| Vertical saccade latency (R) | −0.117 | 46.169 | 0.506 | 0.256 | 11.696 | 0.002 | Significant |
| Vertical saccade latency (L) | −0.106 | 45.358 | 0.496 | 0.246 | 11.089 | 0.002 | Significant |
The regression analysis in the table reveals that vertical saccades latency for both the right and left eye significantly predicts student performance, with p-values of 0.002, indicating strong statistical significance [41]. The horizontal saccades latency for the right eye is also statistically significant, with a p-value of 0.047. However, horizontal saccade latency for the left eye is not statistically significant (p-value of 0.149). These results suggest that vertical saccade latencies are more strongly correlated with student performance compared to horizontal saccade latencies.
The study has two main objectives: first, to analyze the VNG data for correlations between various parameters; and second, to explore the potential of using VNG data to apply advanced technology to traditional teaching methods, with the aim of enhancing instructional design and improving learning and testing methodologies. To substantiate this and to assess the impact of advanced digital technology in education system, the study explored to find the significant difference in the VNG data between male and female students and their academic performance score. The result is consistent with the previous findings [42, 43]. There was a significant difference between the VNG data i.e., saccade latency and the students’ academic scores. However, there was no significant difference found for left saccade latency. By considering the standard frequency of leftward and rightward saccades, the variation in the distribution is assumed to be symmetrical [44]. In contrast to the hypothesis, it was observed there existed a correlation between the saccade VNG data and the student performance, which indicated the student’s engagement in the learning process. The data provides convincing evidence that the slow learner data showed a delay in the saccade latency and vice versa. The average and standard deviation of the latency values recorded were 152 ± 35 ms in line with the previous work slightly lower than the previous reports of 200 ms [36]. The assessment of voluntary eye movements could be used to assess the students’ cognitive level [45]. With such visual perception research results, the teachers can improve the instructional design of learning and testing methodology. The challenges posed during eye tracking are illumination, viewing angle, occlusion of the eye, and the head position as suggested in line important to consider the student (46) participants, their health, mind set and involvement in the recording process. Since the tests are conducted continuously, the student might get exhausted observing the screen, which might affect their VNG data. As the recording would have been conducted at separate times for different students’ mental states, their age would also be the factors influencing the data [47, 48]. Moreover, this study’s rigorous approach incorporating statistical significance and relative errors sets a precedent for future research, promoting methodological rigor and precision. Nevertheless, the adoption of eye tracking devices in higher education may raise ethical considerations, such as privacy concerns and the need for informed consent. Proper guidelines and protocols should be established to ensure the responsible and ethical use of the technology in educational settings [49].
It is important to emphasize that the statistically significant correlations observed between saccadic latency and academic performance do not imply a direct causal relationship. While eye movement parameters reflect underlying cognitive processing speed and attentional control, academic performance is influenced by multiple factors, including motivation, instructional methods, prior knowledge, and environmental conditions. Therefore, the present findings should be interpreted as associative rather than causal. Future experimental and longitudinal studies are necessary to establish predictive or causal relationships.
b. Limitations and future scope
The present study has certain limitations that must be acknowledged [50]. First, the sample size was limited to 36 students from a single institution within a narrow age group (19–20 years), which restricts the generalizability of the findings across diverse academic and demographic populations. Second, data collection was performed under controlled laboratory conditions, which do not fully replicate real classroom environments where factors such as distractions, fatigue, emotional state, and multitasking may influence eye movements and learning behaviors. Third, the scope of eye-tracking parameters in this study was limited primarily to saccadic velocity, precision, and latency, while other important metrics such as fixation duration, pupil dilation, blink rate, and cognitive load indicators were not included.
Future work will focus on expanding the sample size across multiple institutions and academic disciplines to improve representativeness. Data collection in real classrooms and online learning environments will be explored to validate findings under natural learning conditions. The inclusion of additional eye-tracking parameters and multimodal physiological measures will provide deeper insights into student engagement and cognitive processing. Furthermore, longitudinal studies are planned to investigate whether eye-tracking metrics can predict long-term academic performance and learning outcomes. Since the experiments were conducted in a controlled laboratory environment, the effects of natural classroom conditions such as visual distractions, peer interaction, physical fatigue, and emotional engagement were not captured. These real-world factors may significantly influence eye-movement behavior and learning patterns. Thus, future studies conducted in live classroom settings will be more representative of actual learning dynamics.
IV. Conclusion
The article aimed to perform statistical analysis on the VNG data and the student’s academic performance score to analyze their significance over the other. This study also analyzed the significance of the data of both genders of students. The results showed that the VNG data of male and female students were significant. The results also showed robust evidence that there was strong correlation among the VNG data. The study found strong correlations between corresponding parameters of the right and left eyes, indicating synchronized movements and precision in both horizontal and vertical directions. Horizontal and vertical eye movements showed significant interdependency. The results suggest that gender has a significant effect on most of the eye-tracking parameters. The regression analysis revealed that vertical saccade latency for both the right and left eye significantly predicts student performance, with p-values of 0.002, indicating strong statistical significance. The horizontal saccade latency for the right eye is also statistically significant, with a p-value of 0.047. It is important to note that correlation indicates a statistical association between variables, whereas causation implies a direct cause–effect relationship; therefore, the observed correlations in this study do not establish causal inference. The research could be expanded to encompass a more comprehensive examination of the noteworthy features of digital technologies and their impact on the education system. This may entail exploring new teaching-learning tools in engineering education.
Acknowledgment
The authors extend their appreciation to Prince Sattam bin Abdulaziz University for funding this research work through the project number (PSAU/2025/01/37549).