
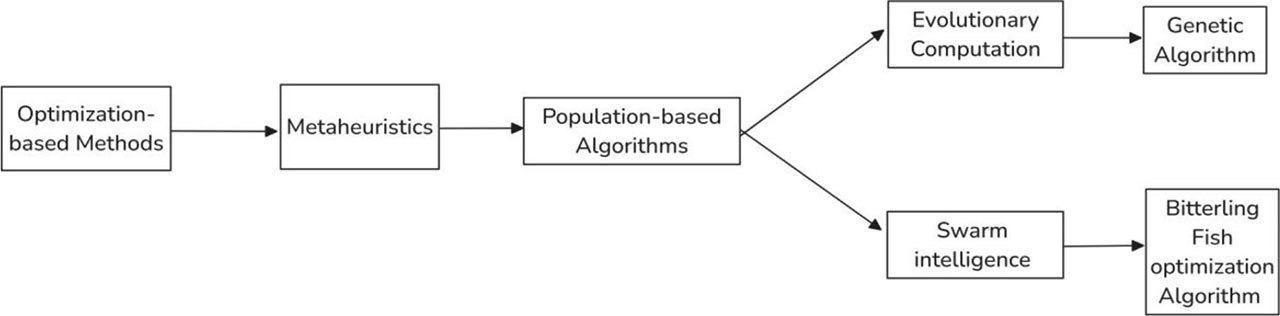
Figure 1:
Hierarchical overview of optimization based methods.
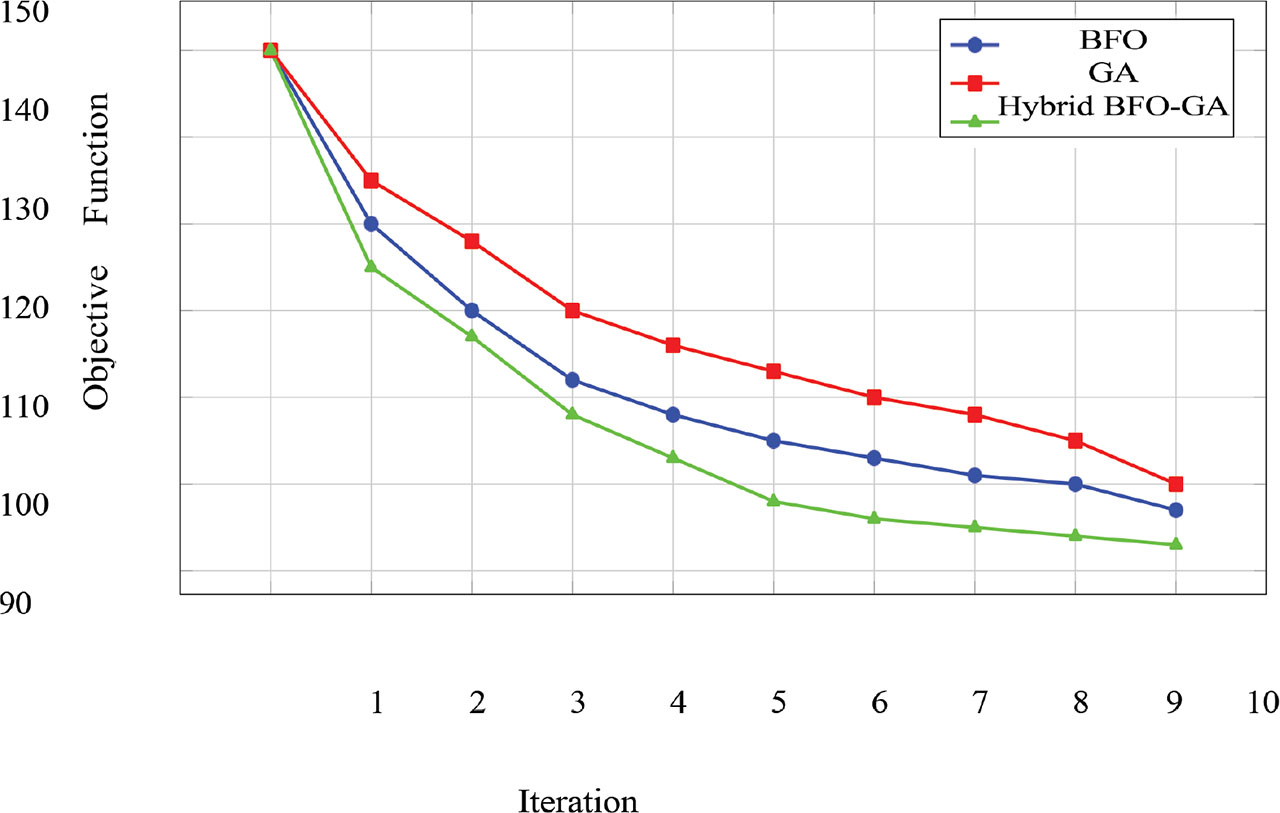
Figure 2:
The objective function value for BFO, GA, and the HBFO-GA models over time. BFO, bitterling fish optimization; GA, genetic algorithm.
Table 1:
Key characteristics of BFO
| Feature | BFO description |
|---|---|
| Search type | Stochastic directional movement |
| Exploration strength | High (wide search range) |
| Convergence speed | Slower compared to GA |
| Control parameters | Fewer (e.g., λ, chemotactic steps) |
| Best use case | Multimodal and continuous functions |
| Elitism | Not inherently supported |
| Adaptability | Can be hybridized with GA or PSO |
Table 2:
Comparison of performance metrics
| Metric | BFO | GA | Hybrid BFO-GA |
|---|---|---|---|
| Convergence time (s) | 120 | 95 | 70 |
| Final objective value | 97 | 100 | 93 |
| Iteration count | 10 | 10 | 10 |
| Computational cost (a.u.) | 1.0 | 0.8 | 0.7 |
| Accuracy (%) | 92 | 90 | 94 |
Table 3:
Performance comparison of metaheuristics algorithms
| Metric | PSO | DE | Firefly | HBFO-GA |
|---|---|---|---|---|
| Convergence time (s) | 82 | 79 | 85 | 70 |
| Final objective value | 96 | 95 | 98 | 93 |
| Computational cost (a.u.) | 0.85 | 0.82 | 0.87 | 0.70 |
| Accuracy (%) | 91 | 92 | 89 | 94 |
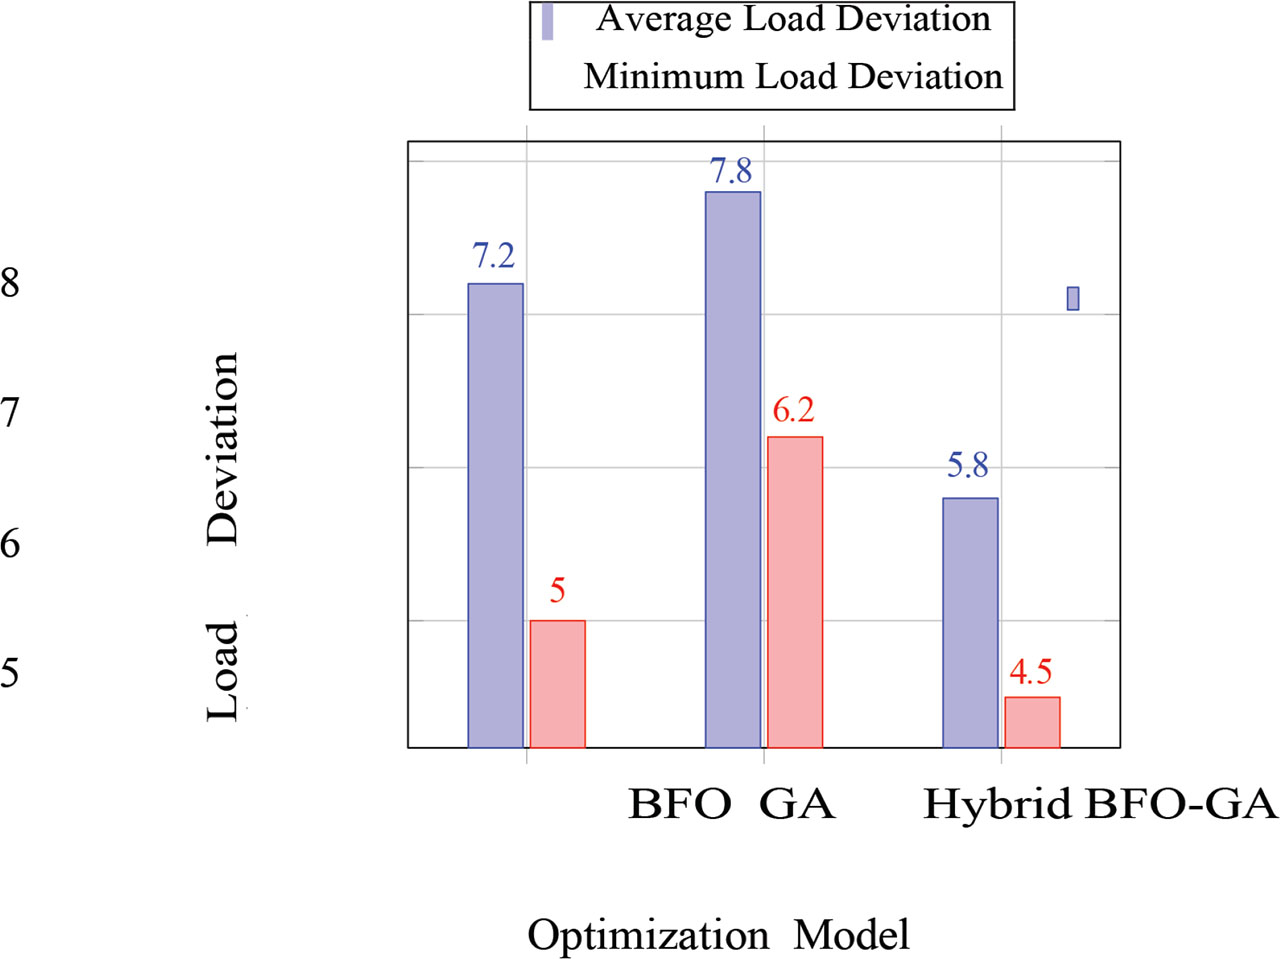
Figure 3:
Grouped bar chart of average and minimum load deviation for BFO, GA, and HBFO-GA models. BFO, bitterling fish optimization; GA, genetic algorithm.
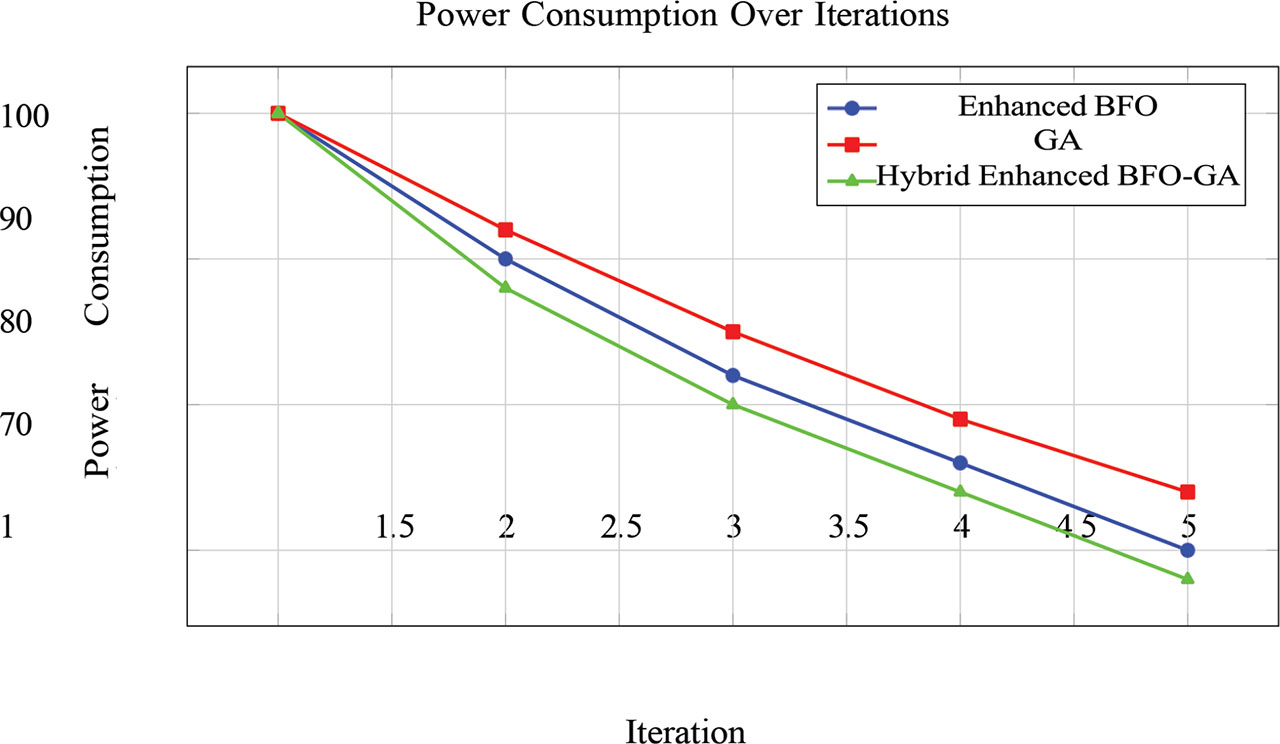
Figure 4:
Trend of power consumption over iterations for the enhanced BFO, GA, and hybrid enhanced BFO-GA models. BFO, bitterling fish optimization; GA, genetic algorithm.