
Table 1:
Literature survey summary
| Study/authors | Key focus/contribution | Key features/applications | Year |
|---|---|---|---|
| IoT in Healthcare [1,2,3,4] | Real-time health monitoring with IoT, enabling remote patient | Flexible monitoring at any time and place | 2015, 2021, 2023, 2018 |
| Tonello et al. [5] | Sensing platform for remote healthcare | Targeted at elderly care | 2024 |
| Sharma et al. [6] | Schizophrenia Detection Cap (SczCap) | Wearable cap for EEG signal acquisition and precise schizophrenia detection | 2023 |
| Zhang et al. [7] | Portable wearable cardiorespiratory sensor | Integrated with a smartphone; measures RR and HR | 2024 |
| Priya et al. [8] | IoT-based pervasive monitoring systems | Three-layer architecture: sensing layer, transport layer, and application layer | 2019 |
| Pardeshi et al. [9] | Health monitoring system for detecting abnormalities | Captures blood pressure, temperature, and ECG data; uses GSM or Wi-Fi for alerts | 2017 |
| Divakaran et al. [10] | Multi-sensor system with live video feeds and parameter reporting for remote patient monitoring | Enhanced doctor–patient communication | 2017 |
| Uddin et al. [11] | ICU monitoring with cloud-connected sensors for real-time tracking | Supported simultaneous monitoring of multiple patients | 2017 |
| Bouslama et al. [12] | Adopted AWS for real-time alerts without data | Reduced dependency on local storage resources | 2019 |
| Stradolini et al. [13] | Smartwatch-based monitoring | Critical patient management | 2017 |
| Basu et al. [18,19,20] | Developed IoT systems for non-invasive health parameter monitoring | Addressed healthcare needs in wearable systems. Focused on recent IoT systems | 2020 |
| Jana et al. [21–22] | Focused on IoT-based COVID-19 tracking | Non-invasive and effective tracking during the pandemic | 2021, 2022 |
| Chooruang and Mangkalakeeree [23] | Integrated MQTT protocol for lightweight communication in HR monitoring systems | Simplified communication and reduced latency | 2016 |
| Hussain et al. [24] | Accelerated KNN classifiers on FPGA for ensemble classification | Enhanced classification performance in IoT frameworks | 2012 |
| Vieira et al. [25] | Proposed flexible streaming KNN classifier for embedded FPGA-SoCs | Optimized for IoT systems | 2019 |
| Samiee et al. [26] and Danopoulos et al. [27] | Focused on enhancing KNN classification through optimization | Improved classification accuracy and speed | 2018, 2019 |
| Wang et al. [28] | Outdoor monitoring system for elderly individuals | Transmits physiological signals and fall events to healthcare centers | 2016 |
| Bharadwaj et al [29] | Review of ML algorithms in H-IoT systems | Compilation of state-of-the-art ML applications in IoT healthcare | 2021 |
| Gupta et al. [32] | System using Intel Galileo 2nd board for temperature and HR monitoring | Monitors temperature and HR; lacks ECG integration | 2016 |
Table 2:
Dataset for the proposed system
| Index | Subject | Session | Age group | Day | HR (bpm) | SpO2 | Temp (°F) |
|---|---|---|---|---|---|---|---|
| 0 | S1 | Morning (rest) | A | Day 1 | 79 | 98 | 103 |
| 1 | S1 | Morning (rest) | A | Day 2 | 76 | 97 | 98 |
| 2 | S1 | Morning (rest) | A | Day 3 | 74 | 97 | 9 0 |
| 3 | S1 | Morning (rest) | A | Day 4 | 75 | 98 | 100 |
| 4 | S1 | Morning (rest) | A | Day 5 | 72 | 96 | 92 |
| … | … | … | … | … | … | … | … |
| 895 | S10 | Evening (normal) | C | Day 6 | 81 | 98 | 110 |
| 896 | S10 | Evening (normal) | C | Day 7 | 79 | 96 | 108 |
| 897 | S10 | Evening (normal) | C | Day 8 | 86 | 96 | 90 |
| 898 | S10 | Evening (normal) | C | Day 9 | 91 | 81 | 95 |
| 899 | S10 | Evening (normal) | C | Day 10 | 87 | 96 | 97 |
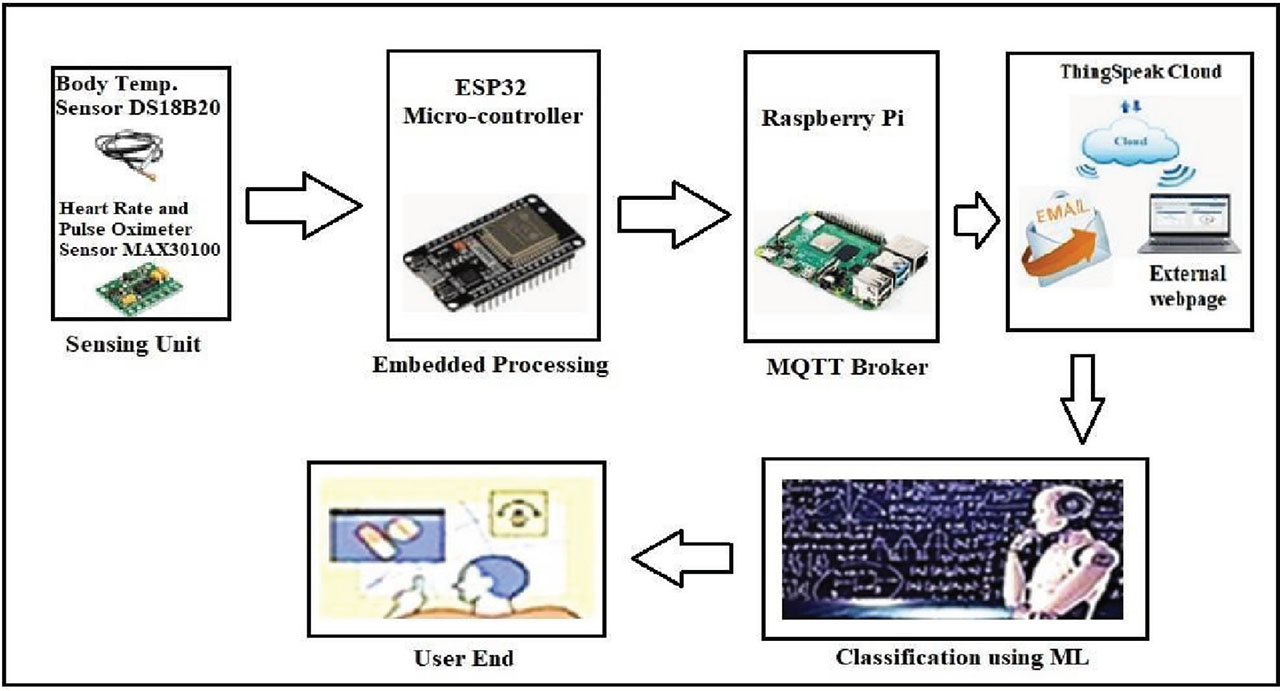
Figure 1:
Proposed MQTT and ML-based health monitoring system. ML, machine learning; MQTT, message queuing telemetry transport.
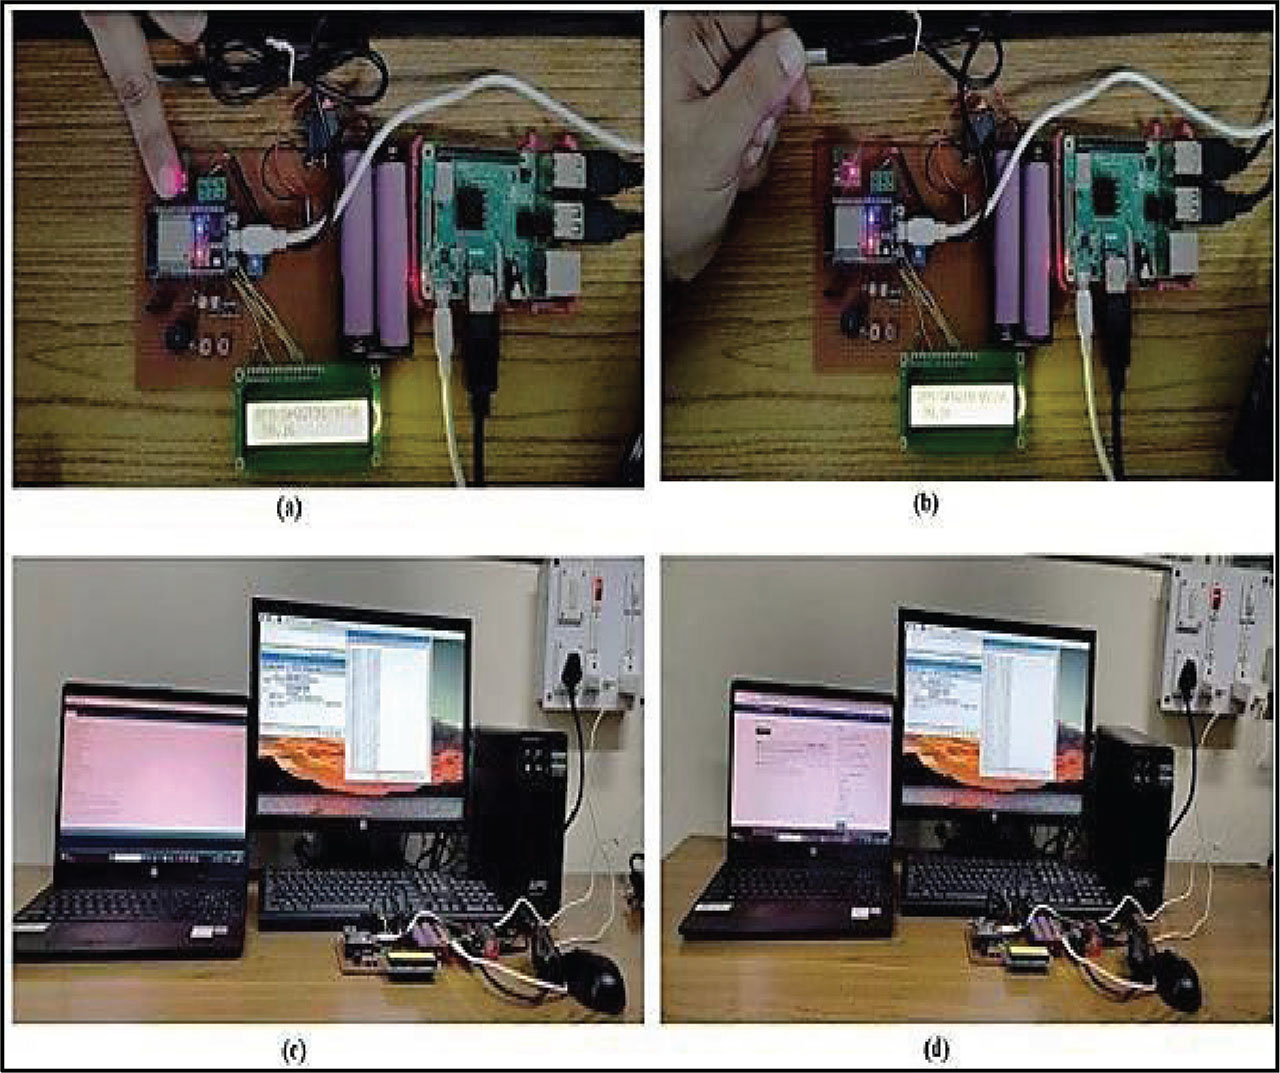
Figure 2:
Hardware implementation of the proposed MQTT and ML-based smart health monitoring system (A) SPO2-HR monitoring (B) body temperature monitoring (C, D) overall experimental set up. ML, machine learning; MQTT, message queuing telemetry transport.
Table 3:
Vital health parameters displayed locally and on the cloud (ThingSpeak)
| Vital parameter | Session | Displayed on LCD | Uploaded to ThingSpeak cloud |
|---|---|---|---|
| Body temperature | Morning | 96.35°F, 96.51°F | 96.35°F, 96.51°F |
| Afternoon | 98.24°F, 97.20°F | 98.24°F, 97.20°F | |
| Evening | 98.57°F, 96.24°F, | 98.57°F, 96.24°F, 97.13°F | |
| HR | Morning | 78 bpm, 86 bpm | 78 bpm, 86 bpm |
| Afternoon | 74 bpm, 80 bpm, 76 | 74 bpm, 80 bpm, 76 bpm | |
| Evening | 68 bpm, 89 bpm, 93 | 68 bpm, 89 bpm, 93 bpm | |
| SpO2 | Morning | 98%, 97% | 98%, 97% |
| Afternoon | 96%, 81% | 96%, 81% | |
| Evening | 95%, 96% | 95%, 96% |
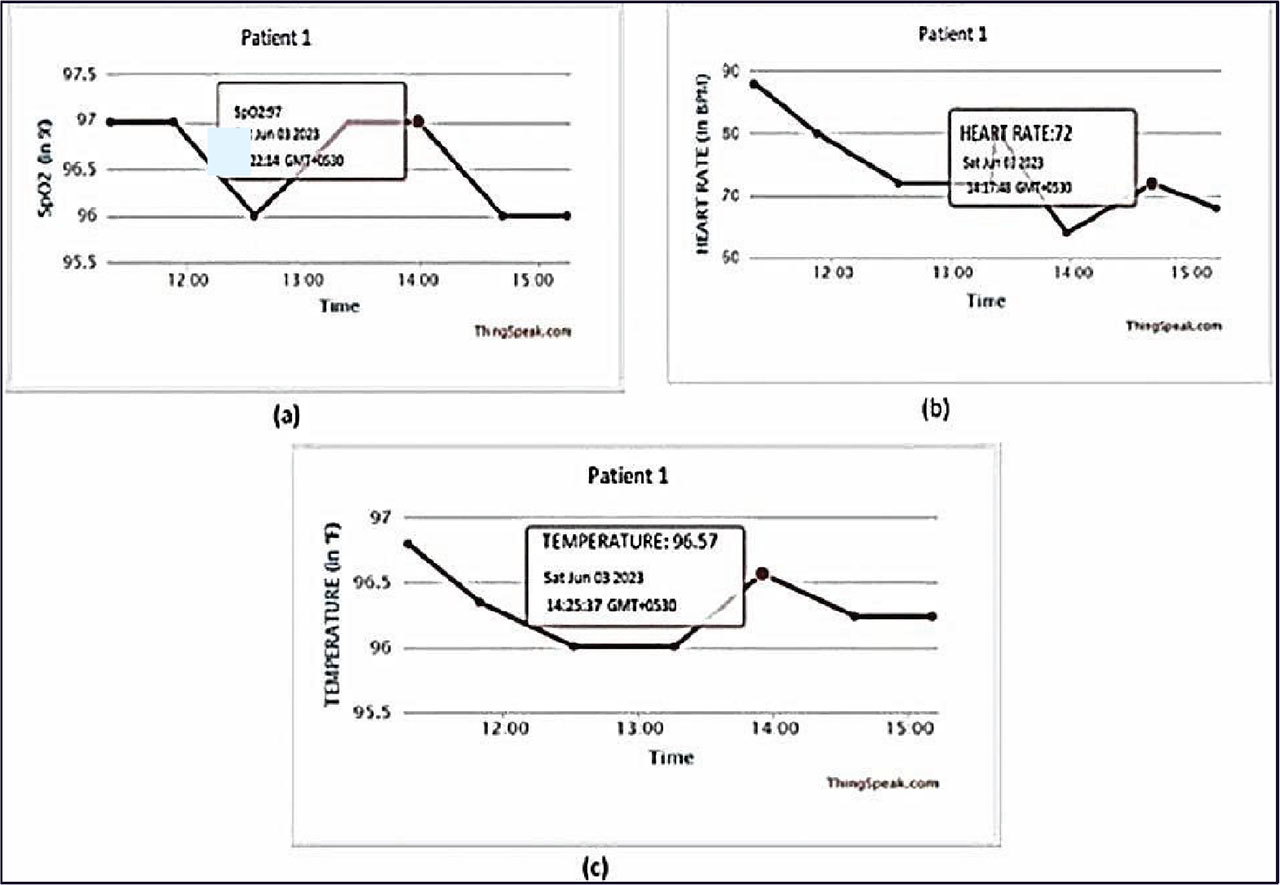
Figure 3:
Graphs showing monitoring (A) SpO2, (B) HR, and (C) body temperature of a patient. HR, heart rate; SpO2, blood oxygen saturation.
Table 4:
Comparison table of accuracy and precision for three different classifiers
| Health parameters | Accuracy (%) | Precision | ||||
|---|---|---|---|---|---|---|
| Classifiers | KNN | DT | SVM | KNN | DT | SVM |
| HR | 98.88 | 42.78 | 48.33 | 0.97 | 0.35 | 0.18 |
| SpO2 | 87.22 | 51.66 | 58.33 | 0.87 | 0.51 | 0.36 |
| Body temperature | 90.55 | 98.67 | 95.06 | 0.91 | 0.97 | 0.96 |
Table 5:
Comparison table of F1 score and recall for three different classifiers
| Health parameters | F1 score | Recall | ||||
|---|---|---|---|---|---|---|
| Classifiers | KNN | DT | SVM | KNN | DT | SVM |
| HR | 0.98 | 0.21 | 0.20 | 0.98 | 0.32 | 0.36 |
| SpO2 | 0.90 | 0.39 | 0.40 | 0.92 | 0.50 | 0.56 |
| Body temperature | 0.93 | 0.92 | 0.96 | 0.94 | 0.93 | 0.97 |
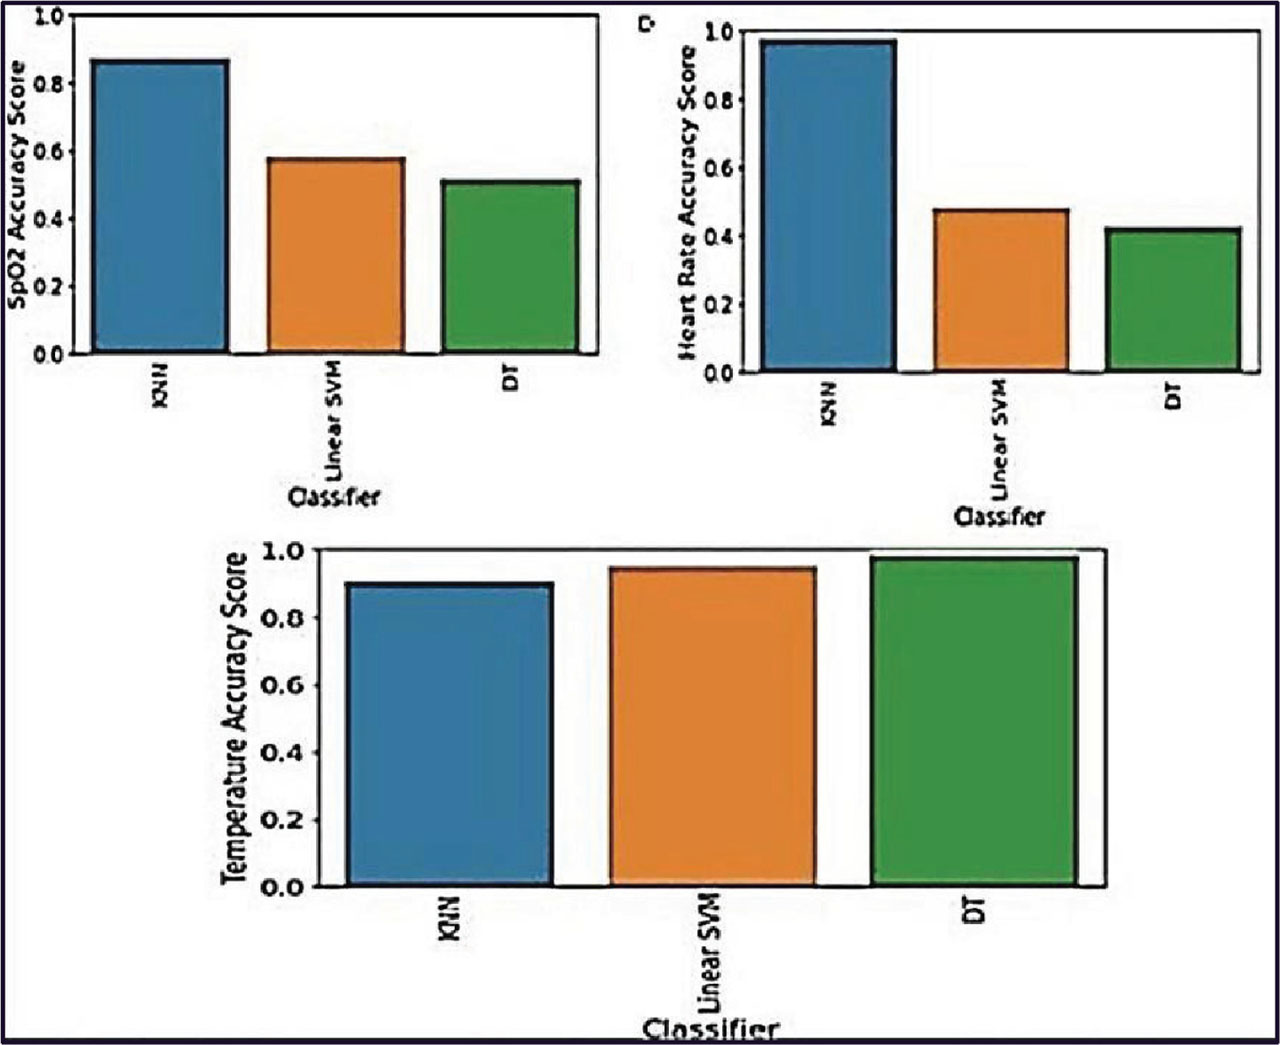
Figure 4:
Graphical representation of accuracy for three different classifiers. DT, decision tree; SVM, support vector machine.
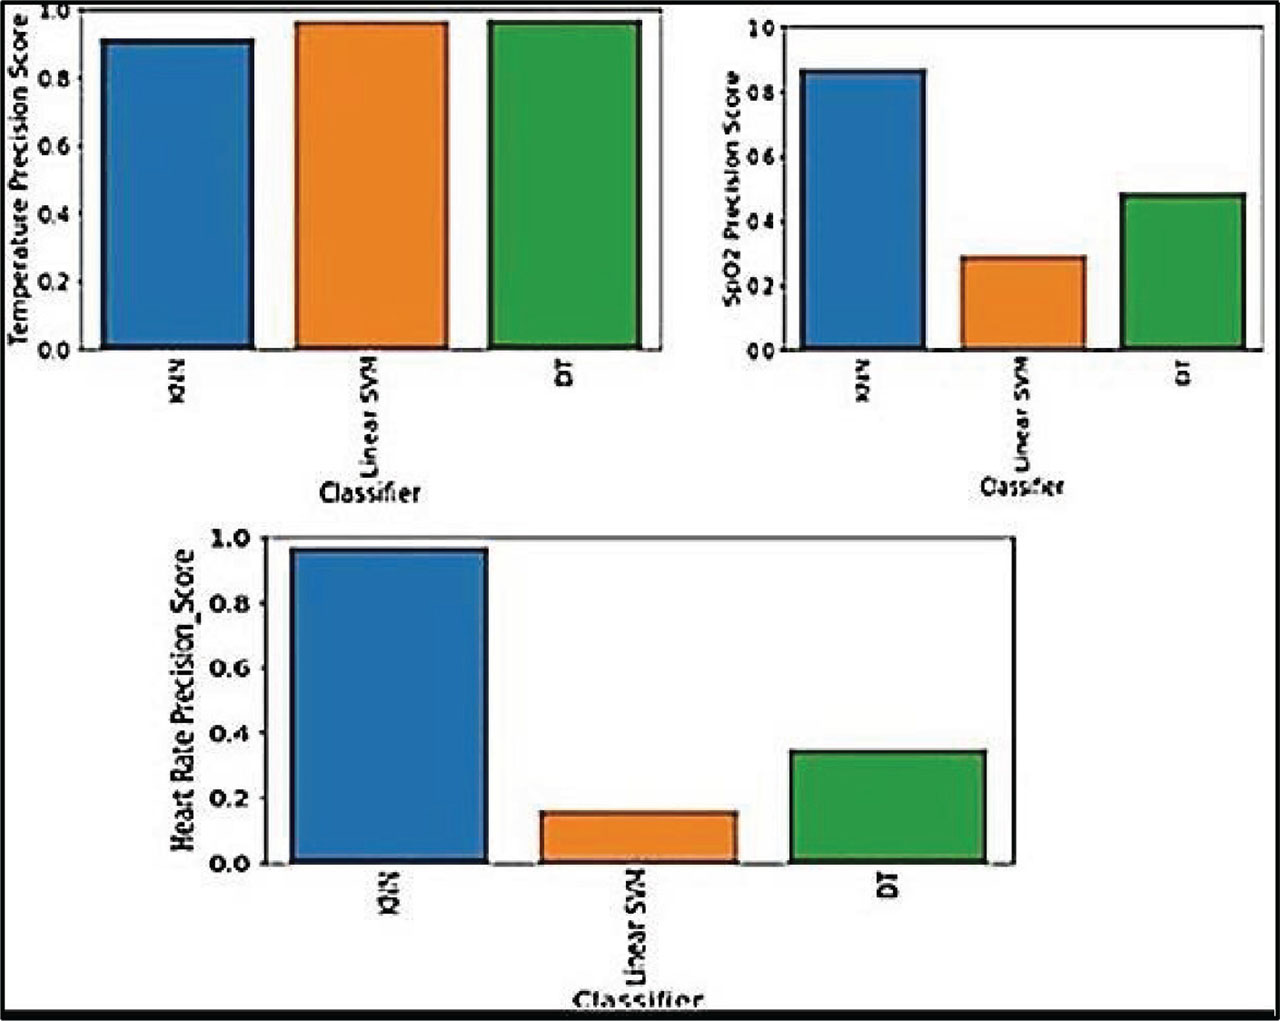
Figure 5:
Graphical representation of precision for three different classifiers. DT, decision tree; SVM, support vector machine.
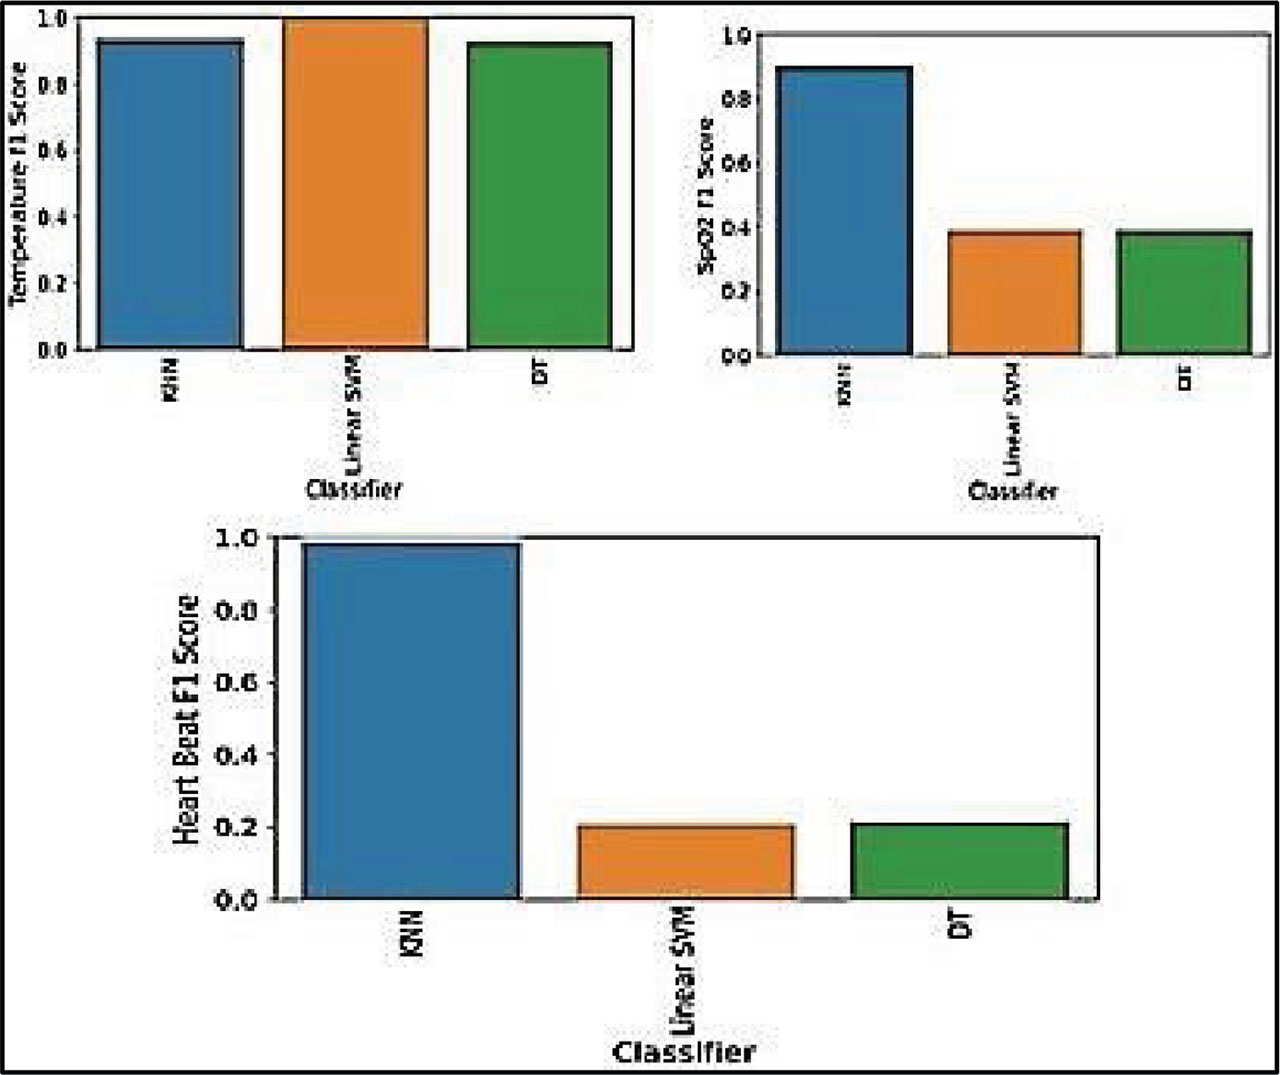
Figure 6:
Graphical representation of F1 scores for three different classifiers. DT, decision tree; KNN, K-nearest neighbors.
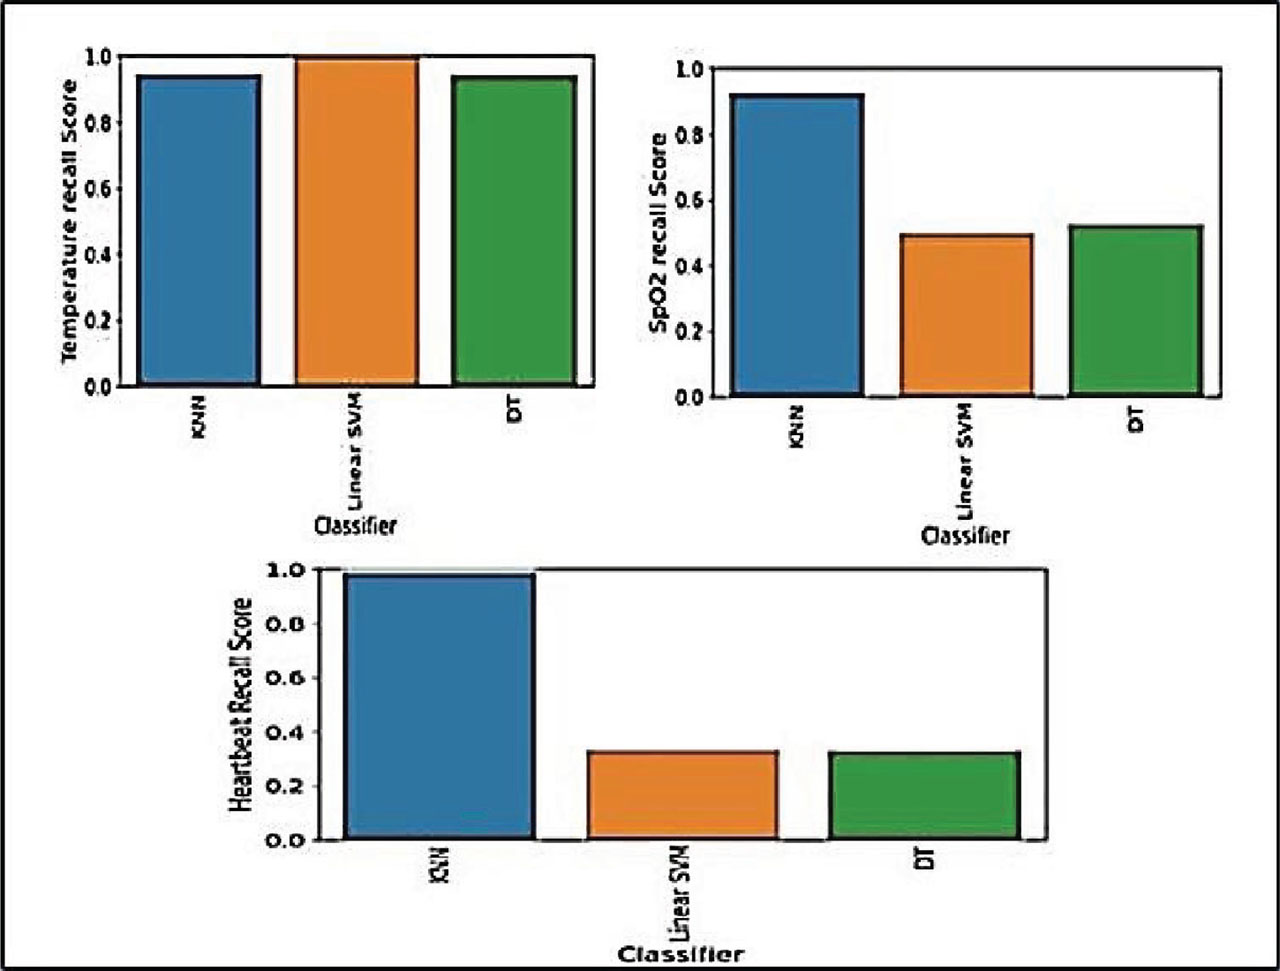
Figure 7:
Graphical representation of recall for three different classifiers. DT, decision tree; SVM, support vector machine.
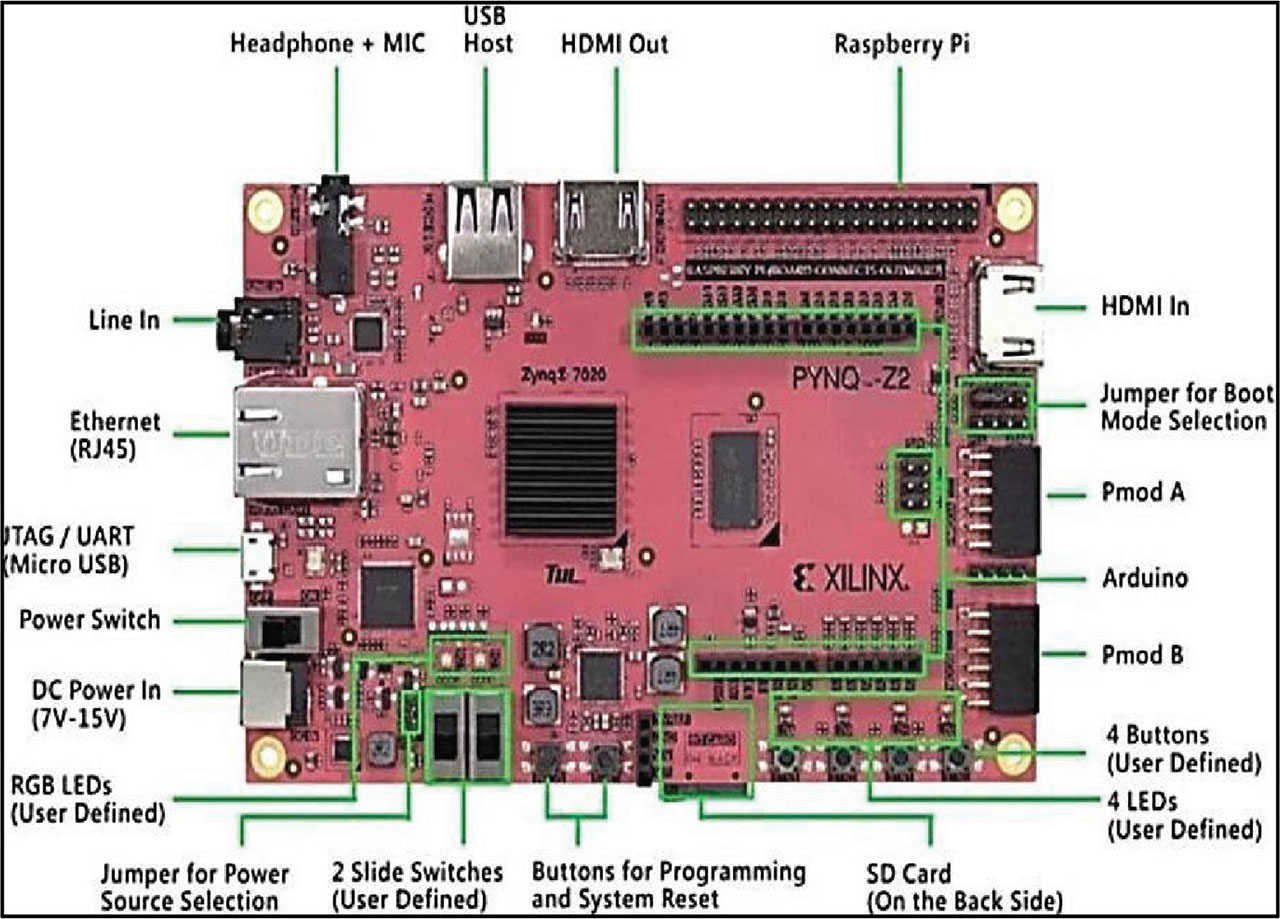
Figure 8:
PYNQ Z2 FPGA board.
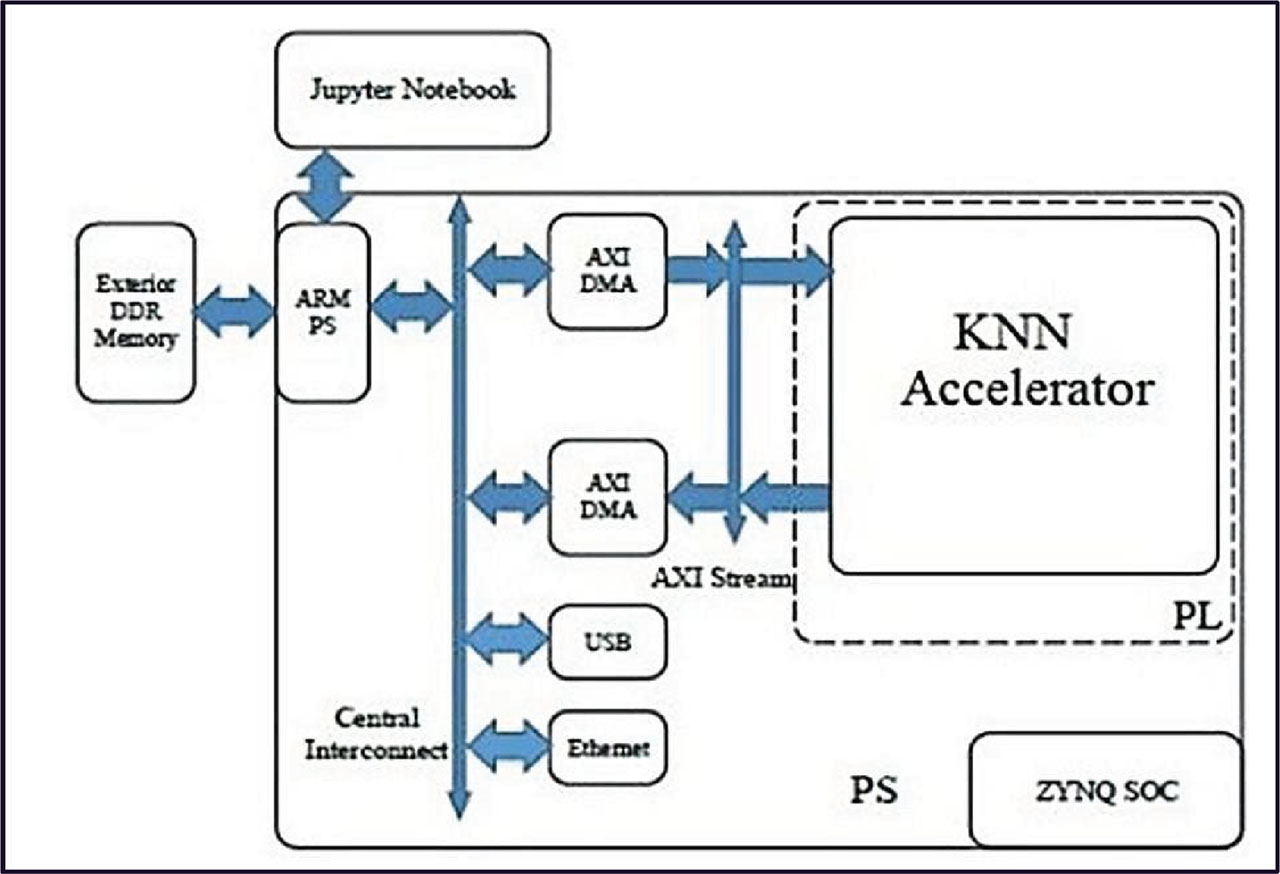
Figure 9:
KNN accelerator data path diagram. KNN, K-nearest neighbors; PL, programmable logic; PS, programmable system.
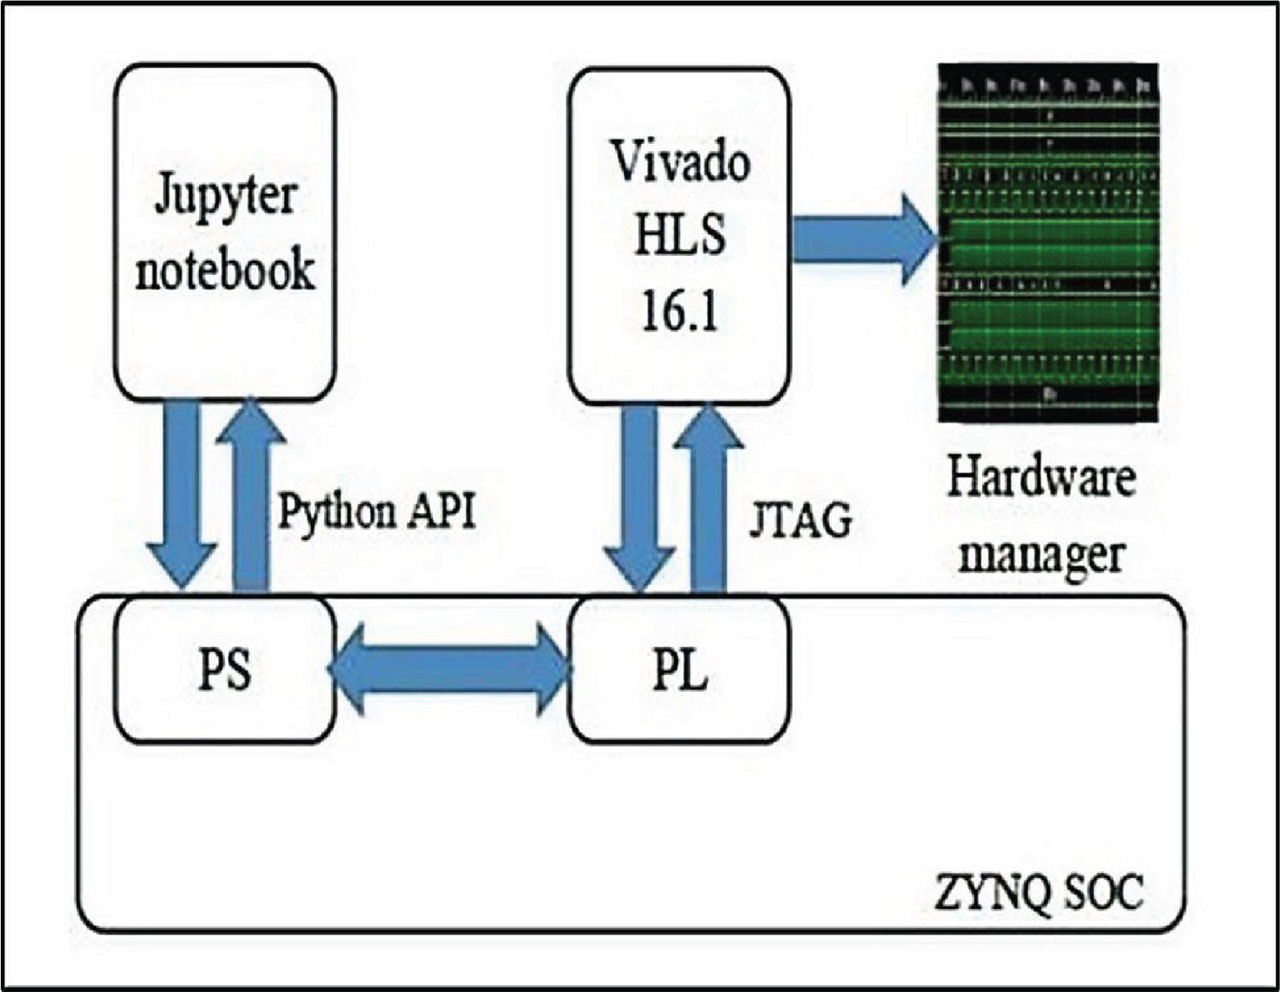
Figure 10:
Joint simulation system. PL, programmable logic; PS, programmable system.
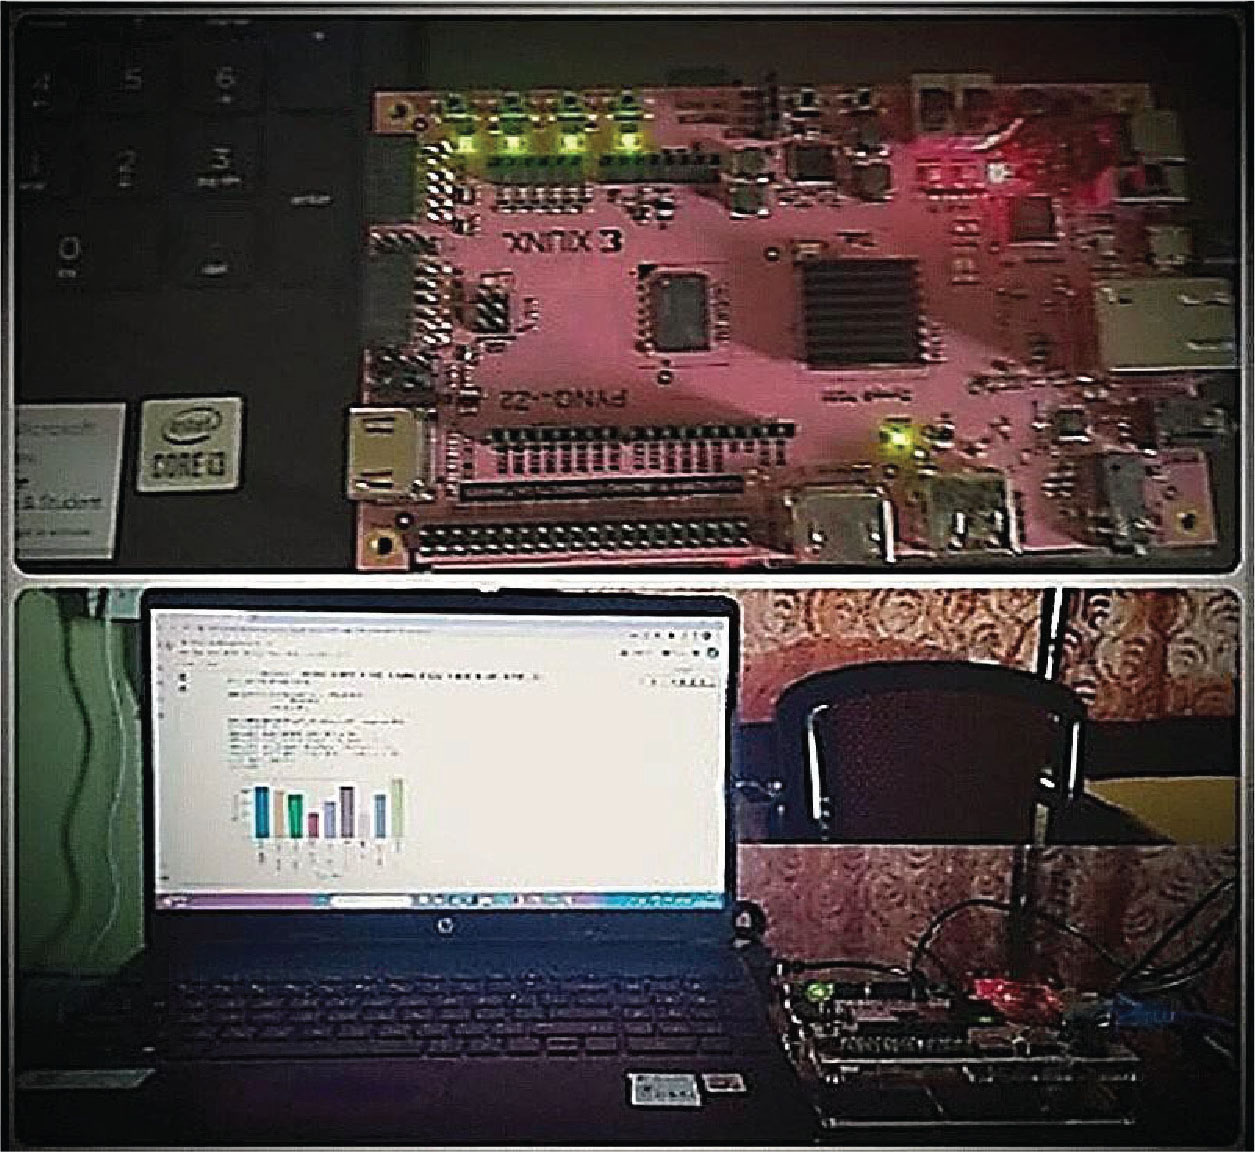
Figure 11:
Presents the experimental setup for the FPGA-based implementation.
Table 6:
FPGA implementation results for KNN and SVM
| Design parameters | KNN | SVM |
|---|---|---|
| Classification accuracy (overall in %) | 85.55 | 62.22 |
| Frequency (MHz) | 100.07 | 32.28 |
| BRAM | 4 | 5 |
| DSP48E | 10 | 10 |
| FF | 3,493 | 3,999 |
| LUTs | 2,826 | 3,022 |
| Power consumption (W) | 0.228 | 0.414 |
Table 7:
Comparison of proposed FPGA implementation results for KNN and SVM with existing similar research work
| Research work/hardware (FPGA) platform | Classifiers | Accuracy (%) | Freq. (MHz) | Power (W) | BRAM | DSP’s | LUT | FF’s | Cost |
|---|---|---|---|---|---|---|---|---|---|
| PYNQ-Z2 (proposed work) | KNN | 85.55 | 100 | 0.228 | 4 | 10 | 3,493 | 2,826 | Low power/cost optimized |
| SVM | 62.22 | 32.28 | 0.414 | 5 | 10 | 3,999 | 3,022 | ||
| Virtex-7 implement KNN Algorithm on FPGA [48] | KNN | - | 3.136 | 512 | 12 | 23,892 | 11,838 | High cost | |
| ZYNQ-SOC Melanoma detection based on FPGA (2019) [49] | SVM | 97.9 | 1.69 | - | - | - | - | ∼3% of FPGA resource usage and costly | |
| Kintex-7 FPGA implementation on of breast Cancer (2023) [50] | SVM | 91.08 | 4.57 | - | - | - | - | High end FPGA. Costly. | |
| PYNQ-Z2 Real-time breast cancer Classification (2025) [51] | CNN | 89.87 | 1.4 | ∼65% of BRAM usage | ∼72% of DSP usage | ∼68% of LUT usage | - | High resource usage and moderate cost |