
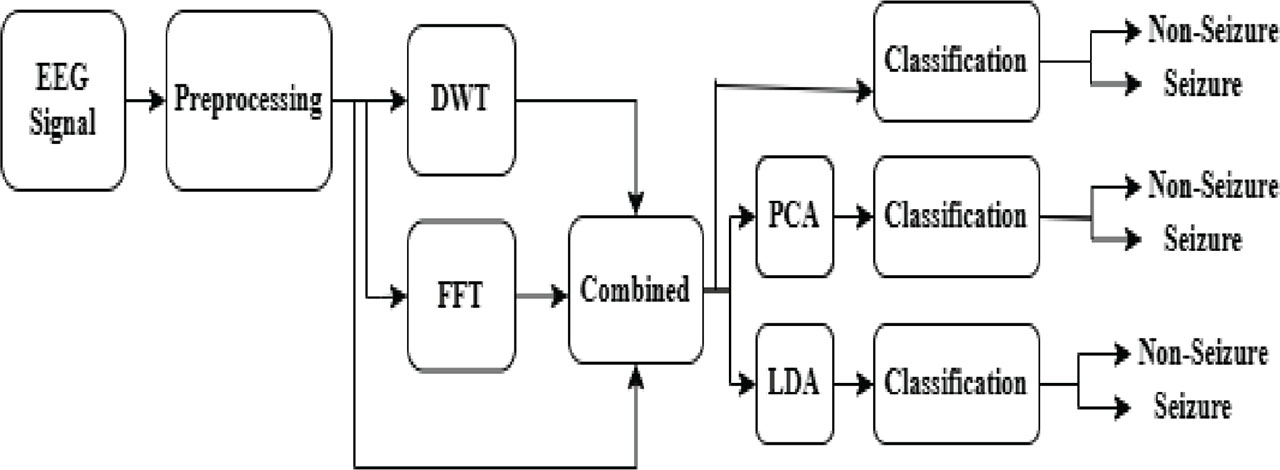
Figure 1:
Proposed model of epilepsy detection process. DWT, discrete wavelet transform; EEG, electroencephalogram; FFT, fast Fourier transform; LDA, linear discriminant analysis; PCA, principal component analysis.
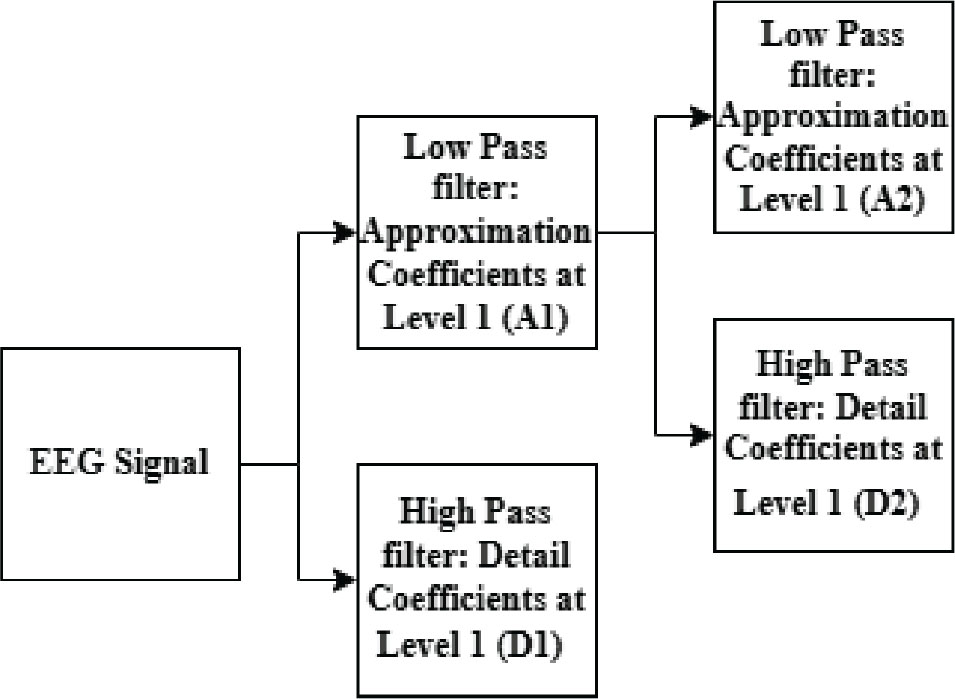
Figure 2:
DWT decomposition up to level two (2). DWT, discrete wavelet transform; EEG, electroencephalogram.
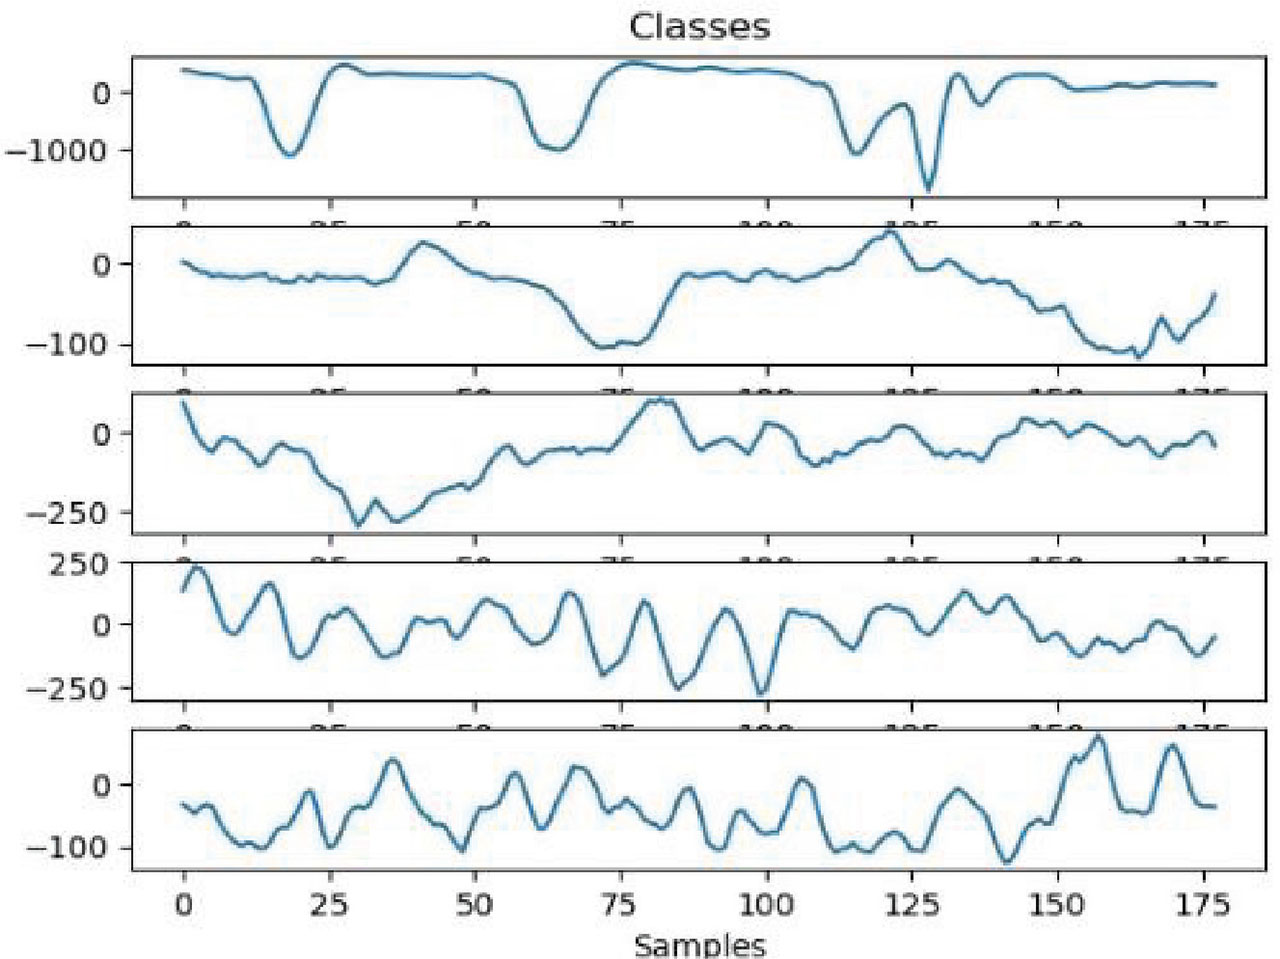
Figure 3:
Samples of EEG signals of 5 different classes. EEG, electroencephalogram.
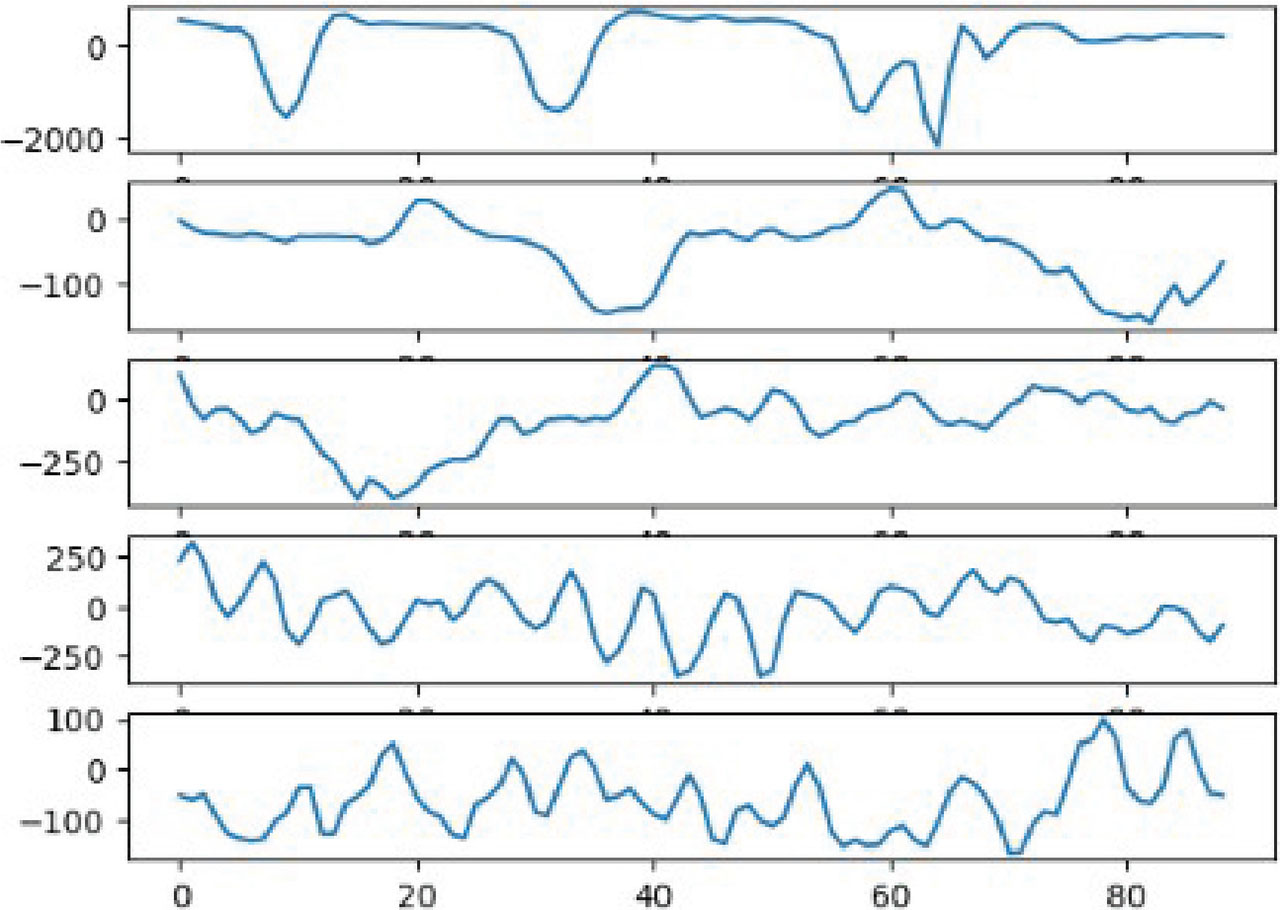
Figure 4:
Samples of A1 after applying DWT of 5 different classes. DWT, discrete wavelet transform.
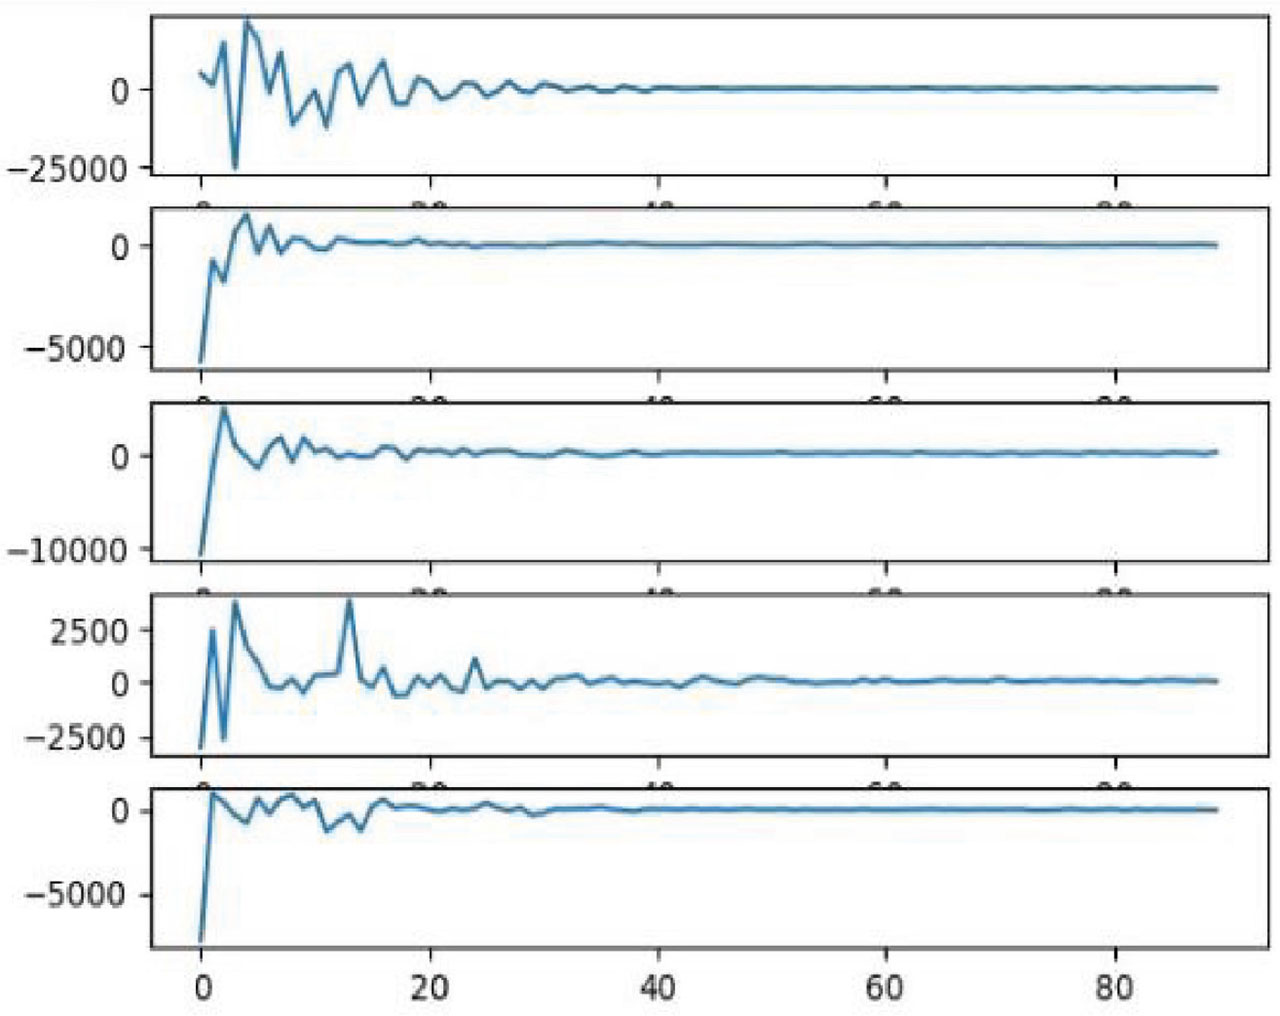
Figure 5:
Samples of EEG signal after application of FFT for 5 different classes. EEG, electroencephalogram; FFT, fast Fourier transform.
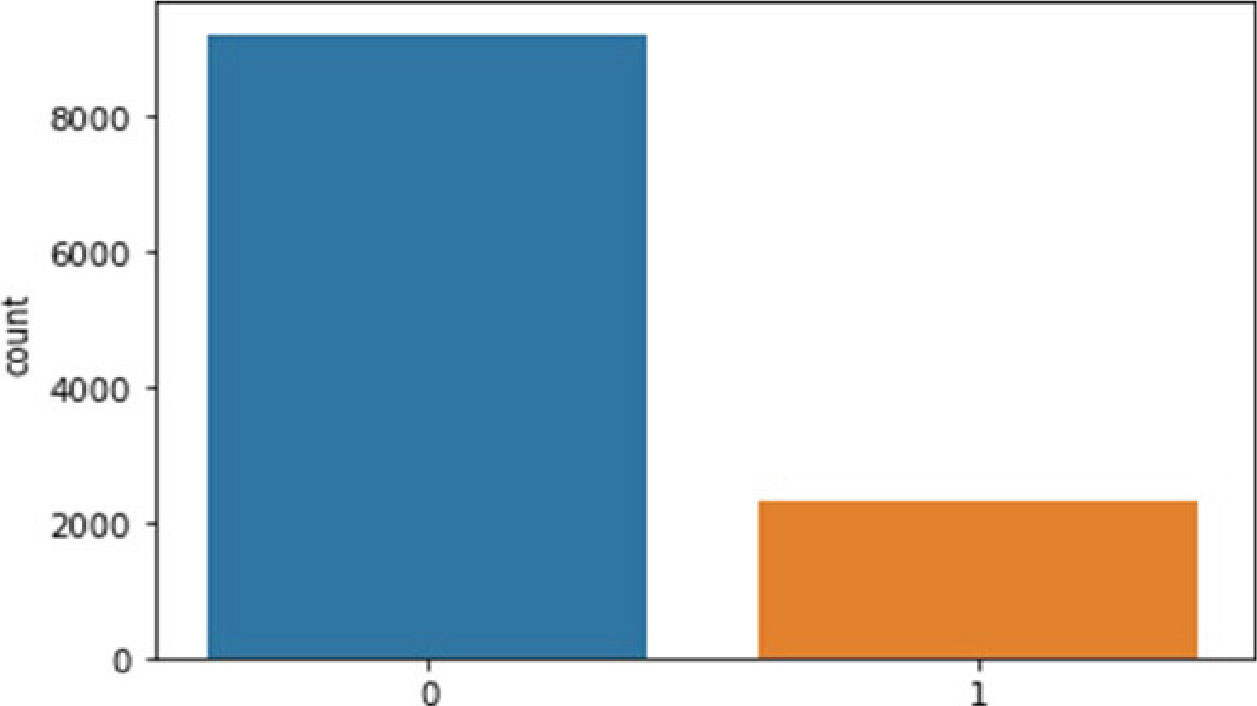
Figure 6:
Bar chart of total number of samples non-seizure and seizure.
Table 1:
Performance measure of case 3 (combined features)
| Algorithm | Accuracy | Precision | Recall | F-1 Score |
|---|---|---|---|---|
| LR | 0.98 | 0.96 | 0.96 | 0.96 |
| K-NN | 0.95 | 0.96 | 0.89 | 0.92 |
| SVM | 0.95 | 0.96 | 0.89 | 0.92 |
Table 2:
Performance measure of case 1 (combined features + PCA)
| Algorithm | Accuracy | Precision | Recall | F-1 Score |
|---|---|---|---|---|
| LR | 0.99 | 0.99 | 0.97 | 0.98 |
| K-NN | 0.98 | 0.97 | 0.96 | 0.97 |
| SVM | 0.98 | 0.97 | 0.96 | 0.97 |
Table 3:
Performance measure of case 2 (combined features + LDA)
| Algorithm | Accuracy | Precision | Recall | F-1 Score |
|---|---|---|---|---|
| LR | 0.97 | 0.96 | 0.92 | 0.94 |
| K-NN | 0.96 | 0.96 | 0.90 | 0.92 |
| SVM | 0.96 | 0.96 | 0.90 | 0.92 |