
Table 1:
Work done by different researchers in similar domain
| Ref. No. | Methodology used | Domain | Dataset used | Performance/outcome |
|---|---|---|---|---|
| [1] | Linear regression, Lasso, random forest | Salary prediction for Data Science Job | Kaggle—Glassdoor | MAE: For random forest—11.22, for linear regression—18.86, for ridge regression—19.67 |
| [2] | SVM | Skill based job recommendation system | Job portals, company websites, scraping data from other online sources | Accuracy, precision, recall, and F1 score was calculated |
| [3] | Bidirectional, decoder-encoder, stacked, Conv LSTM | Trend analysis system to predict future job markets using historical data | Web scraping, manually collecting data, government sources | Accuracy: for bidirectional LSTM—95.71%, for decoder– encoder LSTM—91.56%, for stacked LSTM—87.24%, for Conv LSTM—83.7% |
| [4] | NB, KNN, NBST | Predictive analysis | Student employment in the employment market of Chongqing S colleges and universities in the past 3 years | Mean value [test time (ms)]: NB—18.607, KNN—22.224, NBST—49.026 |
| [5] | MNB, SVM, DT, KNN, RF | Job posting classification | Kaggle, titled by “[real or fake] fake job posting prediction” | For MNB 95.6%, for SVM 97.7%, for DT 97.4%, for KNN 97.8%, for 98.2%, for RF 98.2% |
| [6] | LR, SVM, KNN, DT, RF, AdaBoost(DT), GB, voting classifier soft & hard, XGBoost | Campus placement analyzer: Using supervised machine learning algorithms | Training and placement department of MIT which consists of all the students of Bachelor of Engineering (B.E) from three different colleges of their campus | Accuracy: Logistic Regression 58%, support vector machine 69%, KNN 63.22%, decision tree 69%, random forest 75.25%, AdaBoost(DT) 77%, gradient boosting 77%, voting classifier soft 69.11%, voting classifier hard 68.43%, XGBoost 78% |
| [7] | Voting classifier | Ensemble approach for classifying job positions | Glassdoor website | For voting classifier soft—100% |
| [8] | NB, SGD, LR, KNN, RF classifier | Detecting and preventing fake job offers | Kaggle—real/fake job posting prediction | For random forest classifier—97.48% |
| [9] | NLP, KNN | Resume-based job recommendation system using NLP and deep learning | Combined from multiple sources | Improving the efficiency and success rate of the hiring process |
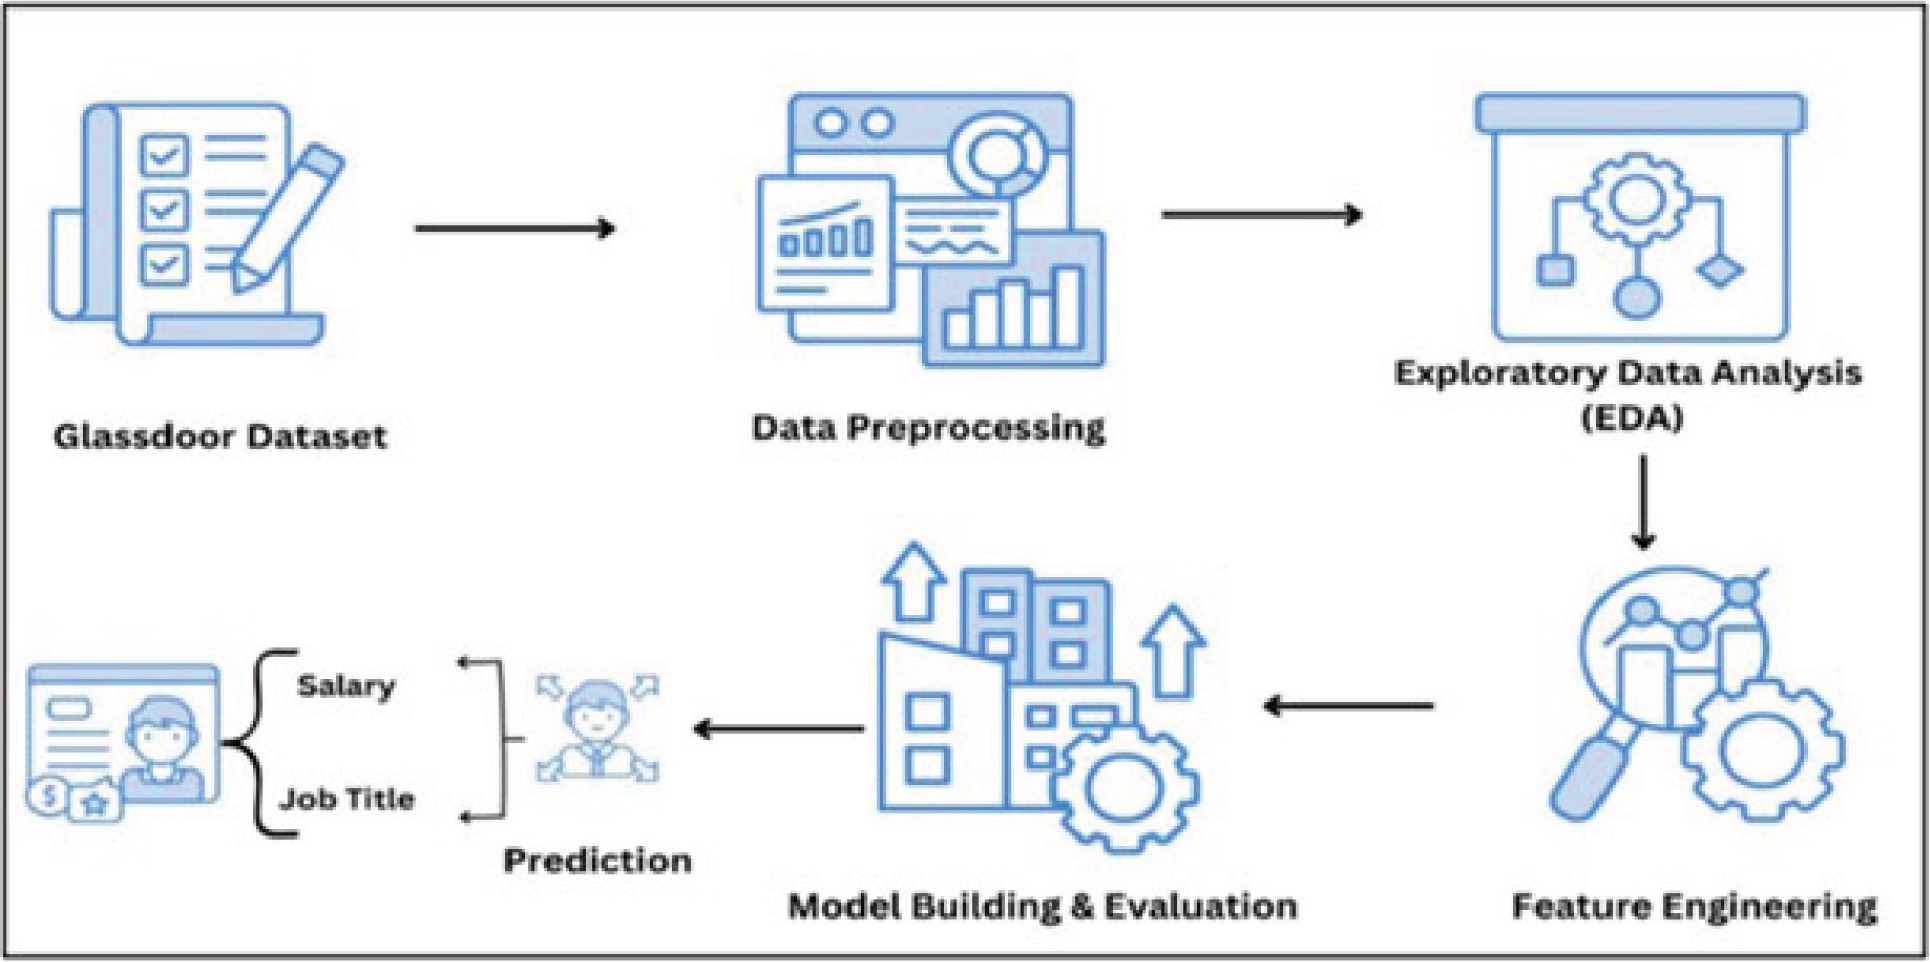
Figure 1:
Methodology of proposed work. EDA, exploratory data analysis.
Table 2:
Description of attributes present in dataset
| S. No. | Name of attribute | Description |
|---|---|---|
| 1. | Job title |
|
| 2. | Salary estimate | The estimated salary range for the job provided by Glassdoor/Employer |
| 3. | Job description | The full description of the job, including roles, responsibilities, and qualifications |
| 4. | Rating | Rating of the company, from employee reviews on Glassdoor. Initial reviews range from −1 to 5 |
| 5. | Company name |
|
| 6. | Location |
|
| 7. | Size |
|
| 8. | Founded | The year the company was founded |
| 9. | Type of ownership |
|
| 10. | Industry |
|
| 11. | Sector |
|
| 12. | Revenue | The estimated annual revenue of the company in US$ |
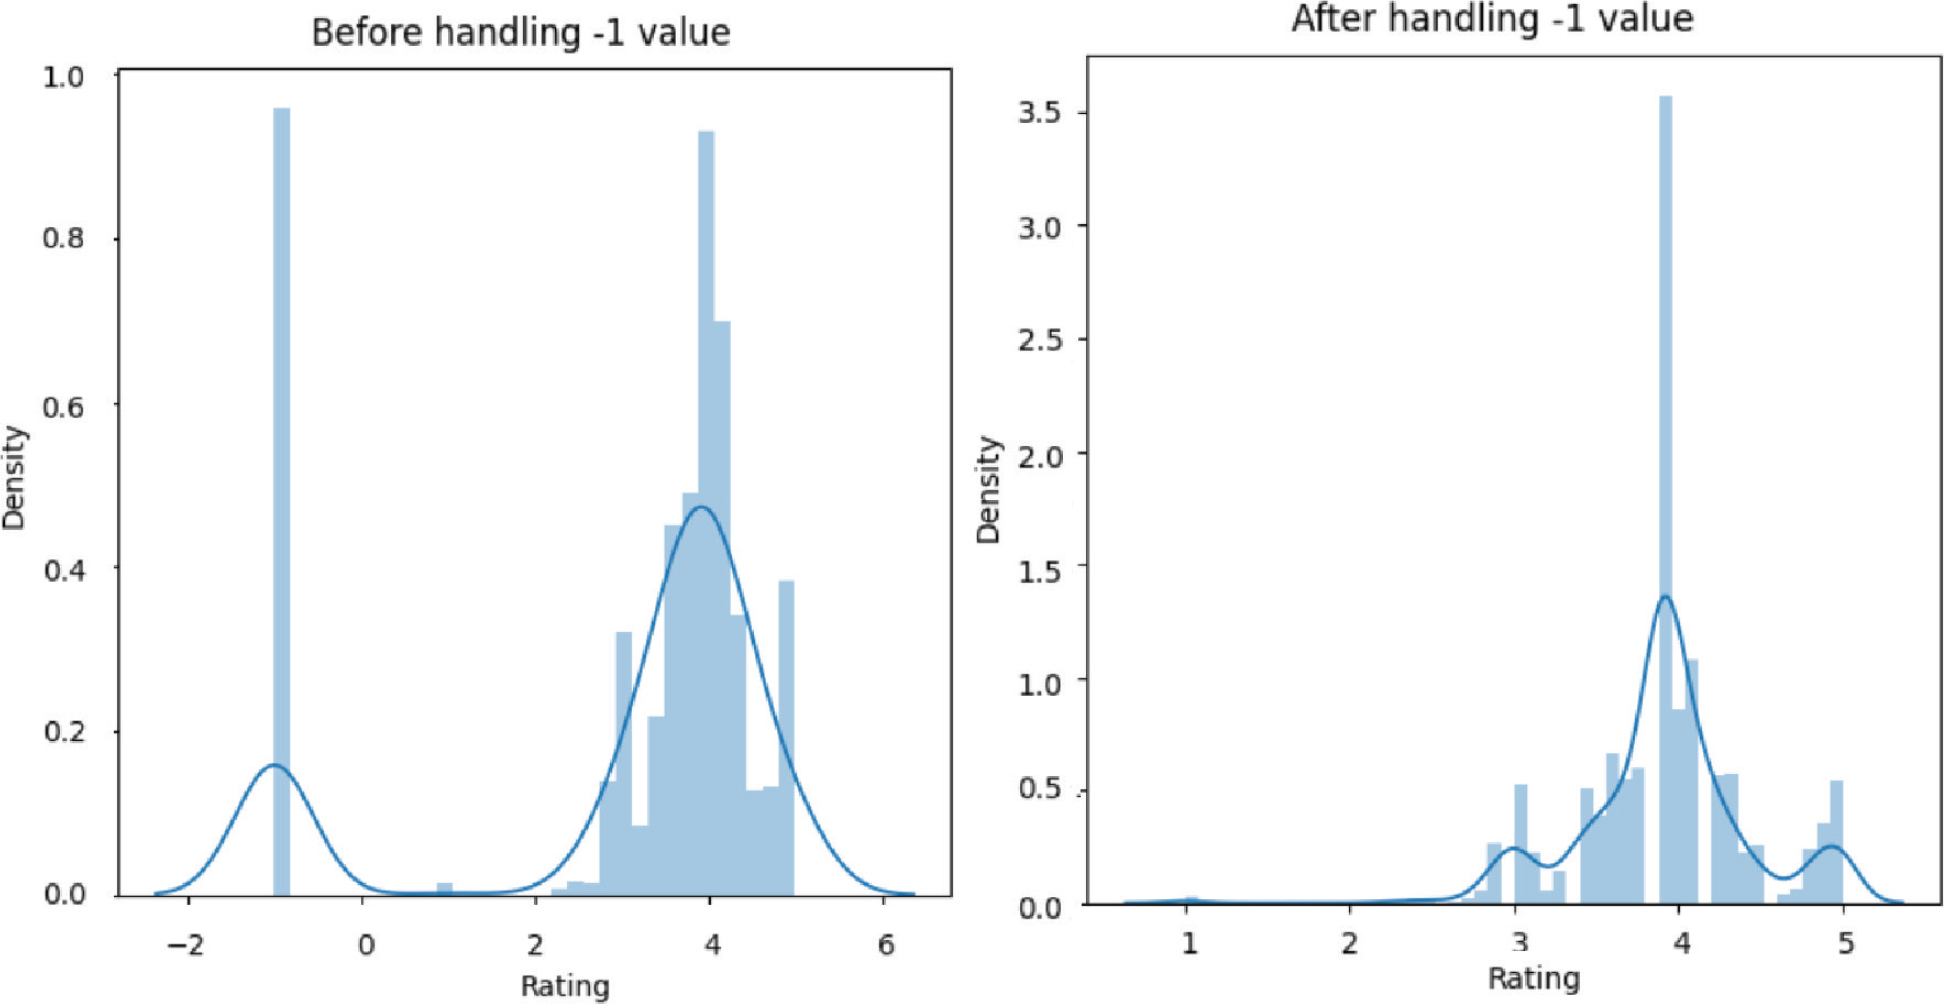
Figure 2:
Representation pre and post handling of outliers in current dataset.
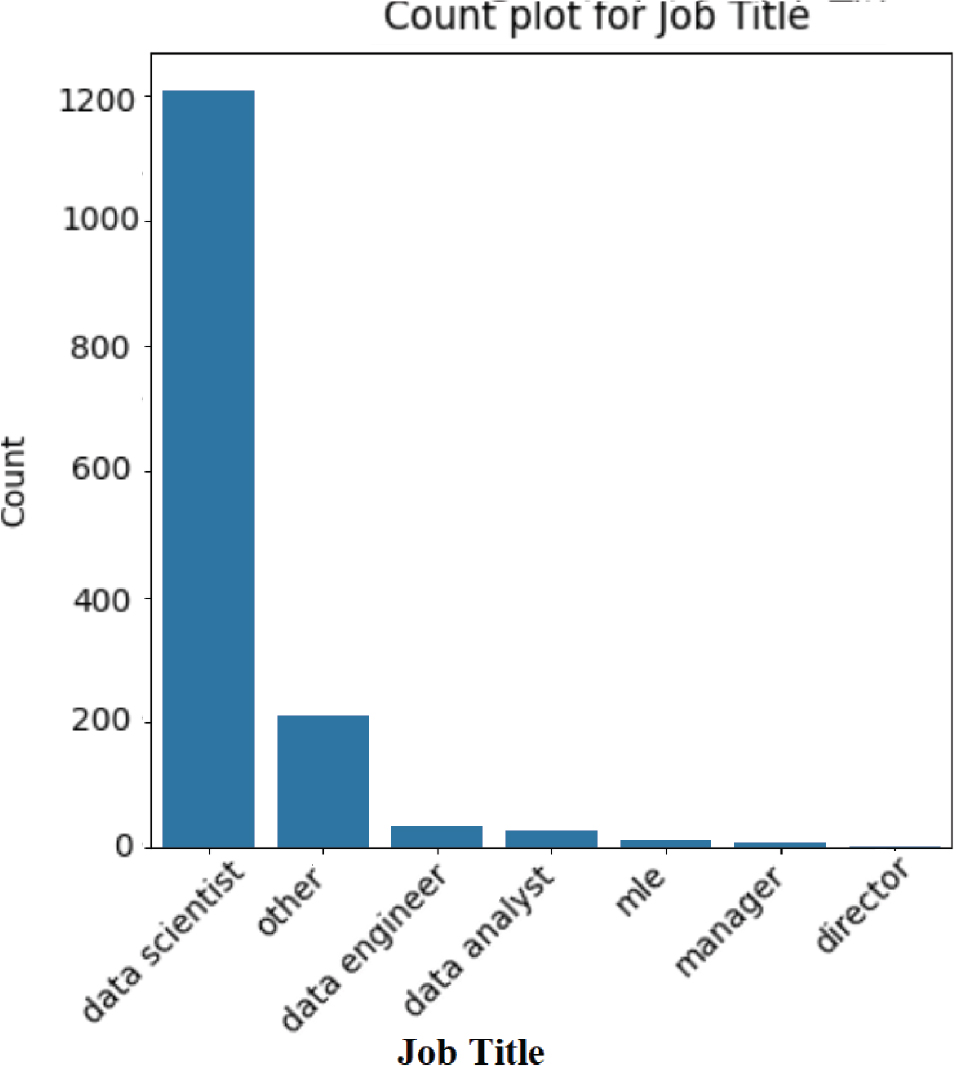
Figure 3:
Count plot of attribute “Job Title.”
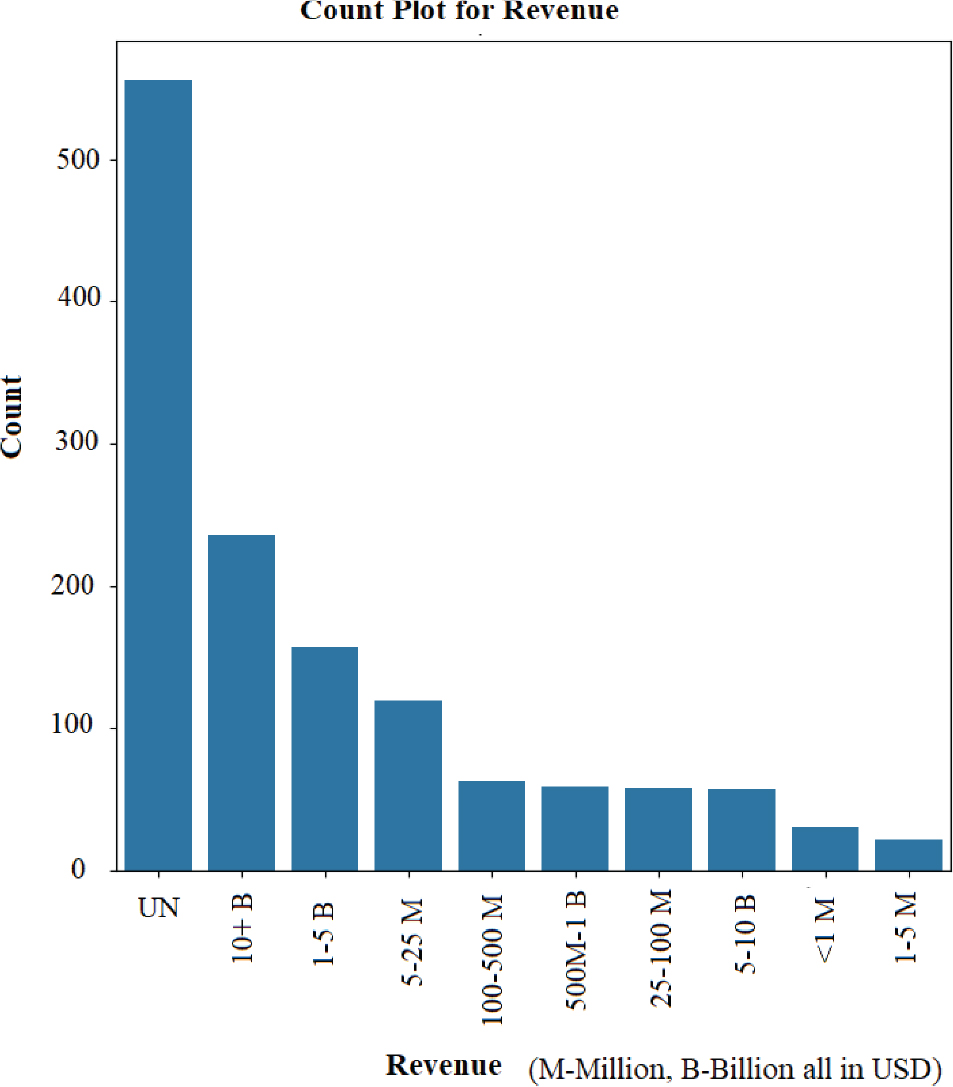
Figure 4:
Count plot of attribute “Company revenue” (UN-unknown).
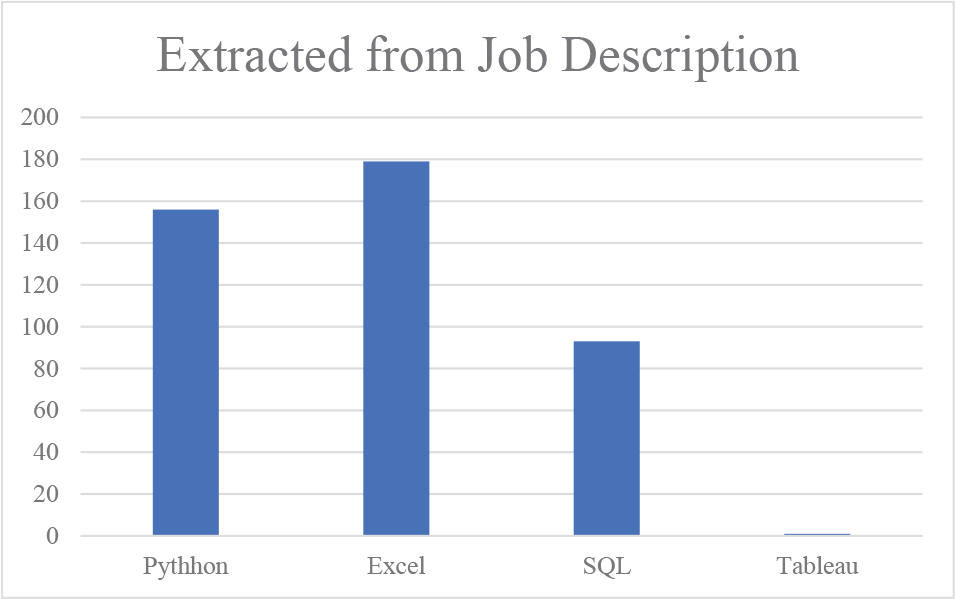
Figure 5:
Number of jobs posted on different domains.
Table 3:
Normalization of column—salary estimate
| Original value | Value after normalization |
|---|---|
| –1 | 116.0 (median) |
| $100 K–$151 K (Glassdoor est.) | 125.5 |
| Employer provided salary: $100 K–$120 K | 110 |
| Employer provided salary:$107 K | 107 |
| Employer provided salary: $60.00 per hr | 140.4 |
| Employer provided salary: $53.62–$64.58 per hr | 138.3 |
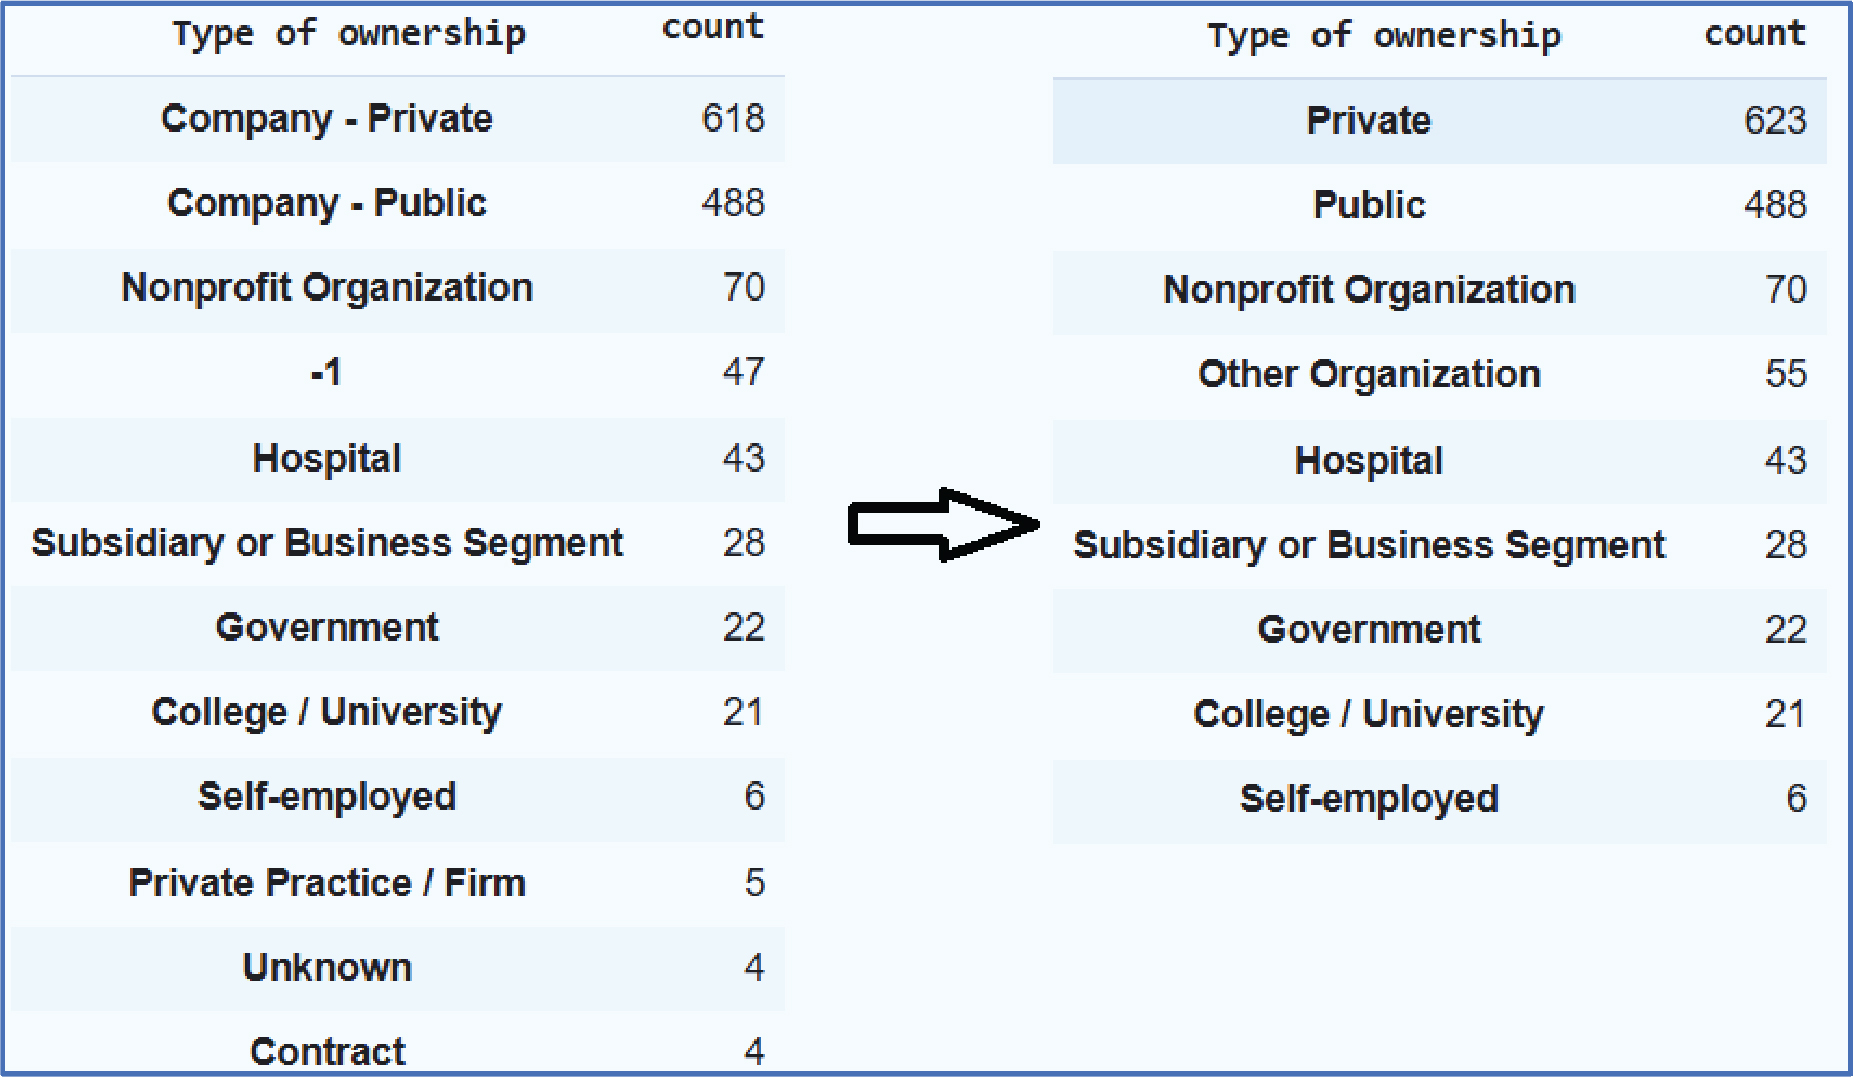
Figure 6:
Type of ownership—before and after trimming.
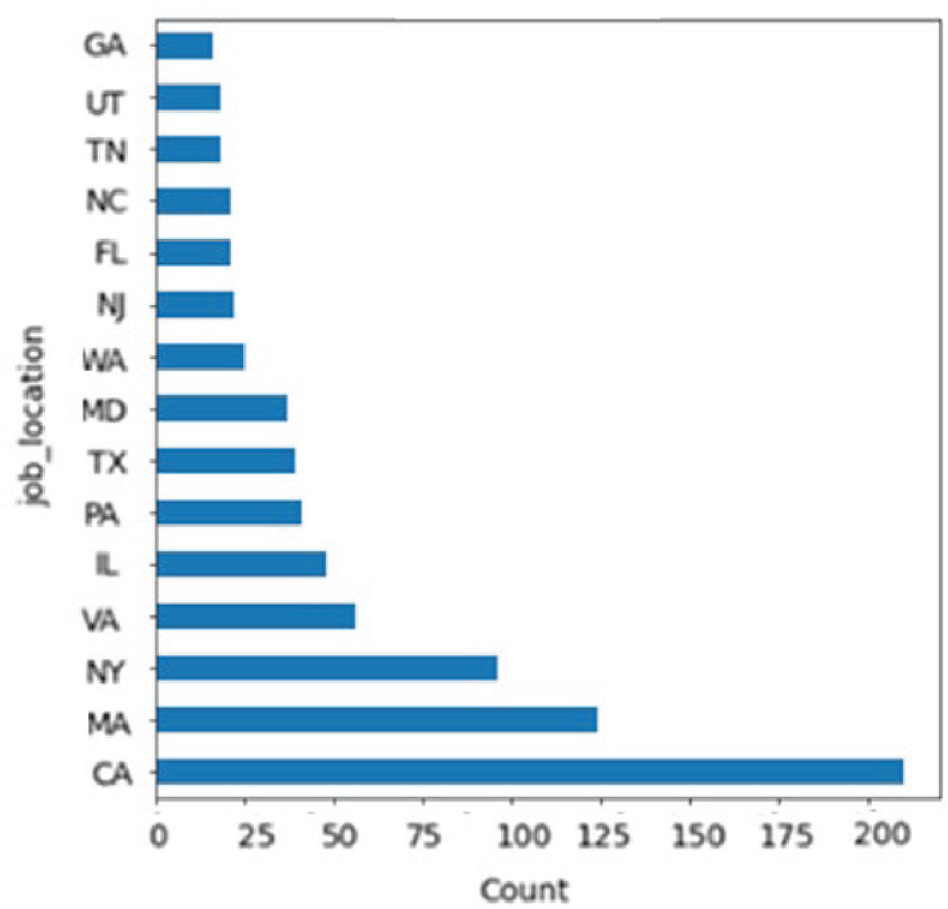
Figure 7:
Top 15 job locations preferred by employees.
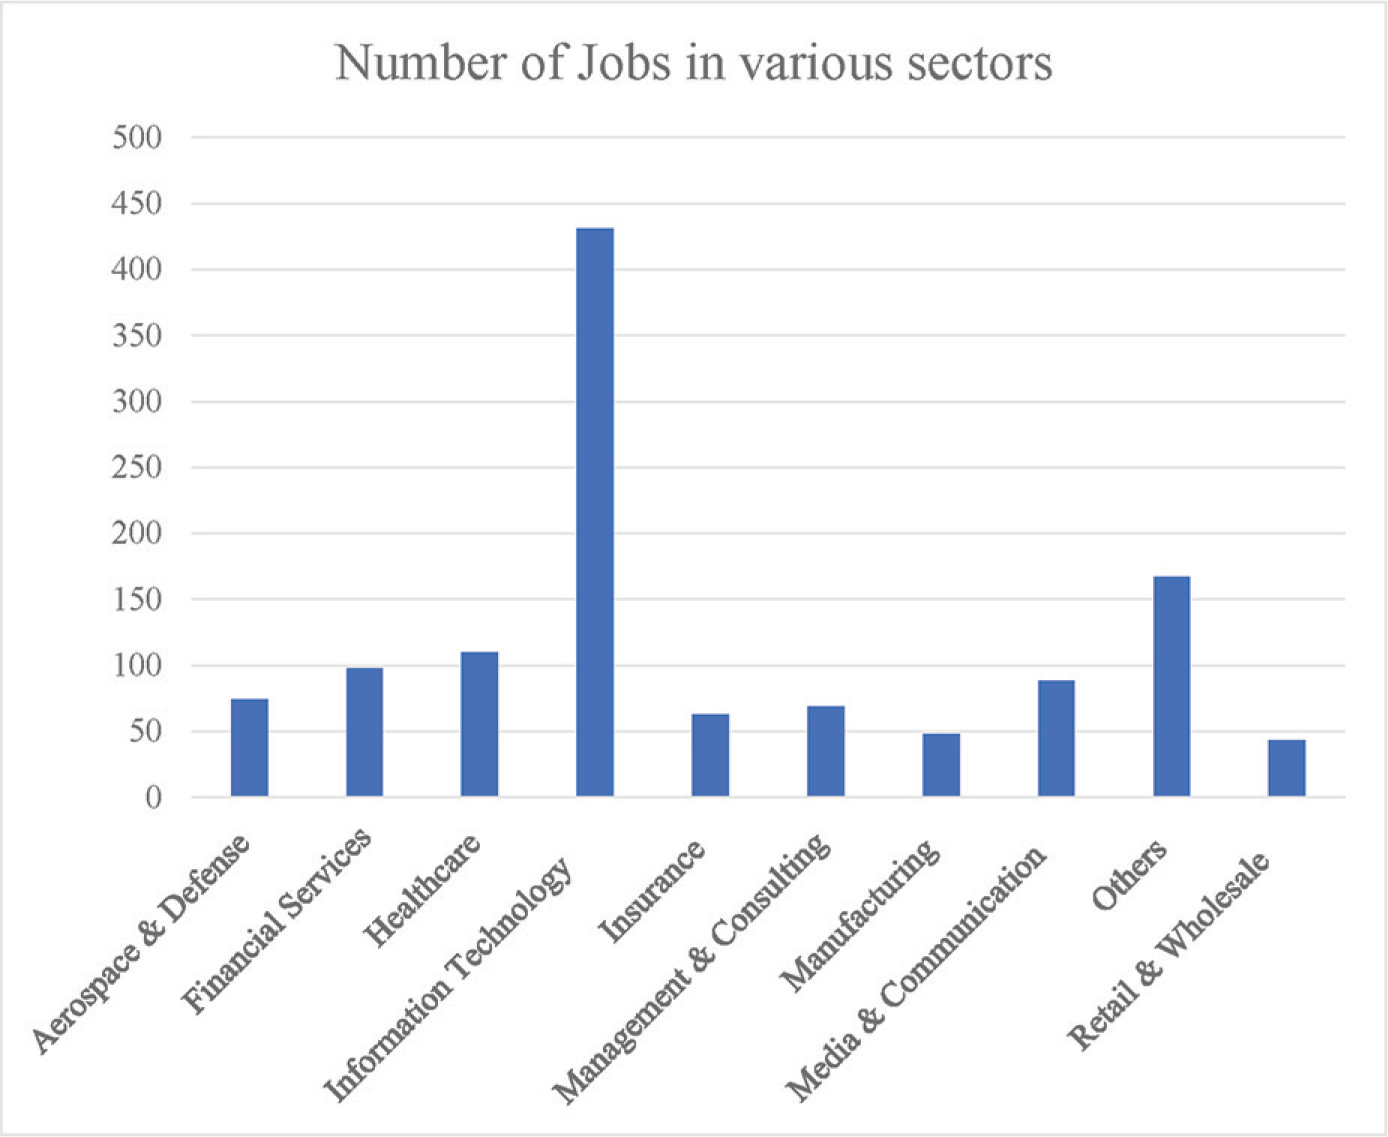
Figure 8:
Number of Jobs in various sectors.
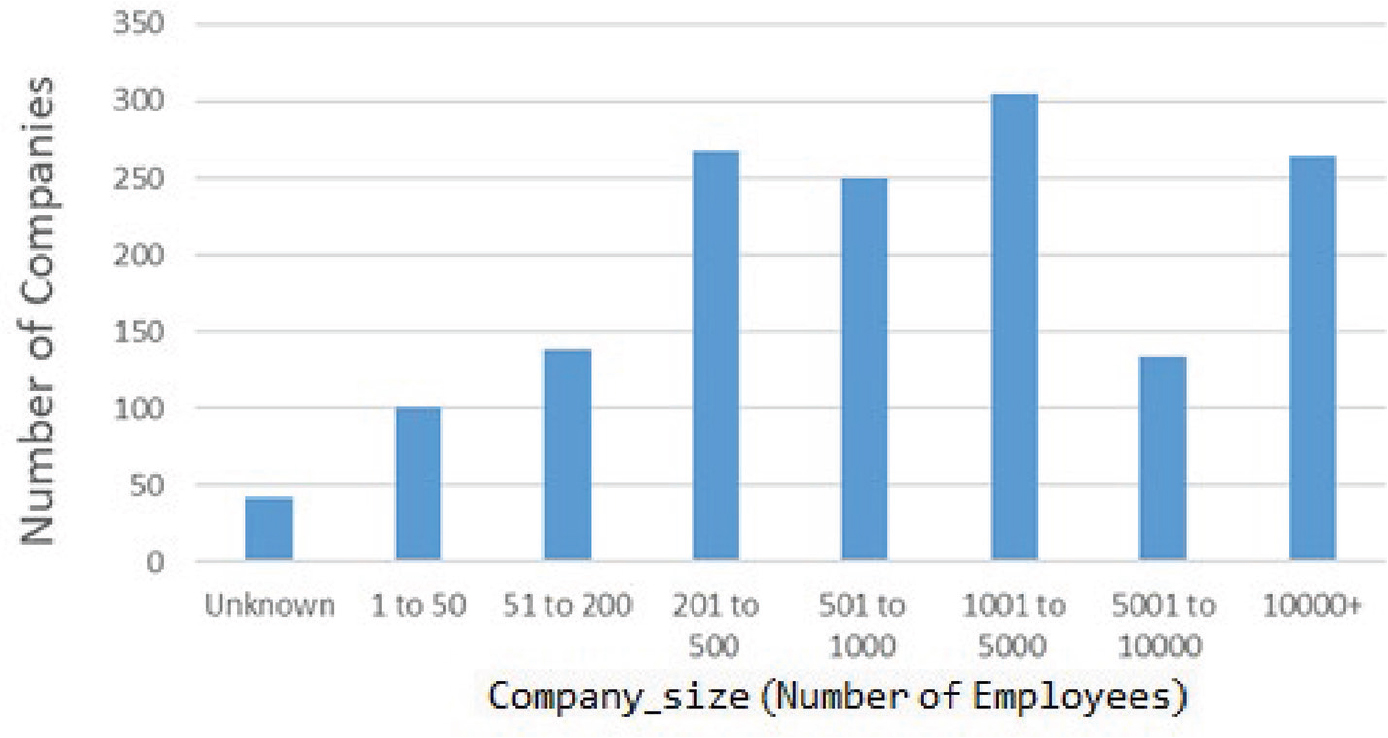
Figure 9:
Plot based on Company_size.

Figure 10:
Sample result obtained for predicting salary.
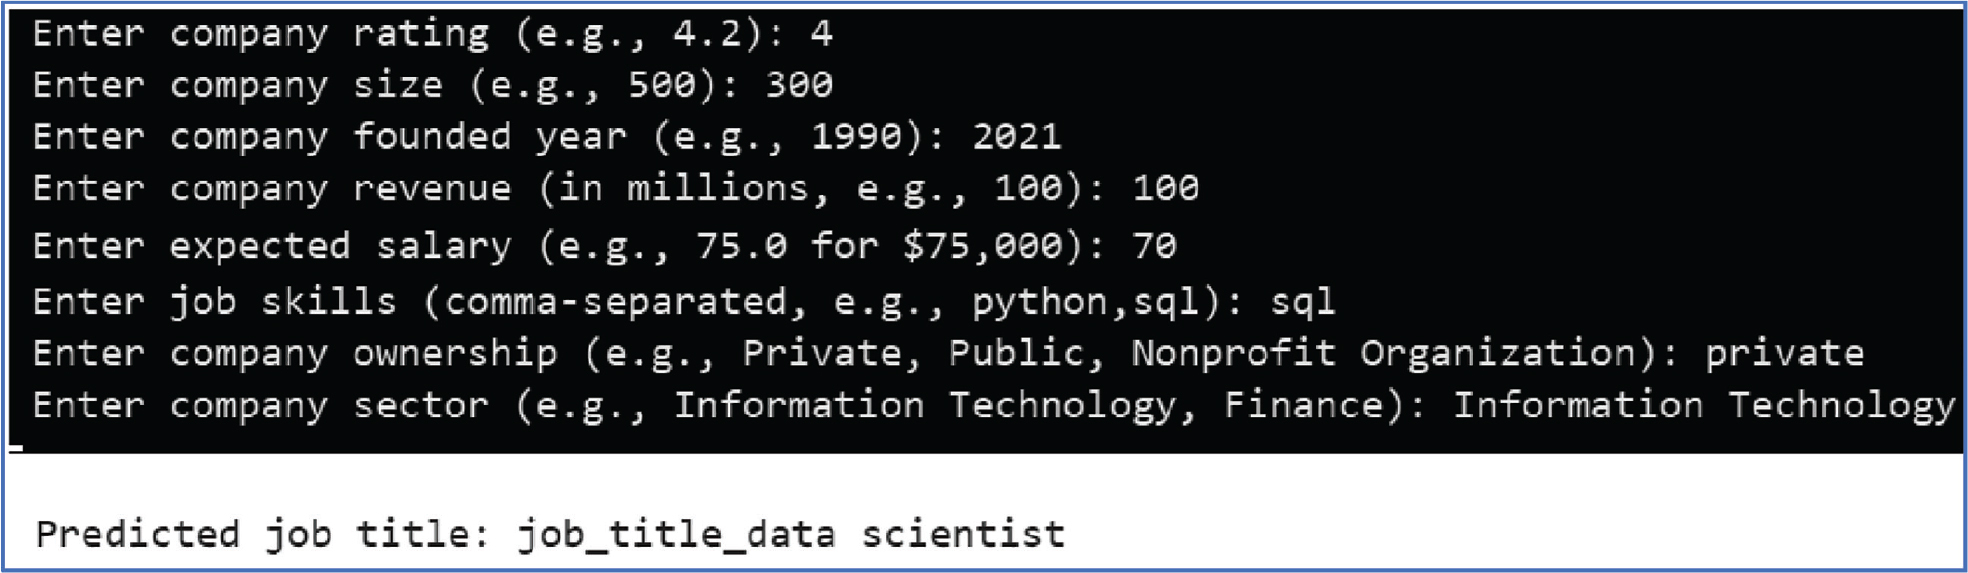
Figure 11:
Sample result obtained for predicting job title.
Table 4:
Comparison of model performance
| Model performance | Accuracy | RMSE | NRMSE | R2 | MAE | SD |
|---|---|---|---|---|---|---|
| Random Forest | 0.9853 | 0.0646 | 0.1966 | 0.8133 | 0.0166 | 0.0646 |
| Lasso | 0.8750 | 0.2103 | 0.6402 | 0.0061 | 0.0888 | 0.2103 |
| LightGBM | 0.9559 | 0.4441 | 1.3520 | 0.5373 | 0.1160 | 0.4430 |
| XGBoost | 0.9963 | 0.1819 | 1.3108 | 0.9224 | 0.1113 | 0.1816 |
| Voting | 0.9963 | 0.0646 | 0.5501 | 0.9234 | 0.0117 | 0.1803 |
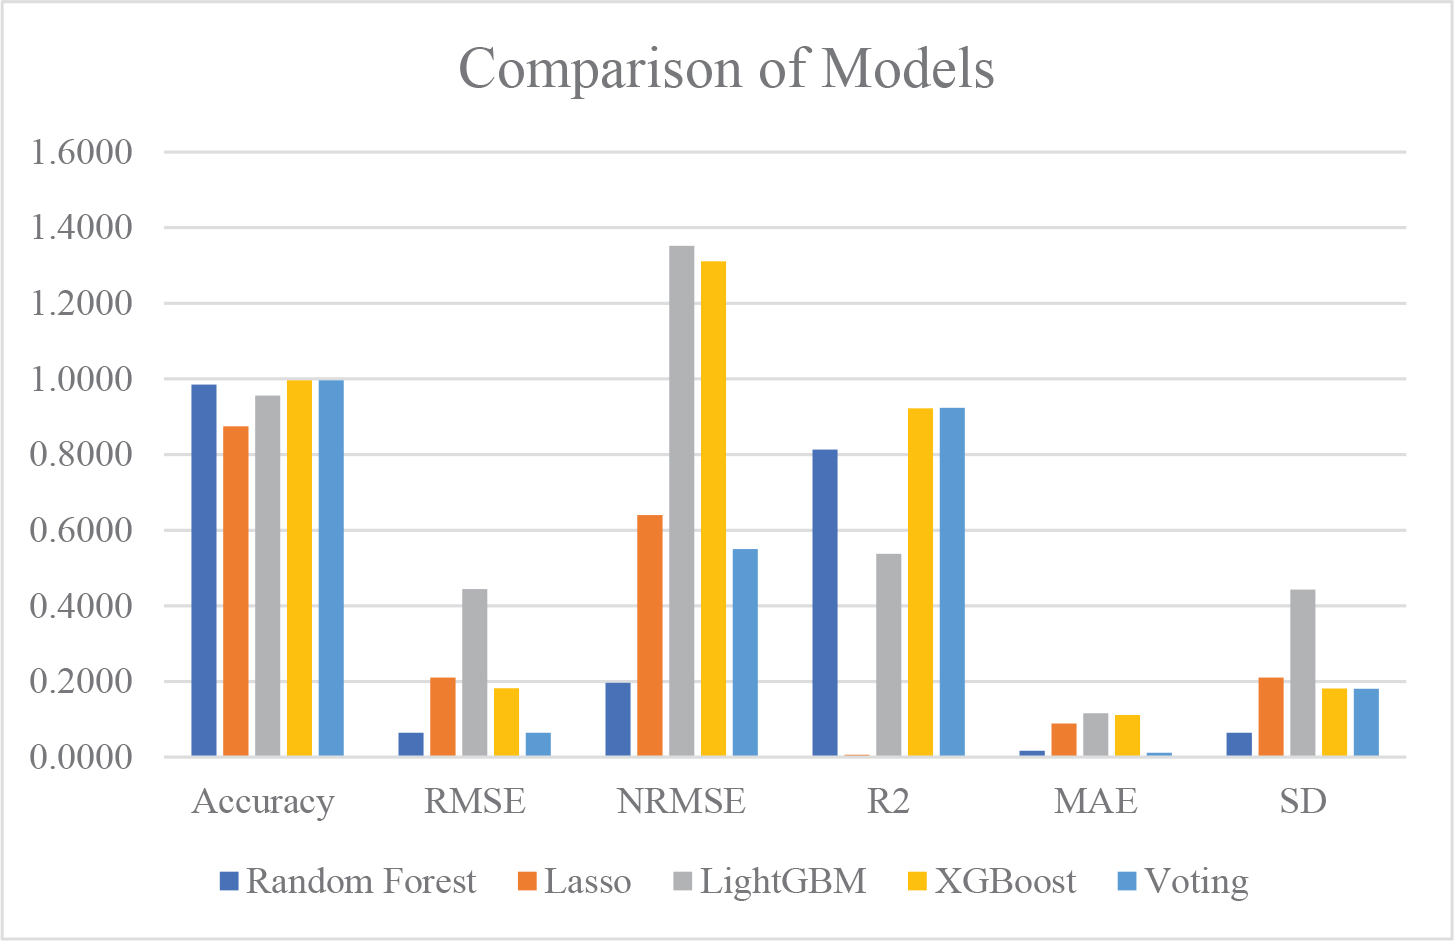
Figure 12:
Representation of performance metrics. MAE, mean absolute error; NRMSE, normalized root mean square error; RMSE, root mean squared error; SD, standard deviation.