
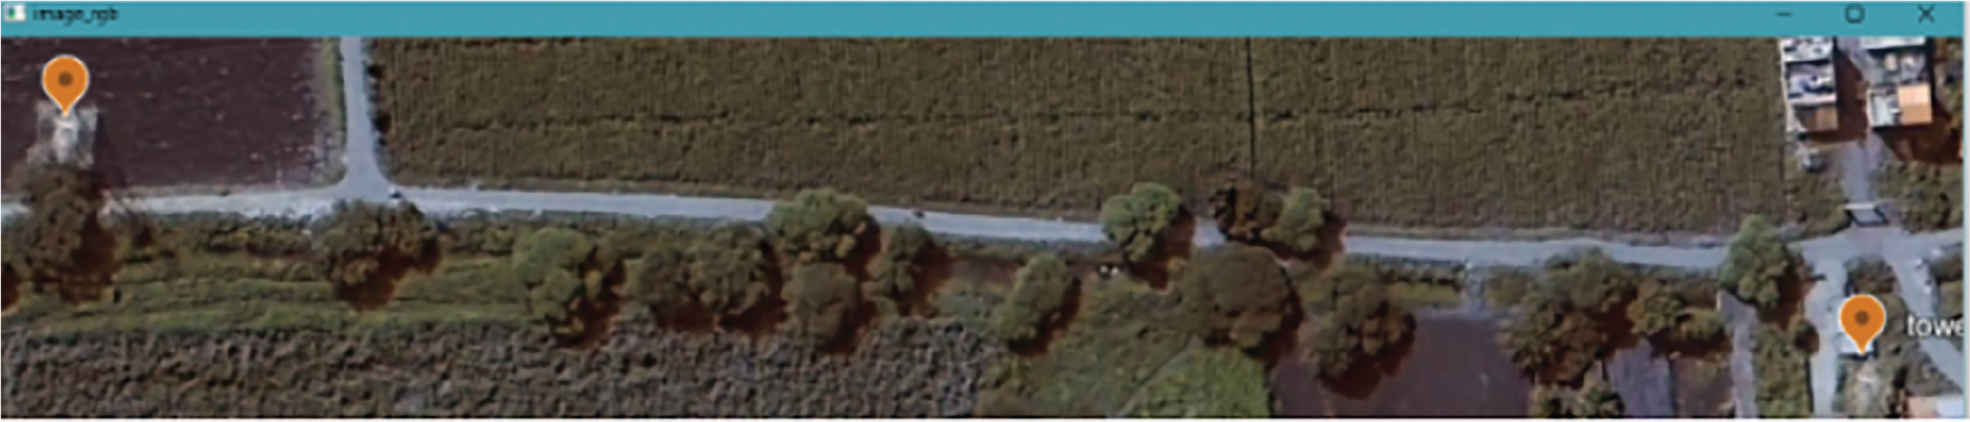
Figure 1:
Data preprocessing ROI extraction by cropping. ROI, region of interest.
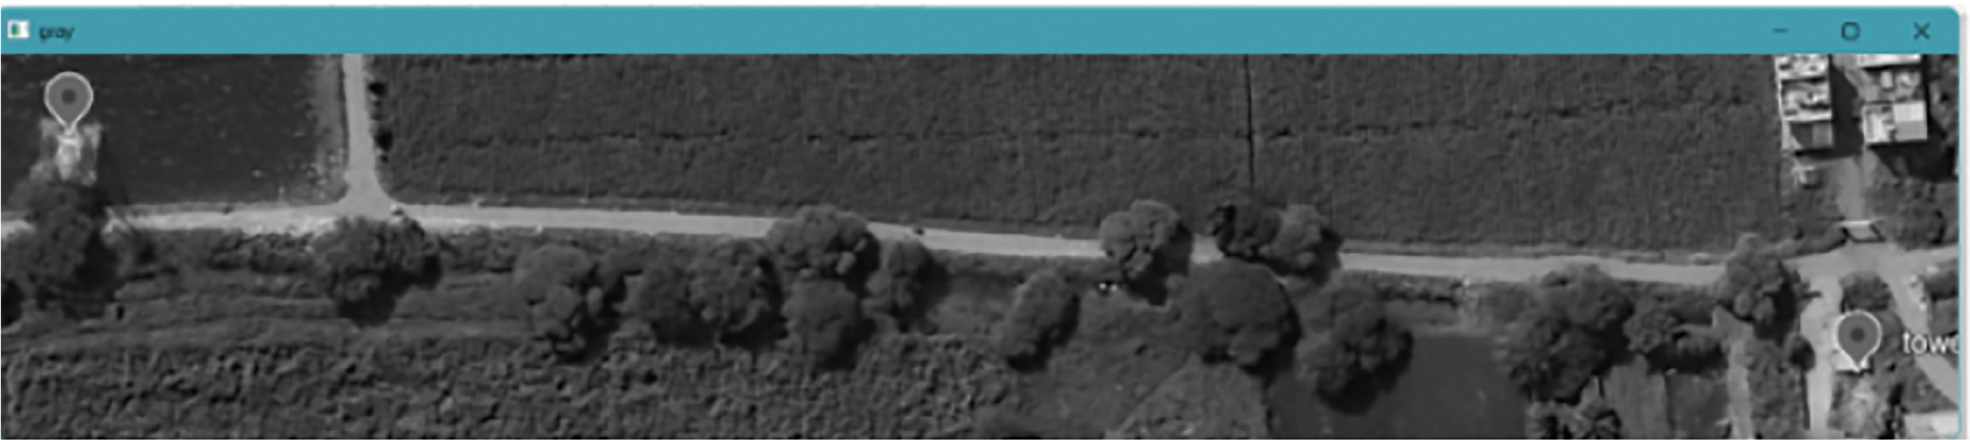
Figure 2:
Color conversion from RGB to gray scale. RGB, red, green, blue.
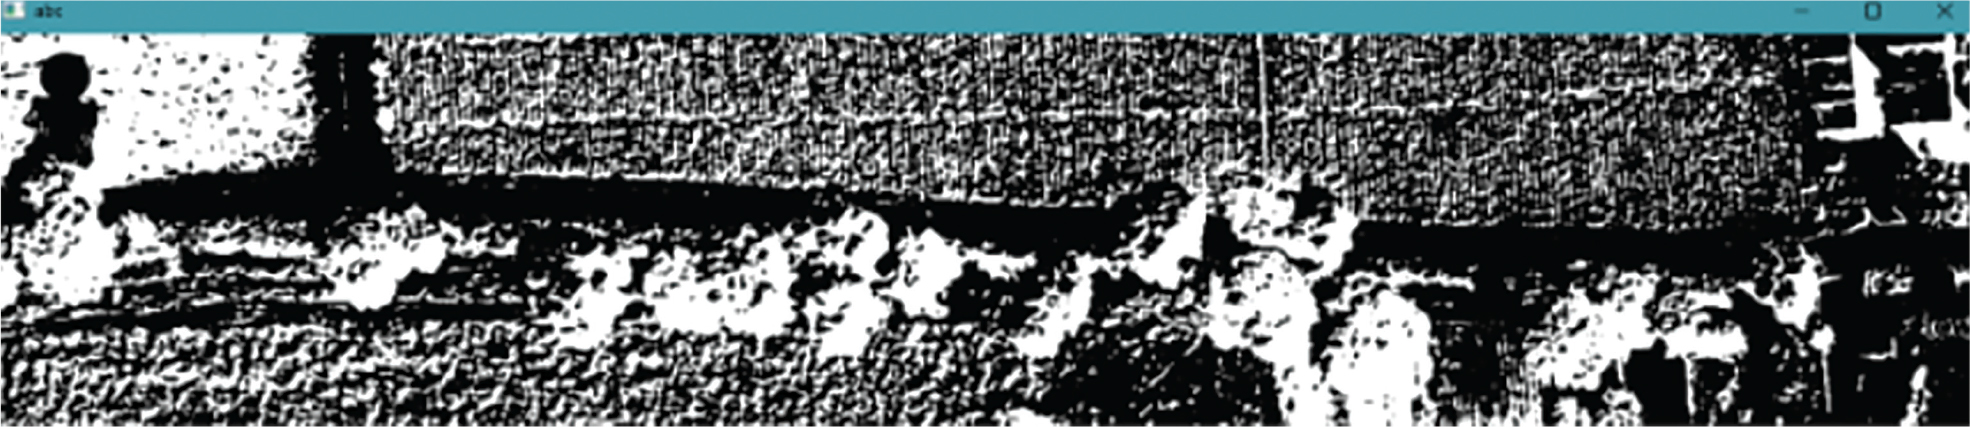
Figure 3:
Binary inversion of the image in gray scale.
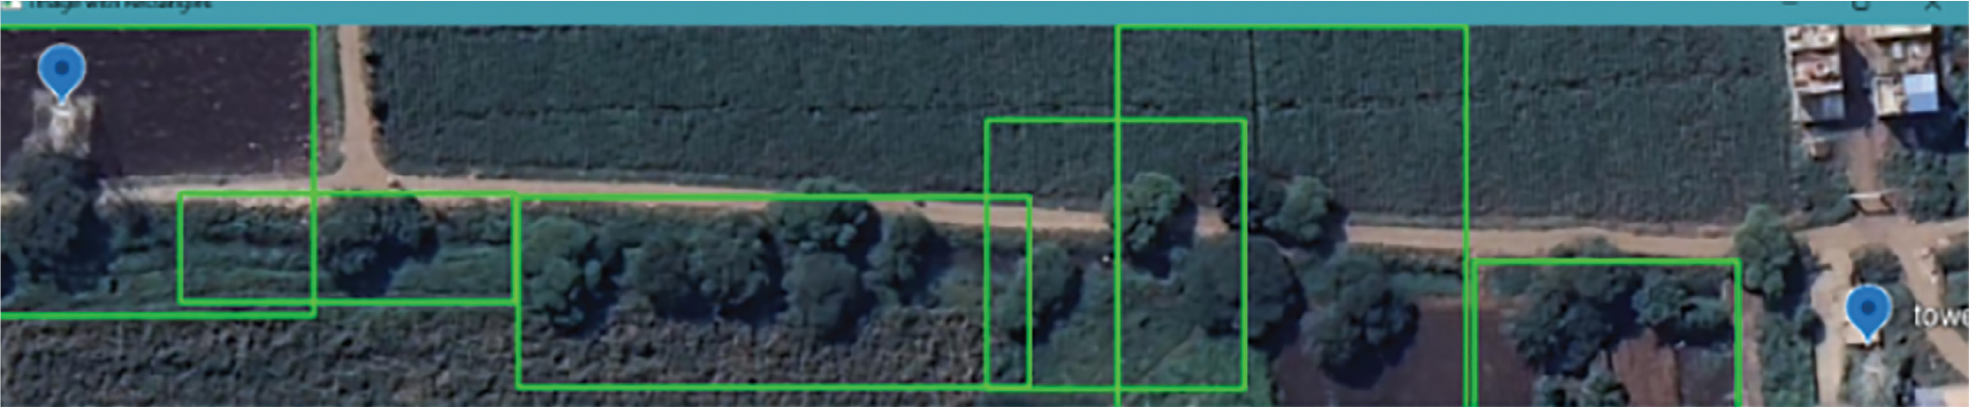
Figure 4:
Vegetation cover detected in the image.
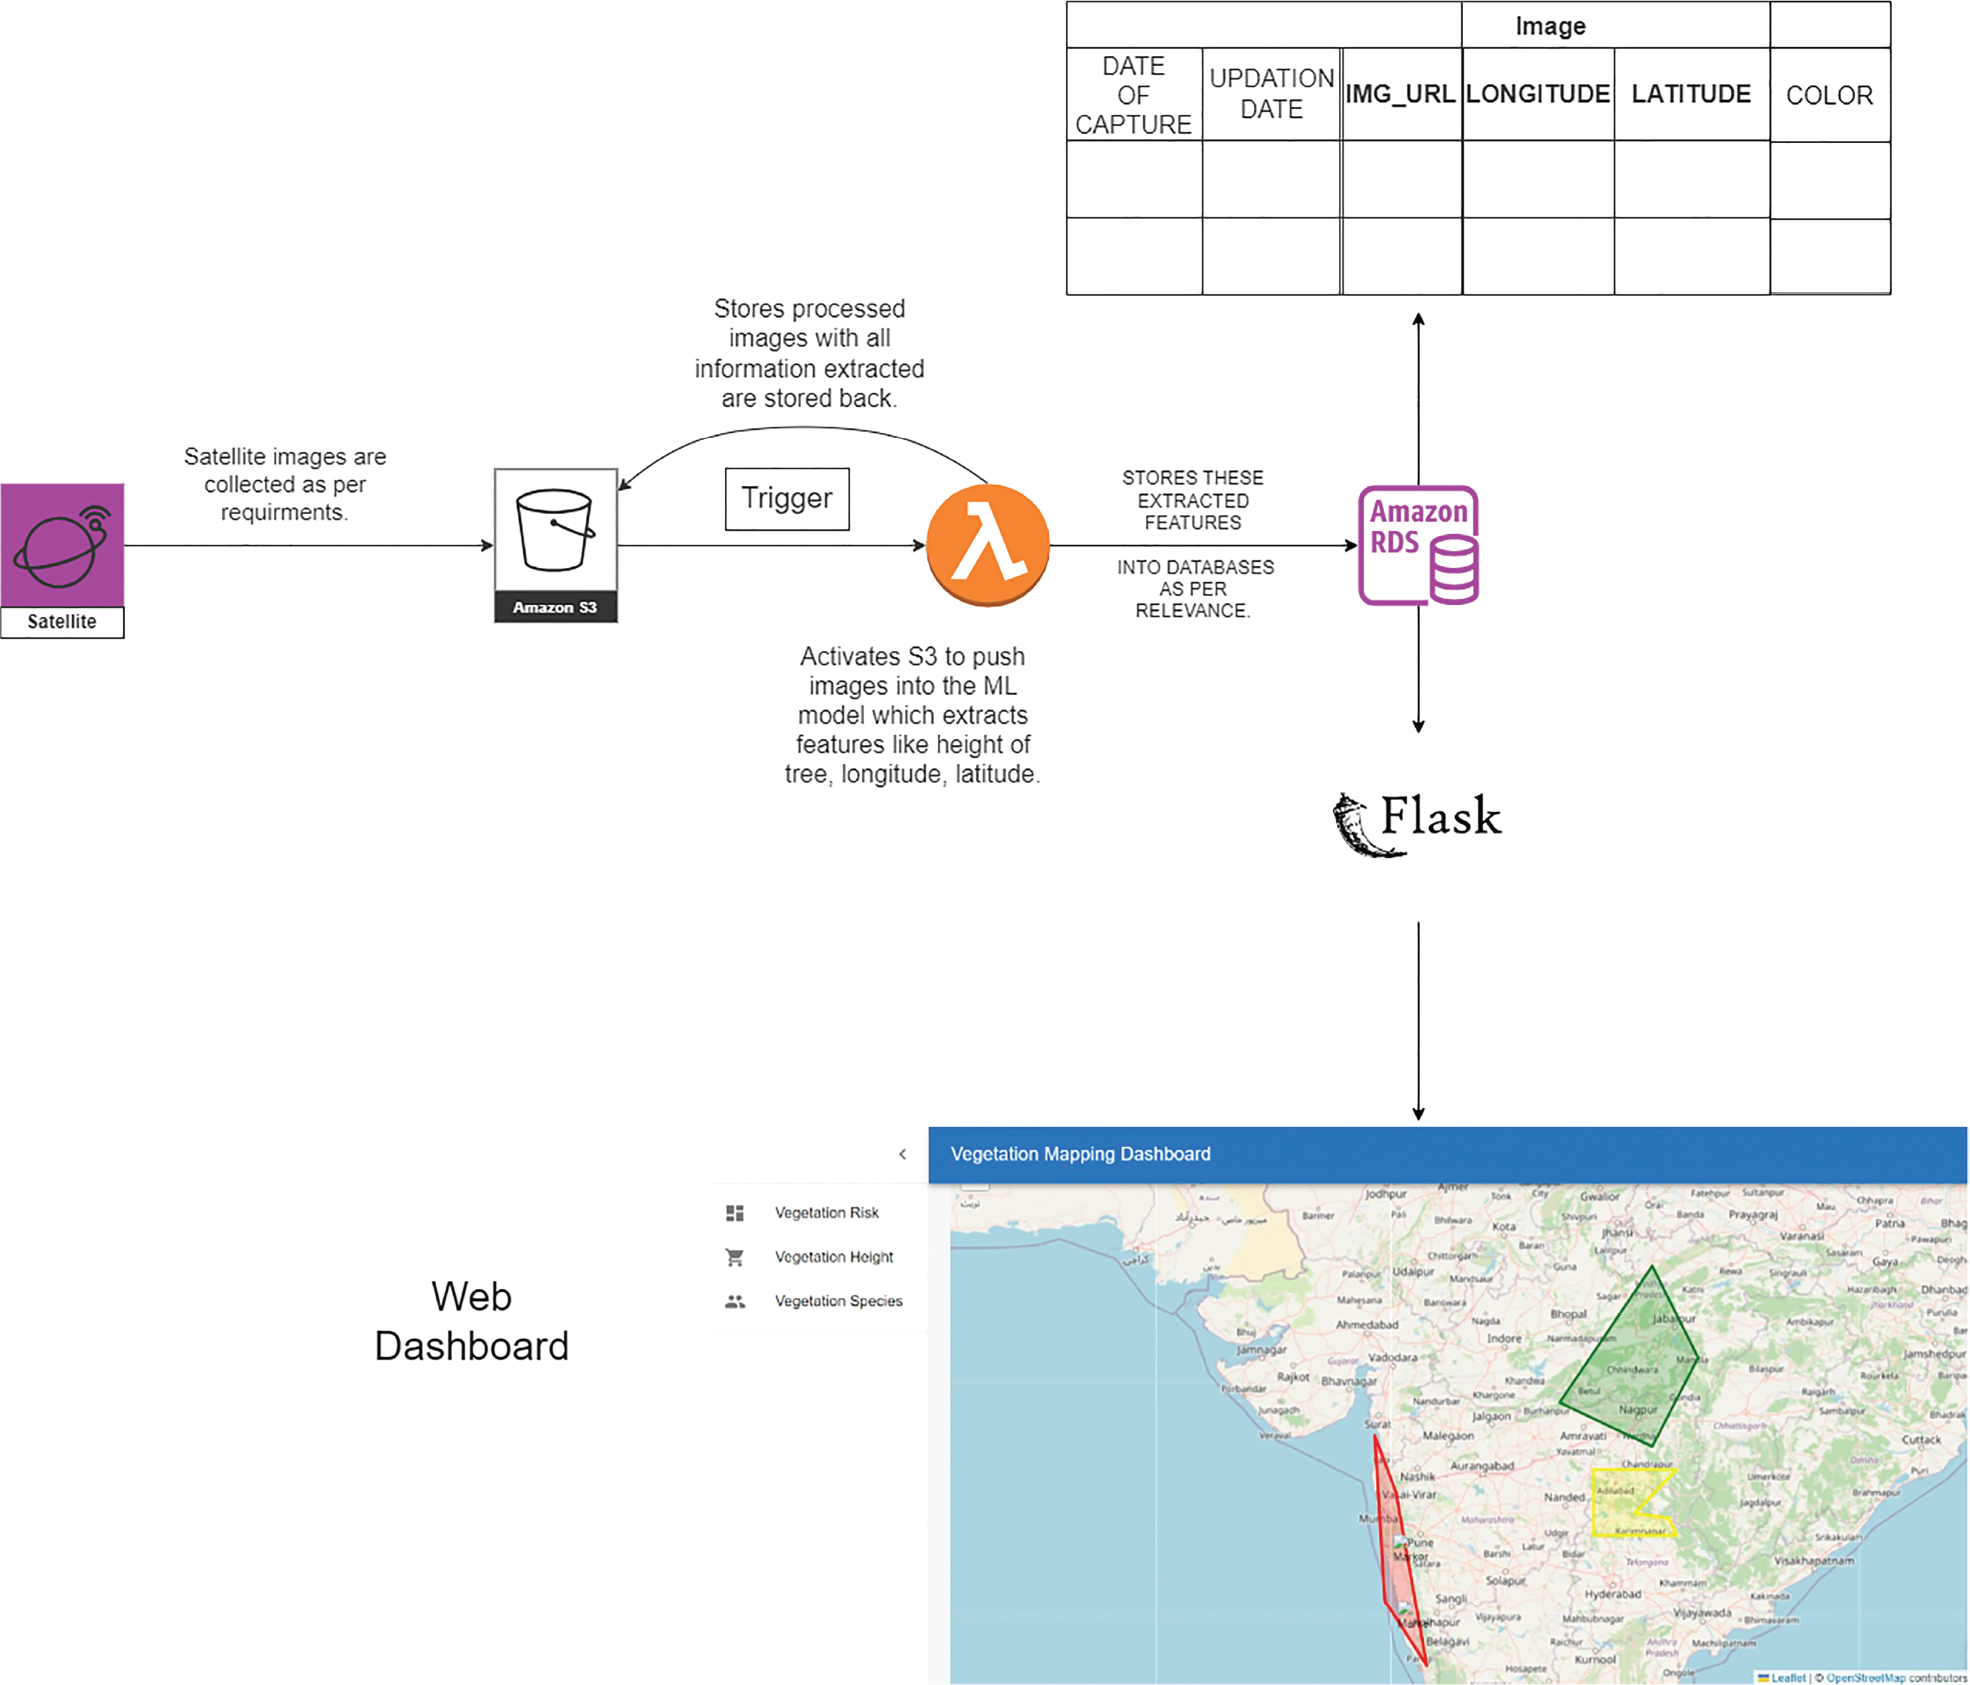
Figure 5:
Serverless system architecture for vegetation detection system.
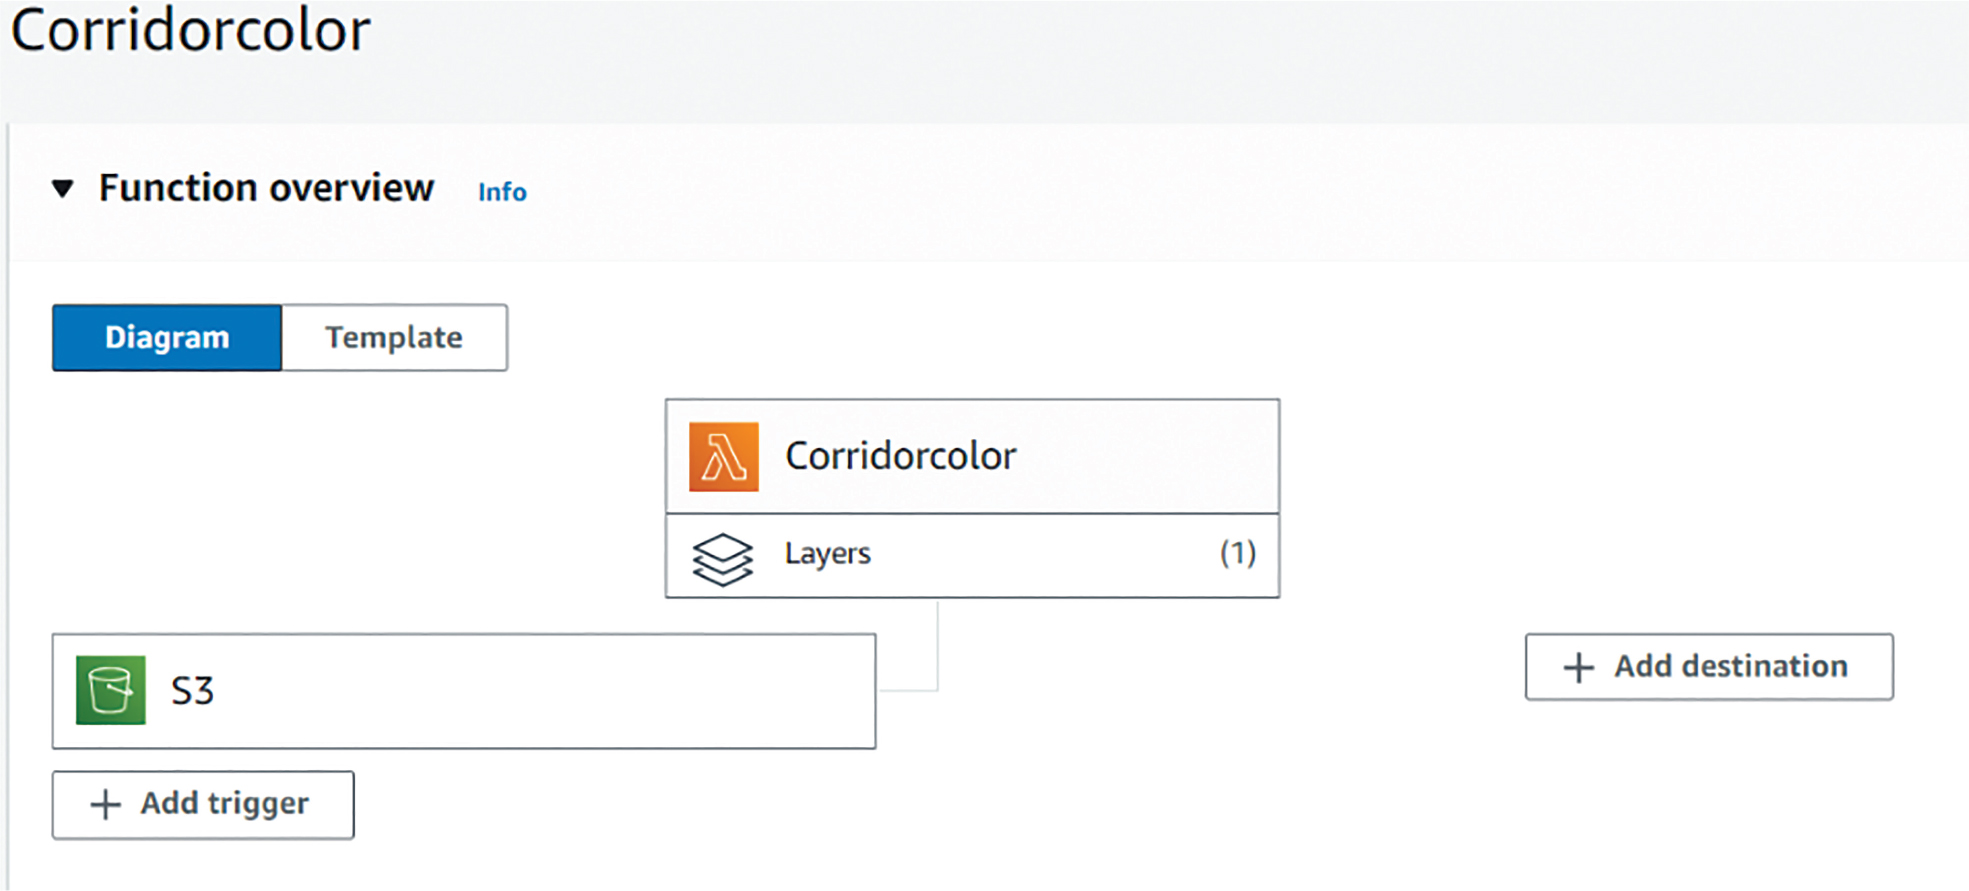
Figure 6:
S3 bucket event triggering Lambda function for monitoring.
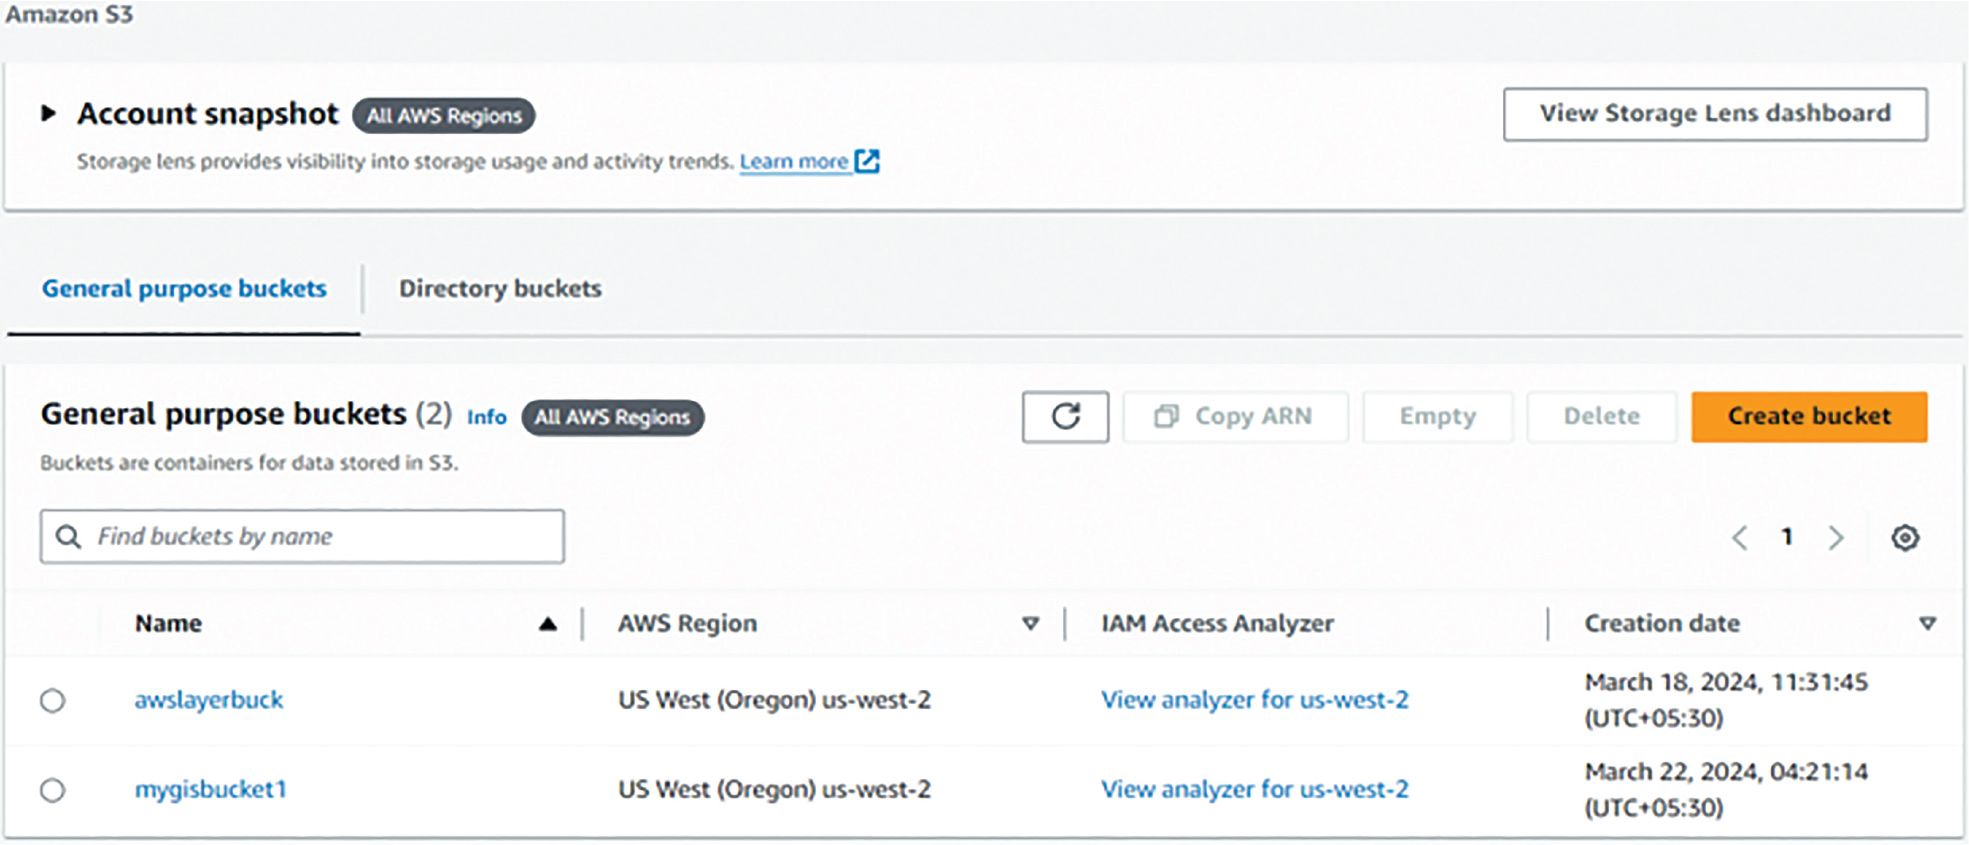
Figure 7:
Snapshot of S3 bucket used as a data lake.
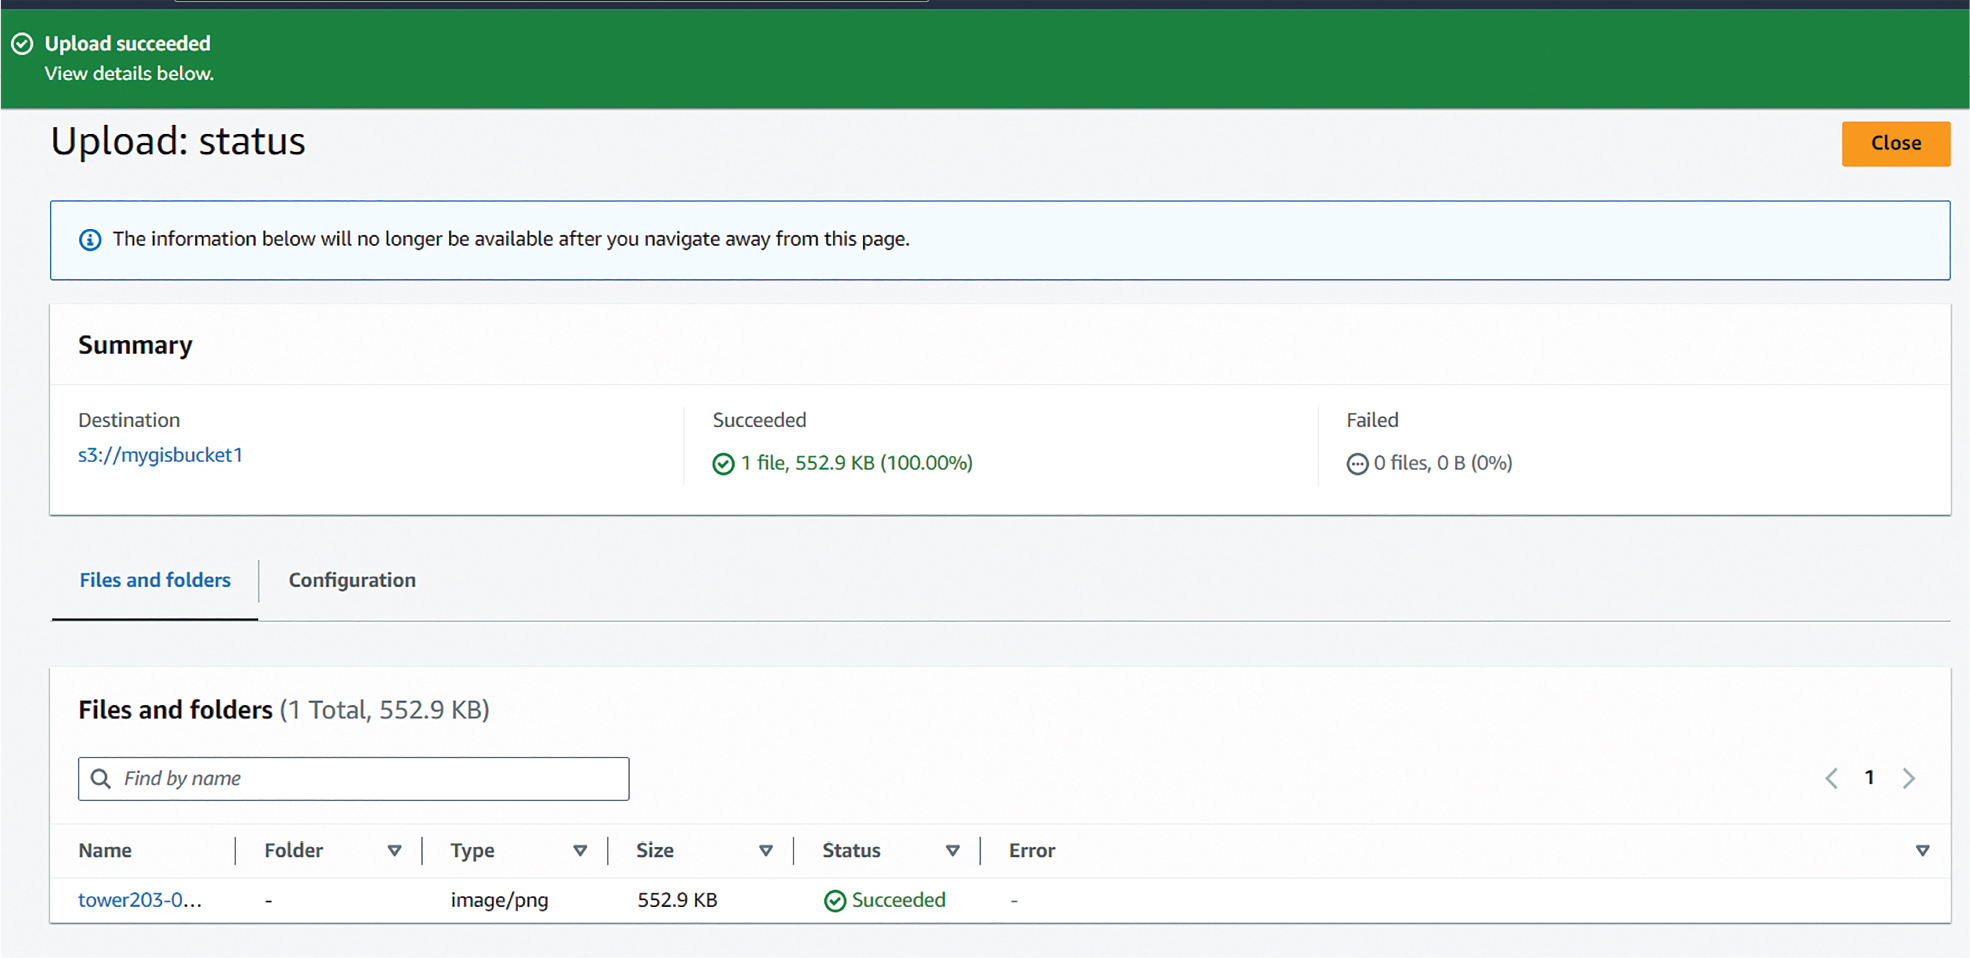
Figure 8:
Image uploaded in the S3 bucket.
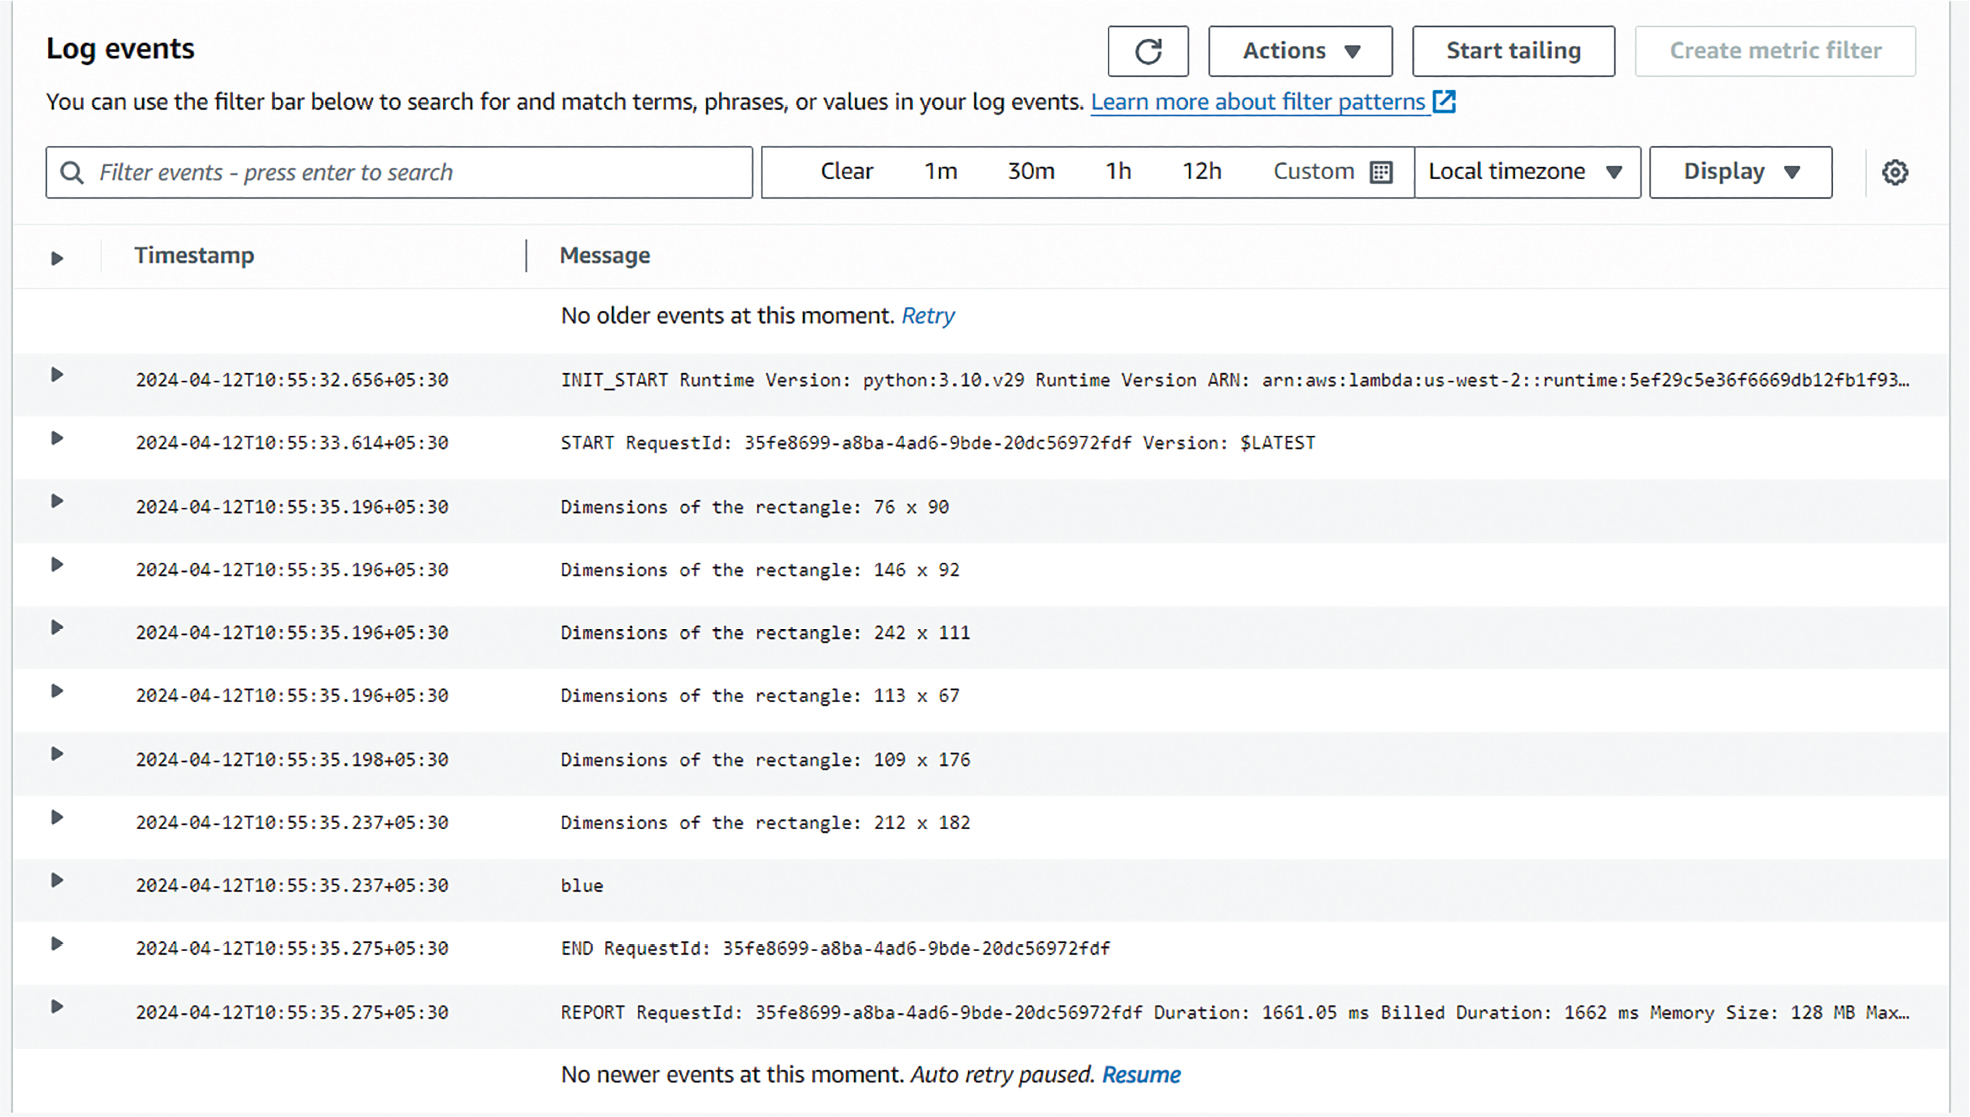
Figure 9:
CloudWatchLogs: Severity color detected by algorithm as blue.
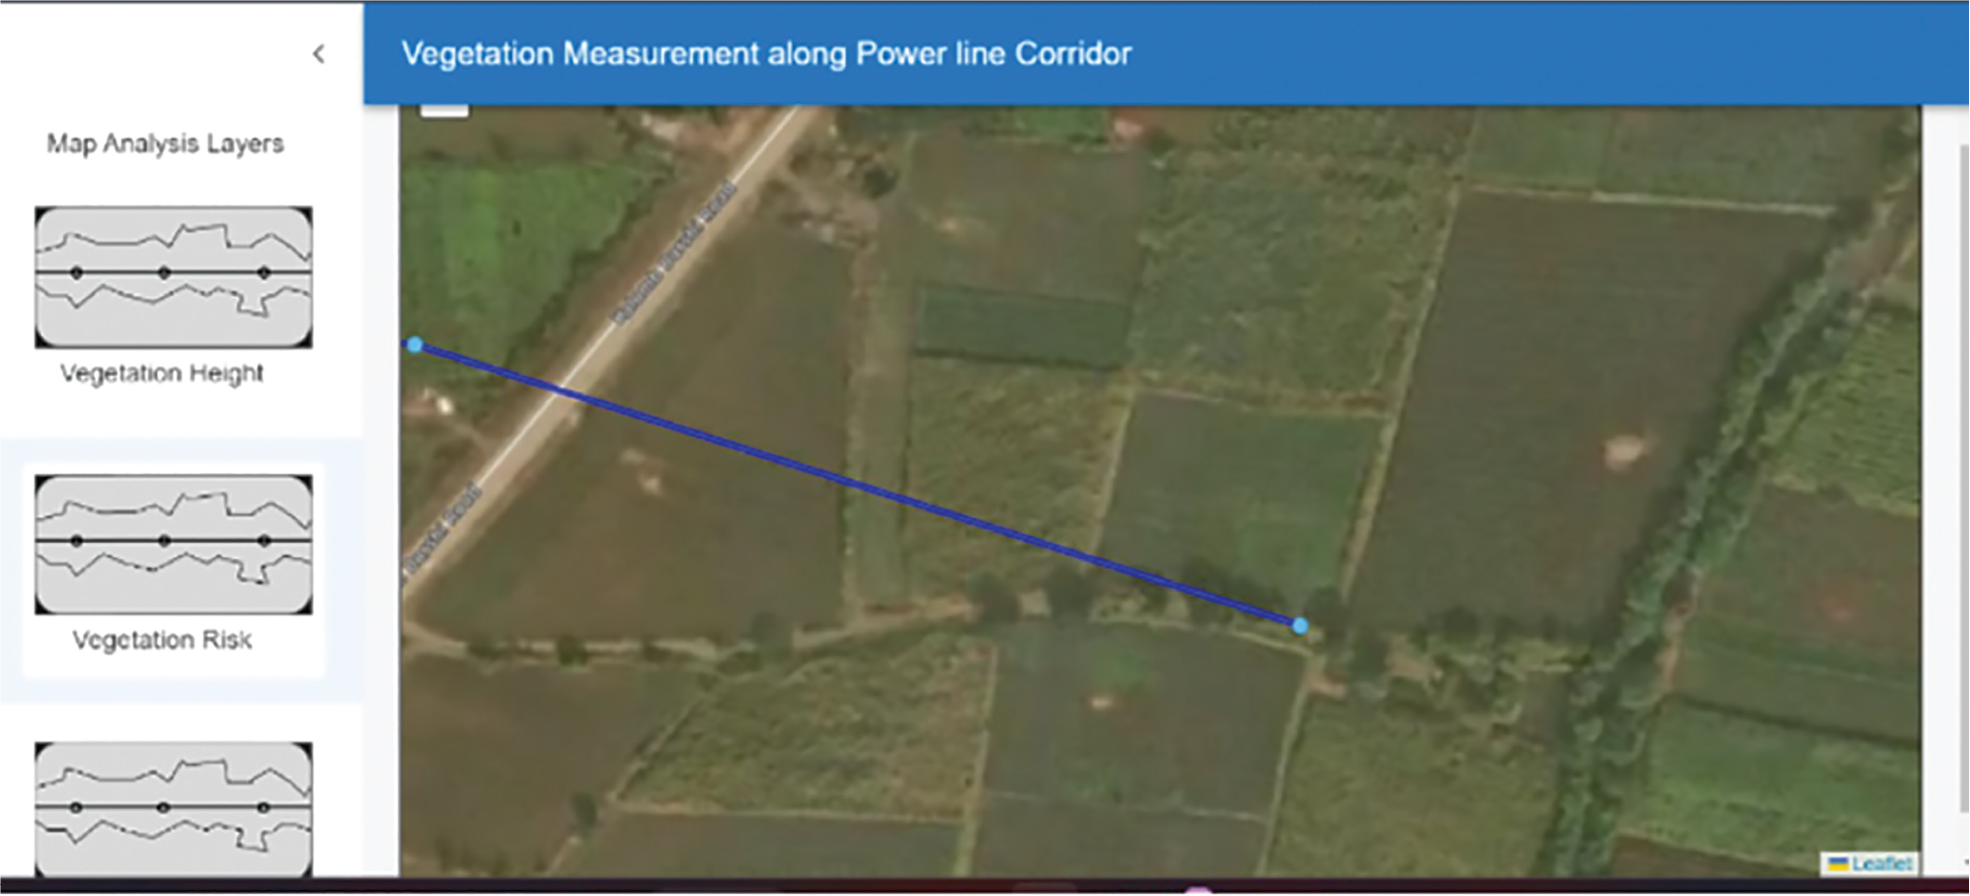
Figure 10:
Power grid corridor marked as blue on the web dashboard.