
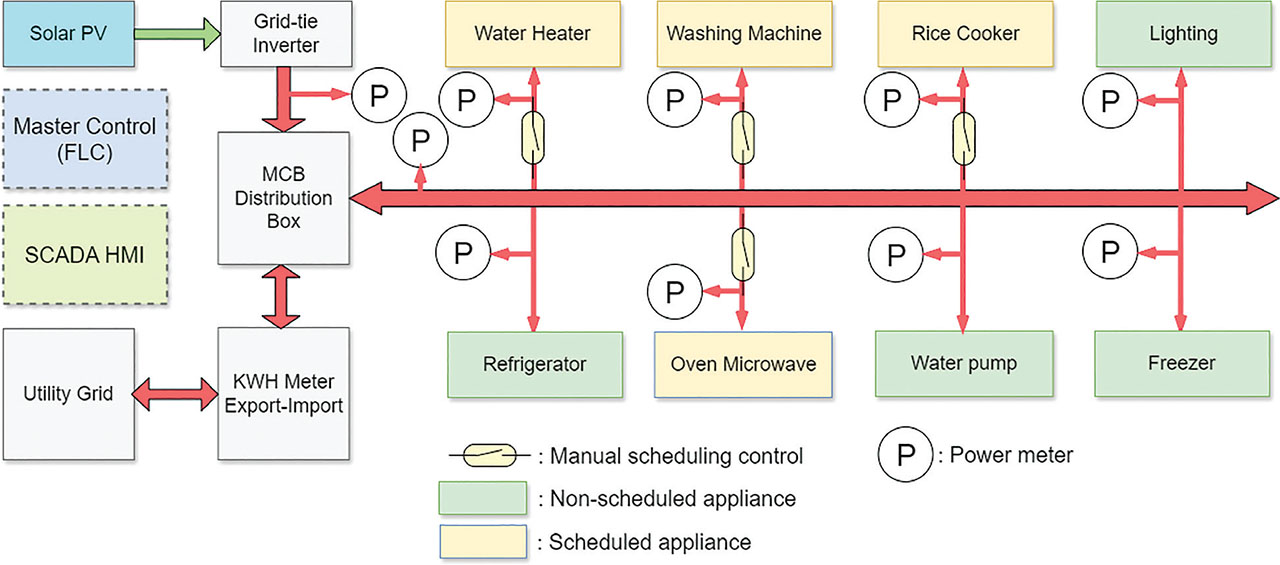
Figure 1:
Architecture of home appliance scheduling system. FLC, fuzzy logic controller; SCADA, supervisory control and data acquisition.
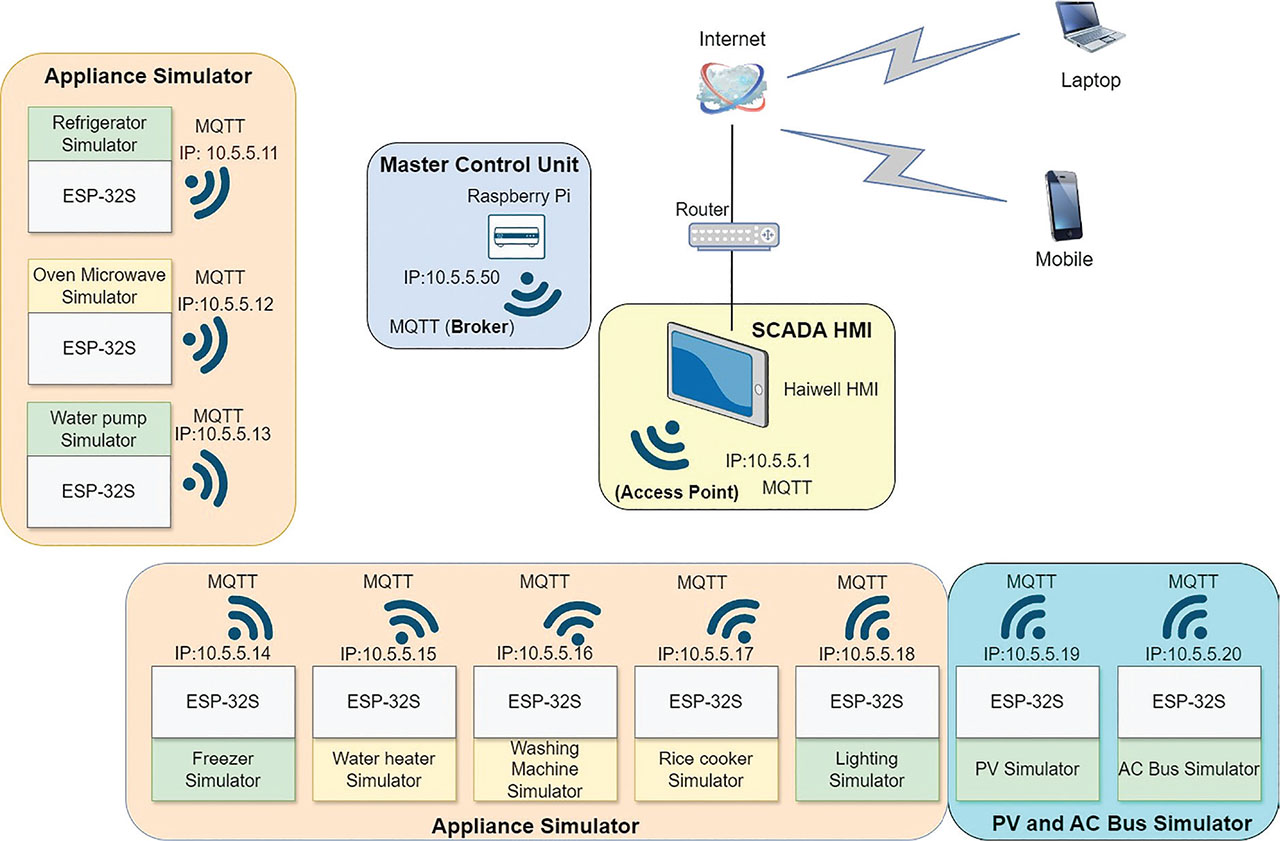
Figure 2:
Hardware configuration of home appliance scheduling system. HMI, human machine interface; MQTT, message queuing telemetry transport; SCADA, supervisory control and data acquisition.
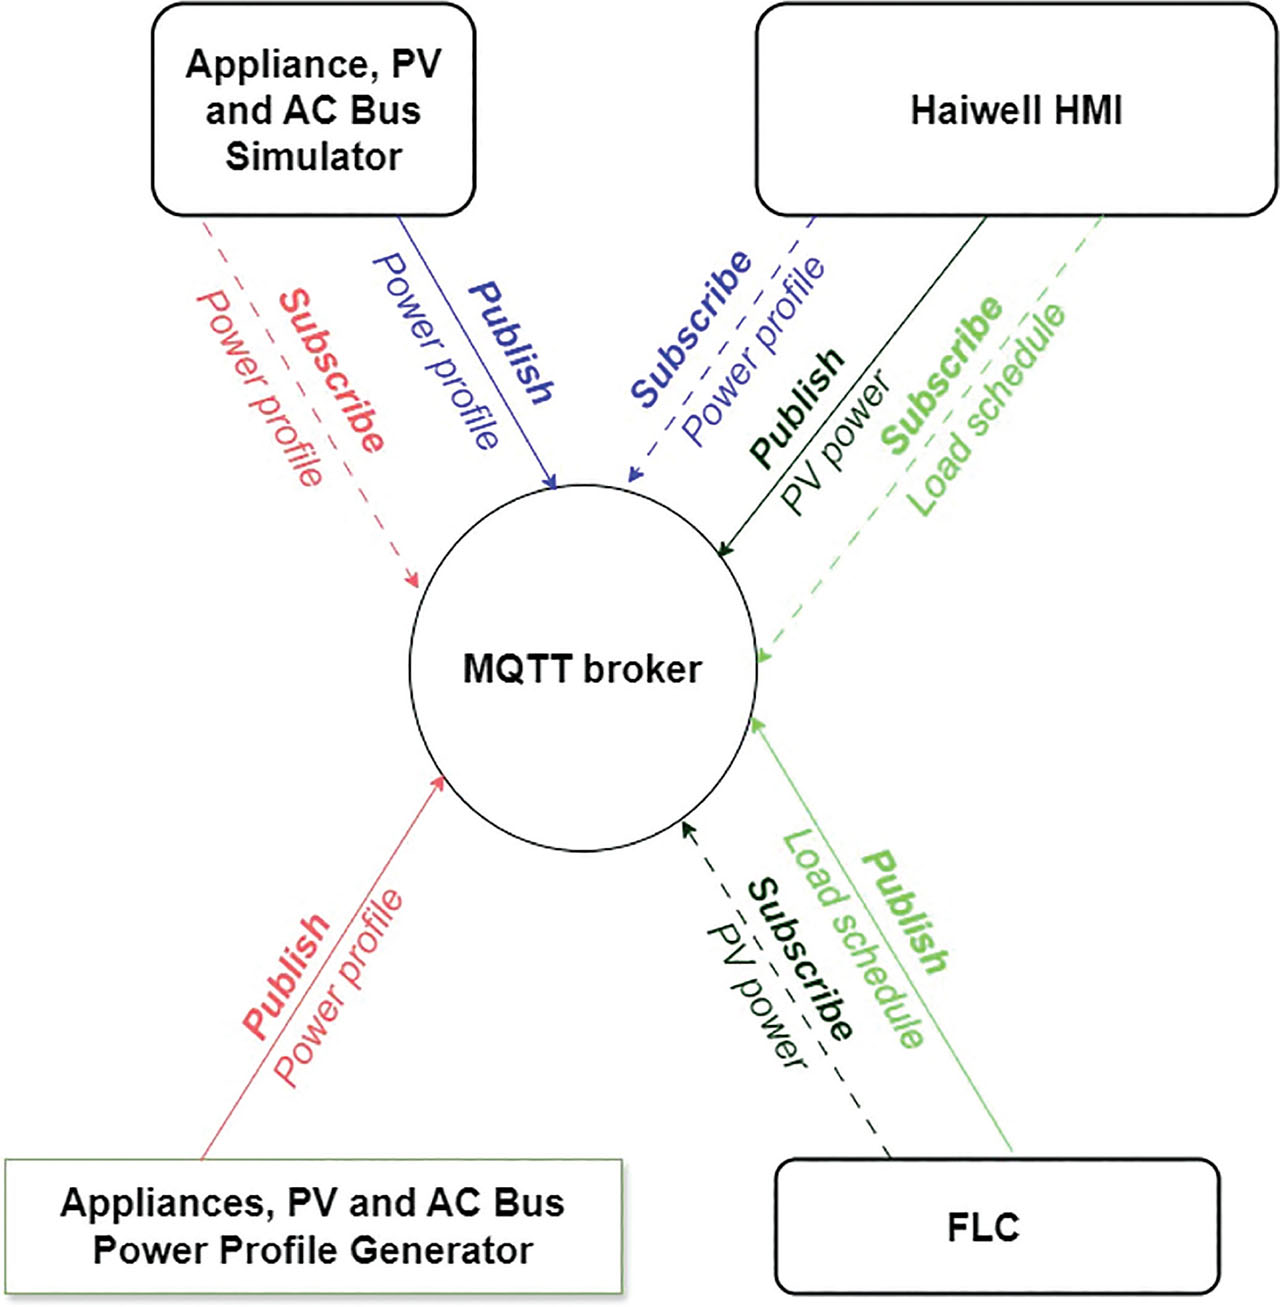
Figure 3:
MQTT data communication. AC, air conditioner; FLC, fuzzy logic controller; HMI, human machine interface; MQTT, message queuing telemetry transport.
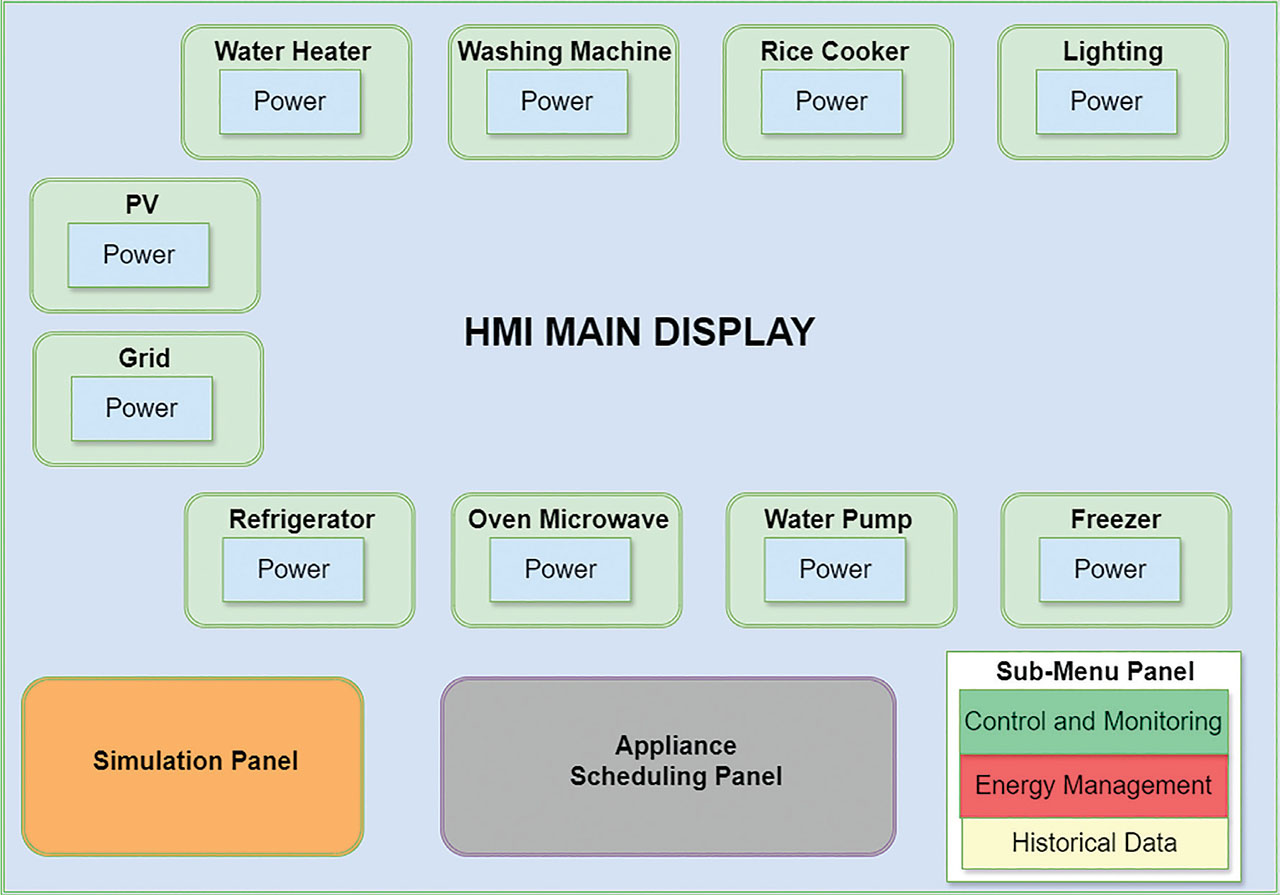
Figure 4:
Design of HMI main display. HMI, human machine interface.
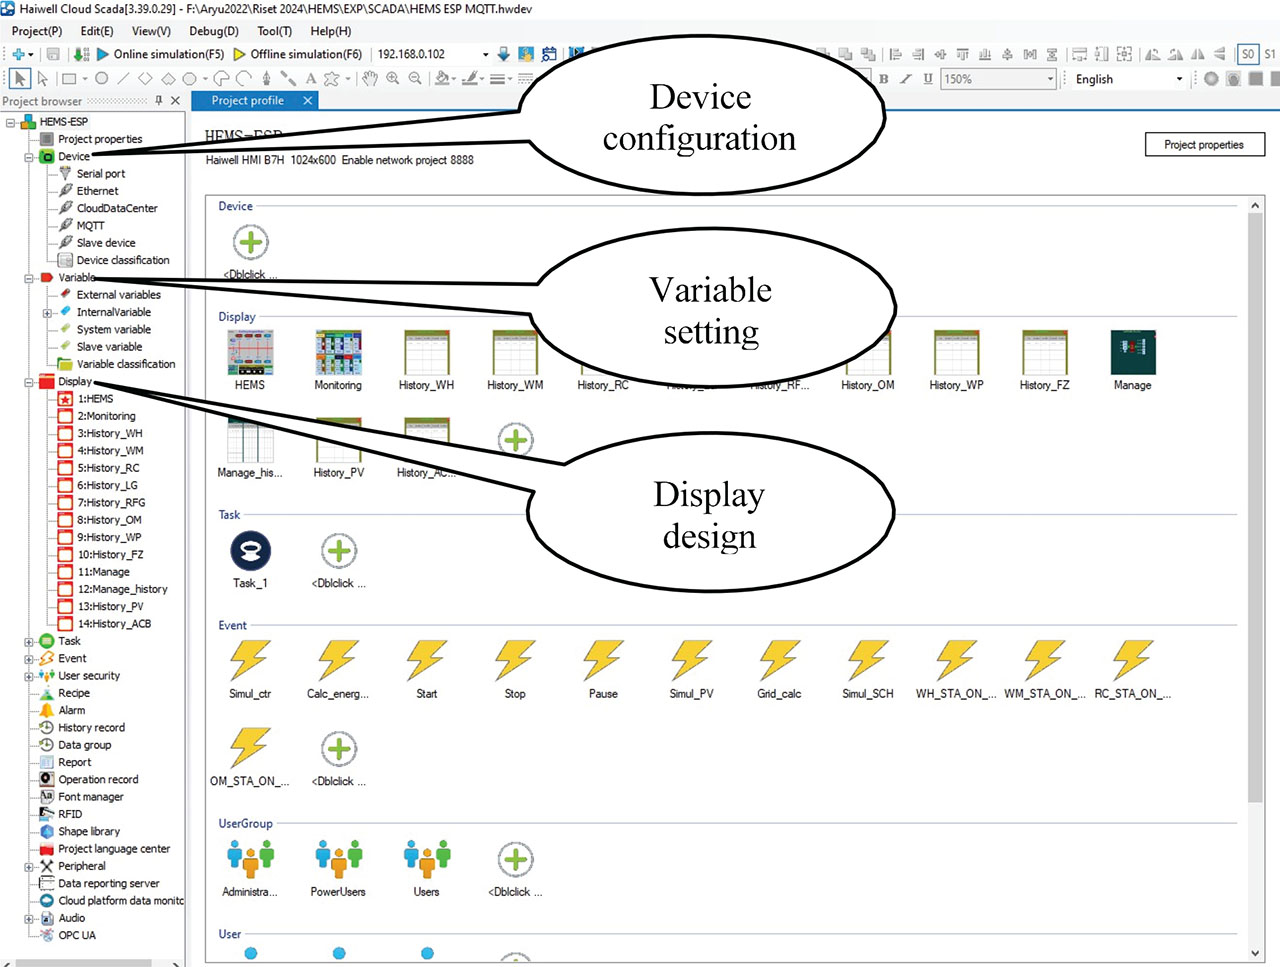
Figure 5:
Project manager menu of Haiwell Cloud SCADA software. SCADA, supervisory control and data acquisition.
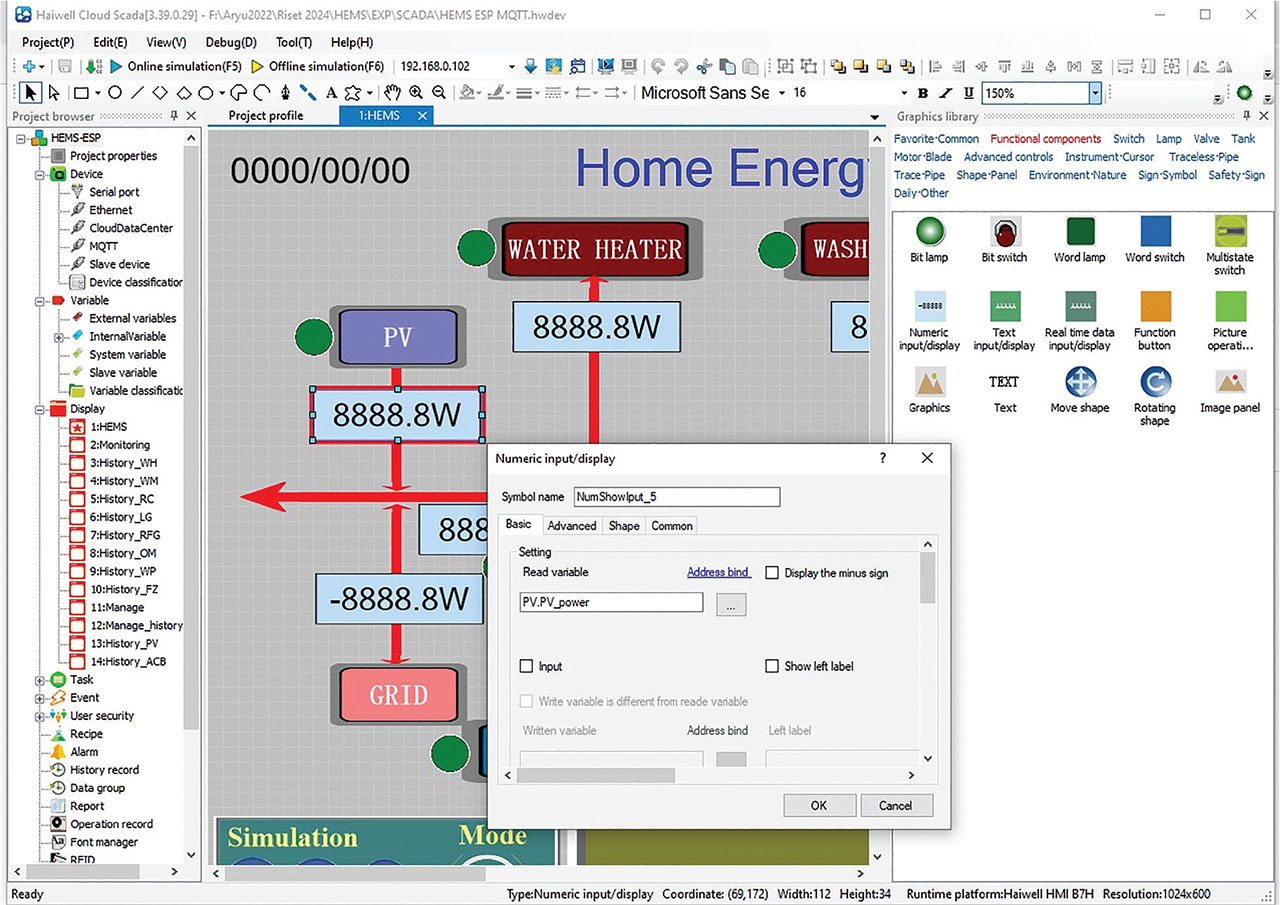
Figure 6:
Display designer tool of Haiwell Cloud SCADA software. SCADA, supervisory control and data acquisition.
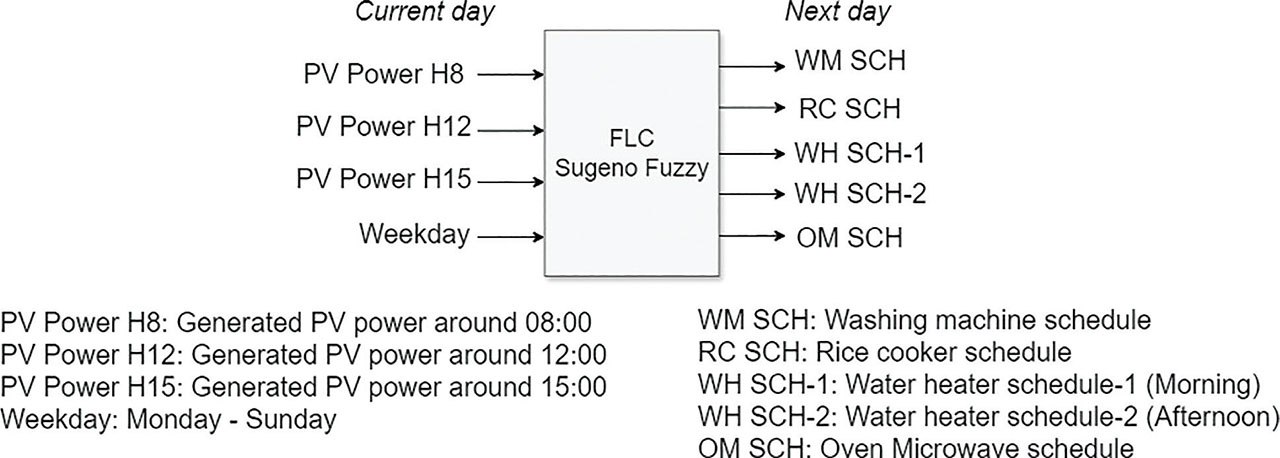
Figure 7:
Architecture of FLC-based appliance scheduling. FLC, fuzzy logic controller; OM SCH, microwave oven schedule; RC SCH, rice cooker schedule; WH SCH, water heater schedule; WM SCH, washing machine schedule.
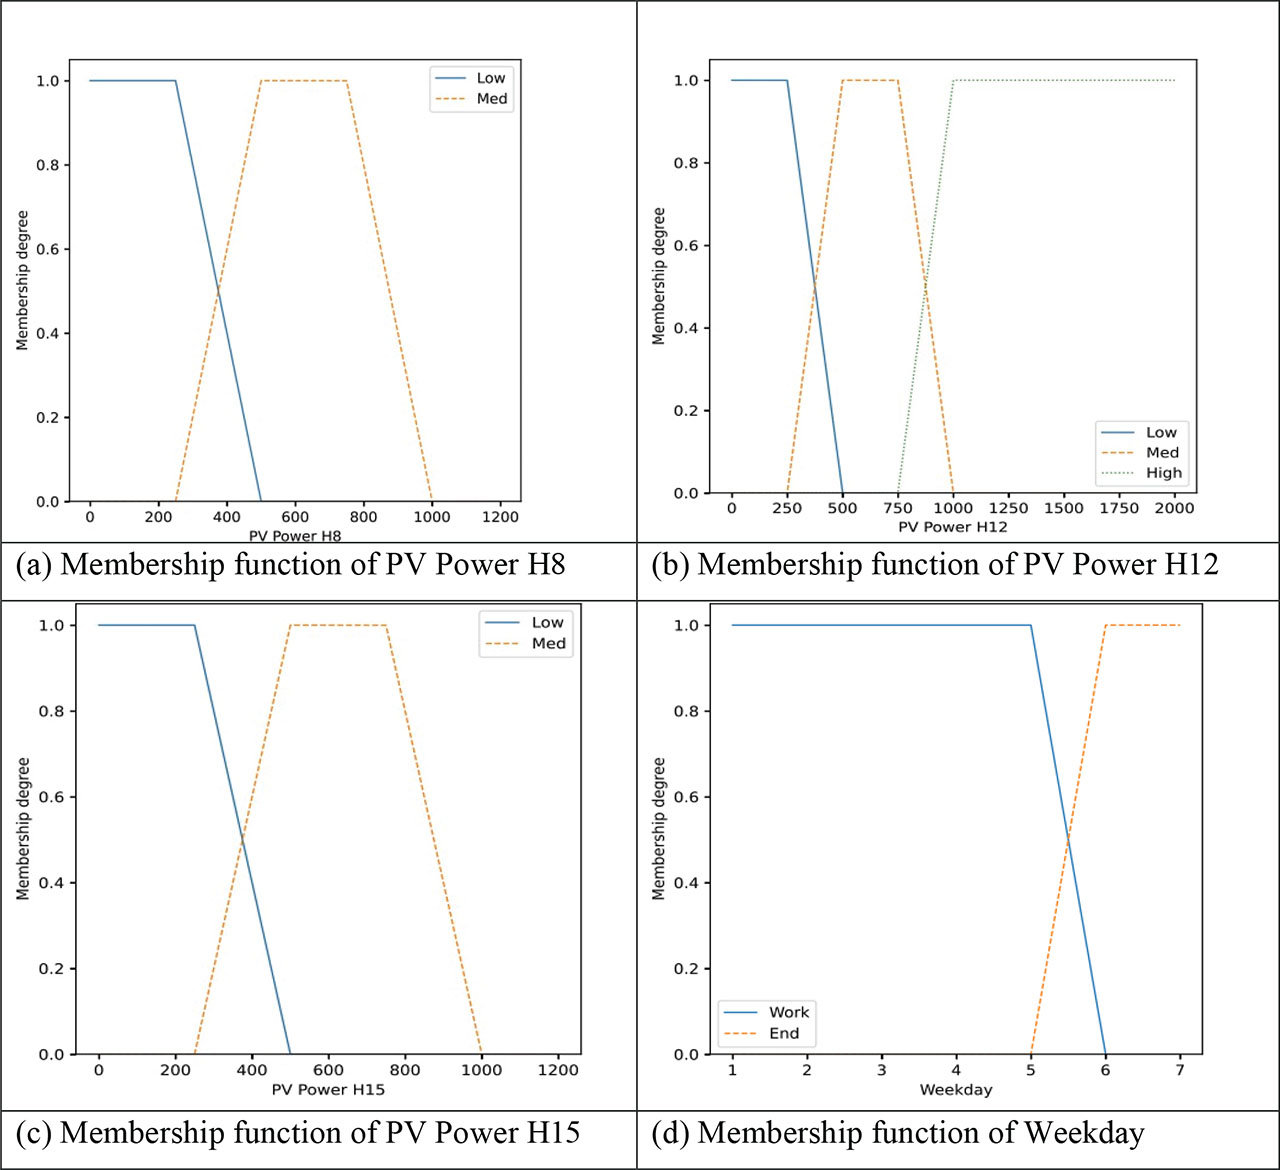
Figure 8:
FLC membership function. FLC, fuzzy logic controller.
Table 1:
Some fuzzy rules in the first scenario (Fuzzy-A)
| No. | PV Power H8 | PV Power H12 | PV Power H15 | Weekday | RC SCH | WH SCH1 | WM SCH | OM SCH | WH SCH2 |
|---|---|---|---|---|---|---|---|---|---|
| 1 | Low | Low | Low | Work | 6 | 7 | 12 | 15 | 17 |
| 2 | Low | Low | Low | Off | 8 | 9 | 12 | 14 | 15 |
| 3 | Low | Low | Med | Work | 6 | 7 | 12 | 15 | 17 |
| 4 | Low | Low | Med | Off | 8 | 9 | 12 | 15 | 16 |
| … | … | … | … | … | … | … | … | … | … |
| 21 | Med | High | Low | Work | 6 | 7 | 10 | 15 | 17 |
| 22 | Med | High | Low | Off | 7 | 8 | 10 | 14 | 15 |
| 23 | Med | High | Med | Work | 6 | 7 | 10 | 15 | 17 |
| 24 | Med | High | Med | Off | 7 | 8 | 10 | 15 | 16 |
Table 2:
Some fuzzy rules in the second scenario (Fuzzy-B)
| No. | PV Power H8 | PV Power H12 | PV Power H15 | Weekday | RC SCH | WH SCH1 | WM SCH | OM SCH | WH SCH2 |
|---|---|---|---|---|---|---|---|---|---|
| 1 | Low | Low | Low | Work | 7 | 8 | 12 | 14 | 15 |
| 2 | Low | Low | Low | Off | 8 | 9 | 12 | 14 | 15 |
| 3 | Low | Low | Med | Work | 7 | 8 | 12 | 15 | 16 |
| 4 | Low | Low | Med | Off | 8 | 9 | 12 | 15 | 16 |
| … | … | … | … | … | … | … | … | … | … |
| 21 | Med | High | Low | Work | 6 | 7 | 10 | 14 | 15 |
| 22 | Med | High | Low | Off | 7 | 8 | 10 | 14 | 15 |
| 23 | Med | High | Med | Work | 6 | 7 | 10 | 15 | 16 |
| 24 | Med | High | Med | Off | 7 | 8 | 10 | 15 | 16 |
Table 3:
Some fuzzy rules in the third scenario (Fuzzy-C)
| No. | PV Power H8 | PV Power H12 | PV Power H15 | Weekday | RC SCH | WH SCH1 | WM SCH | OM SCH | WH SCH2 |
|---|---|---|---|---|---|---|---|---|---|
| 1 | Low | Low | Low | Work | 9 | 10 | 12 | 13 | 14 |
| 2 | Low | Low | Low | Off | 9 | 10 | 12 | 13 | 14 |
| 3 | Low | Low | Med | Work | 9 | 10 | 12 | 14 | 15 |
| 4 | Low | Low | Med | Off | 9 | 10 | 12 | 14 | 15 |
| … | … | … | … | … | … | … | … | … | … |
| 21 | Med | High | Low | Work | 8 | 9 | 11 | 13 | 14 |
| 22 | Med | High | Low | Off | 8 | 9 | 11 | 13 | 14 |
| 23 | Med | High | Med | Work | 8 | 9 | 11 | 14 | 15 |
| 24 | Med | High | Med | Off | 8 | 9 | 11 | 14 | 15 |
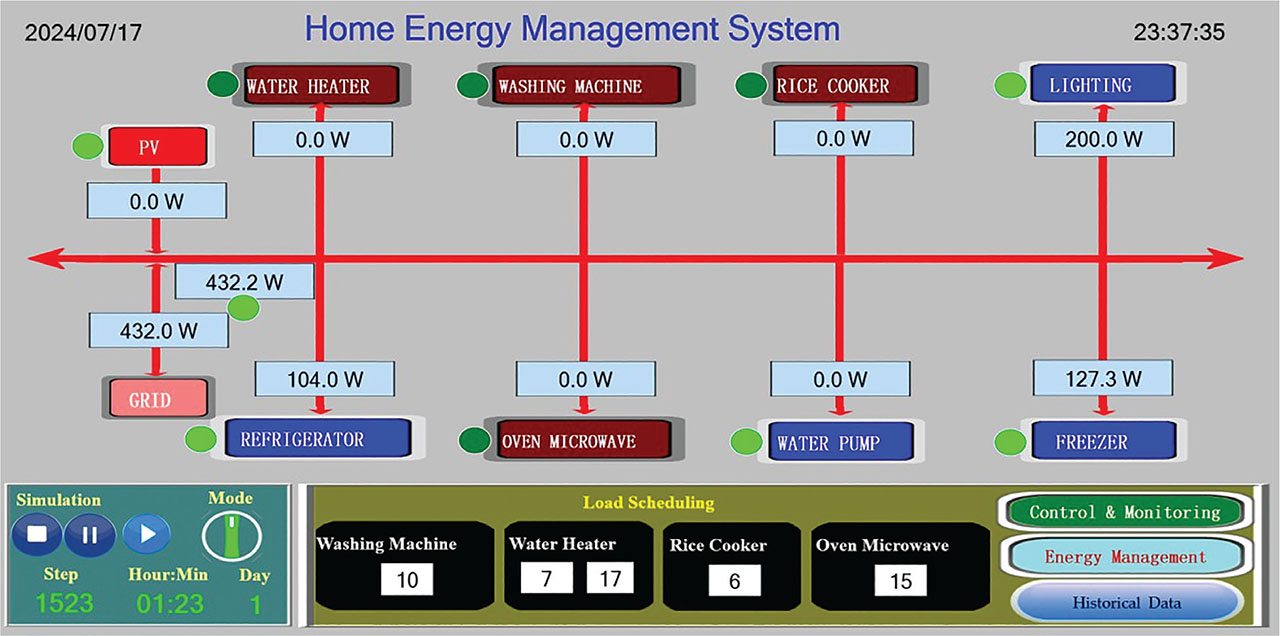
Figure 9:
SCADA HMI main display. HMI, human machine interface; SCADA, supervisory control and data acquisition.
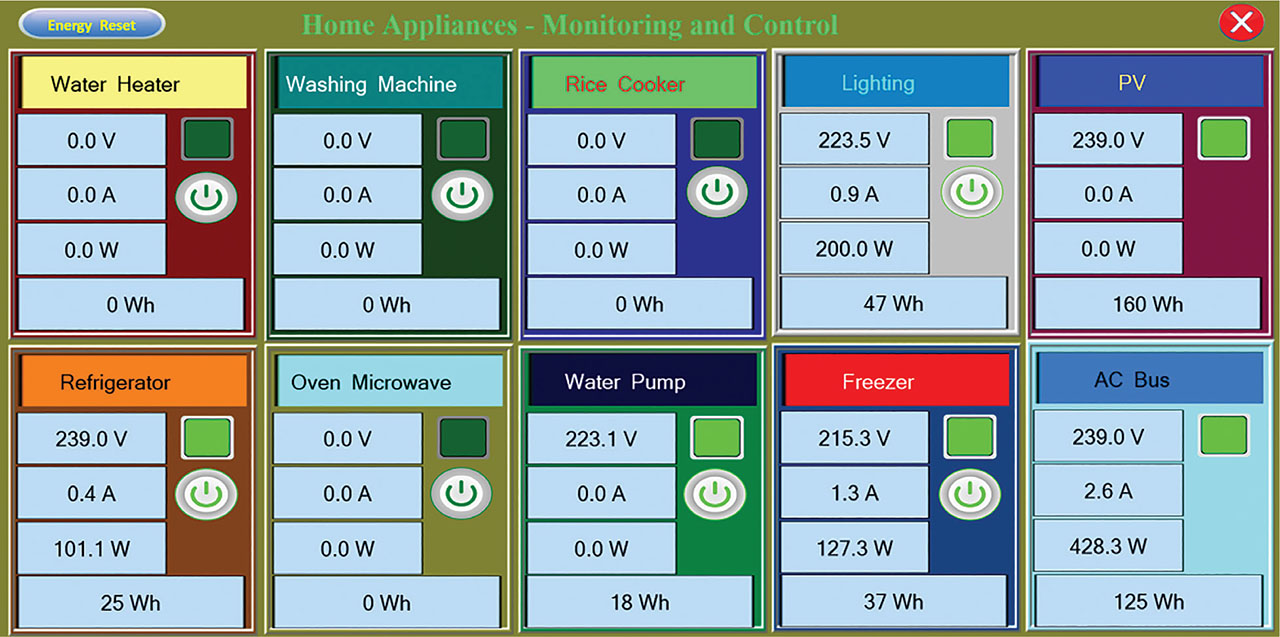
Figure 10:
SCADA HMI monitoring and control display. HMI, human machine interface; SCADA, supervisory control and data acquisition.
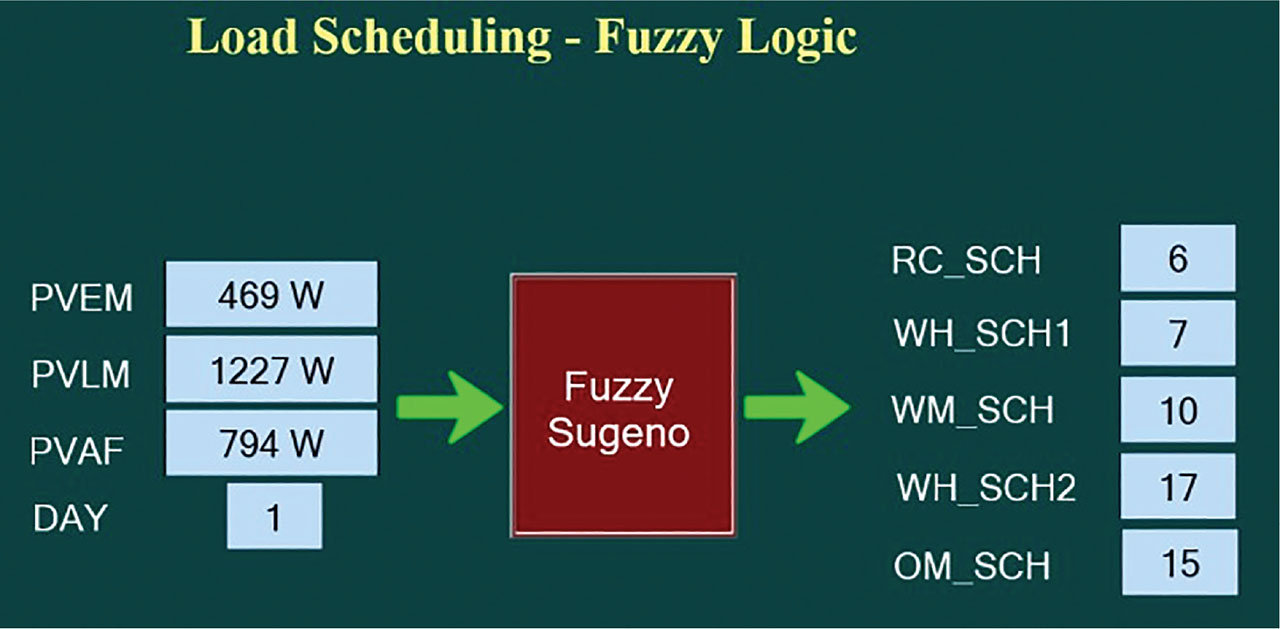
Figure 11:
SCADA HMI FLC-based appliance scheduling display. FLC, fuzzy logic controller; HMI, human machine interface; OM SCH, microwave oven schedule; RC SCH, rice cooker schedule; SCADA, supervisory control and data acquisition; WH SCH, water heater schedule; WM SCH, washing machine schedule.
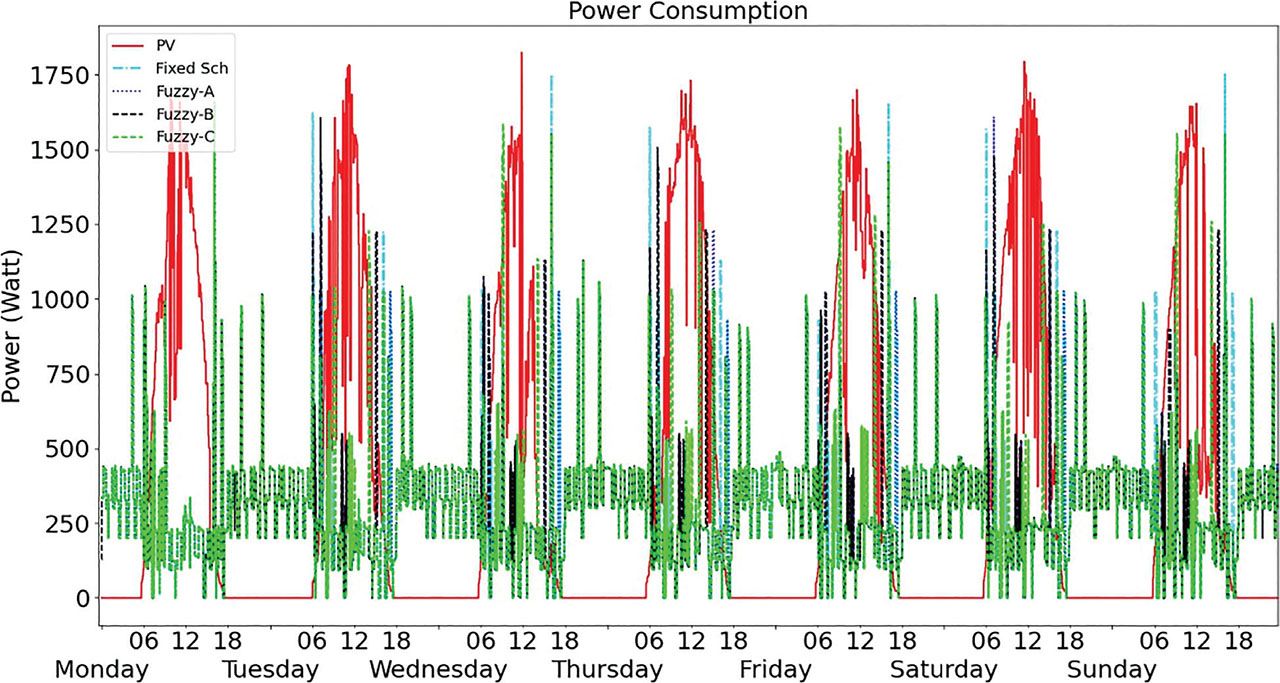
Figure 12:
PV power generation and home appliances’ power consumption profiles during a week.
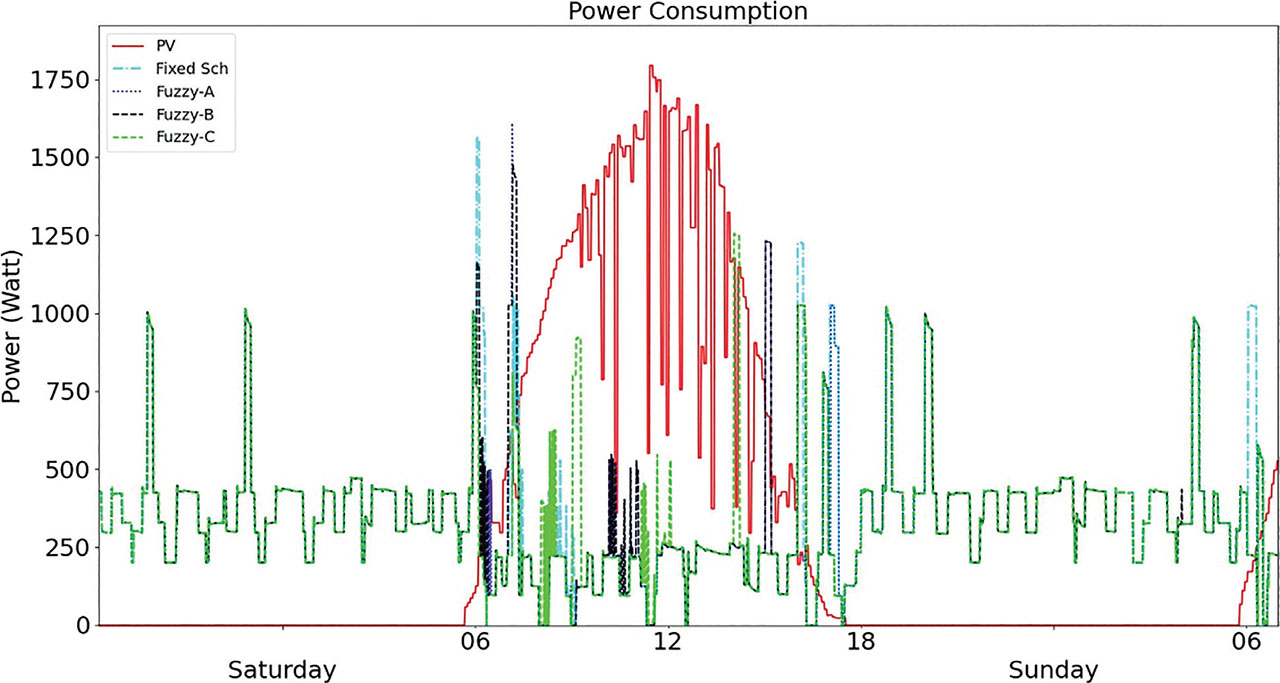
Figure 13:
PV power generation and home appliances’ power consumption profiles in 1 day.
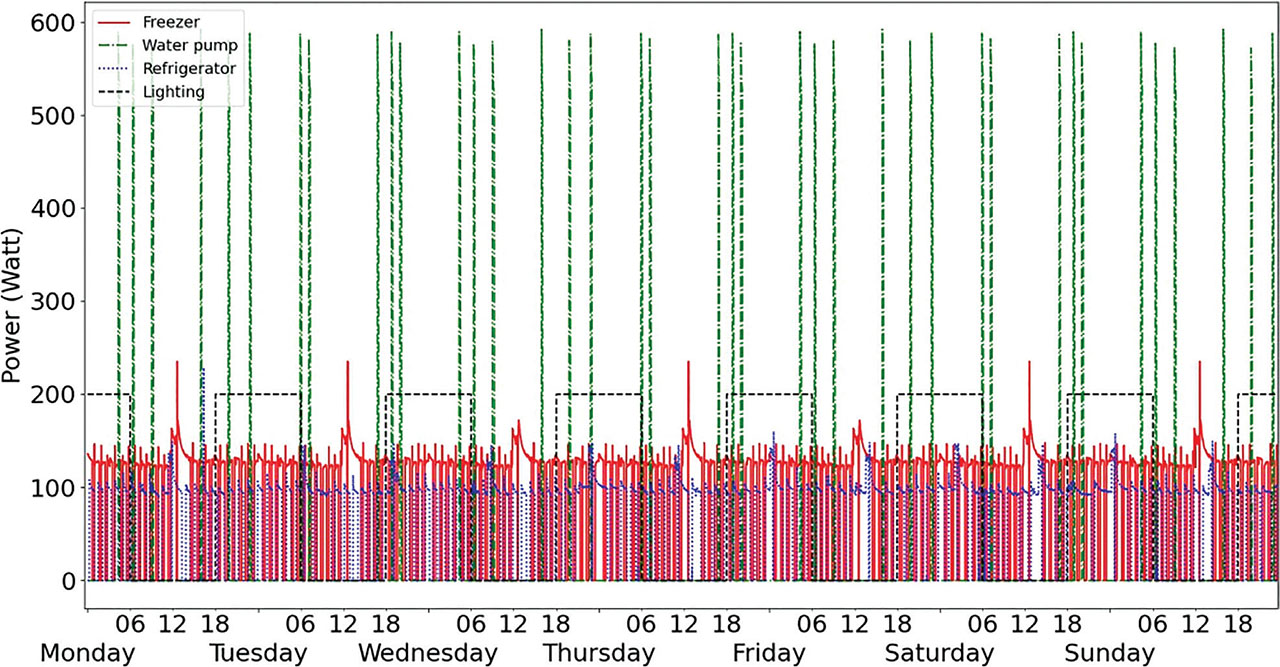
Figure 14:
Non-schedulable appliance power consumption profiles during a week.
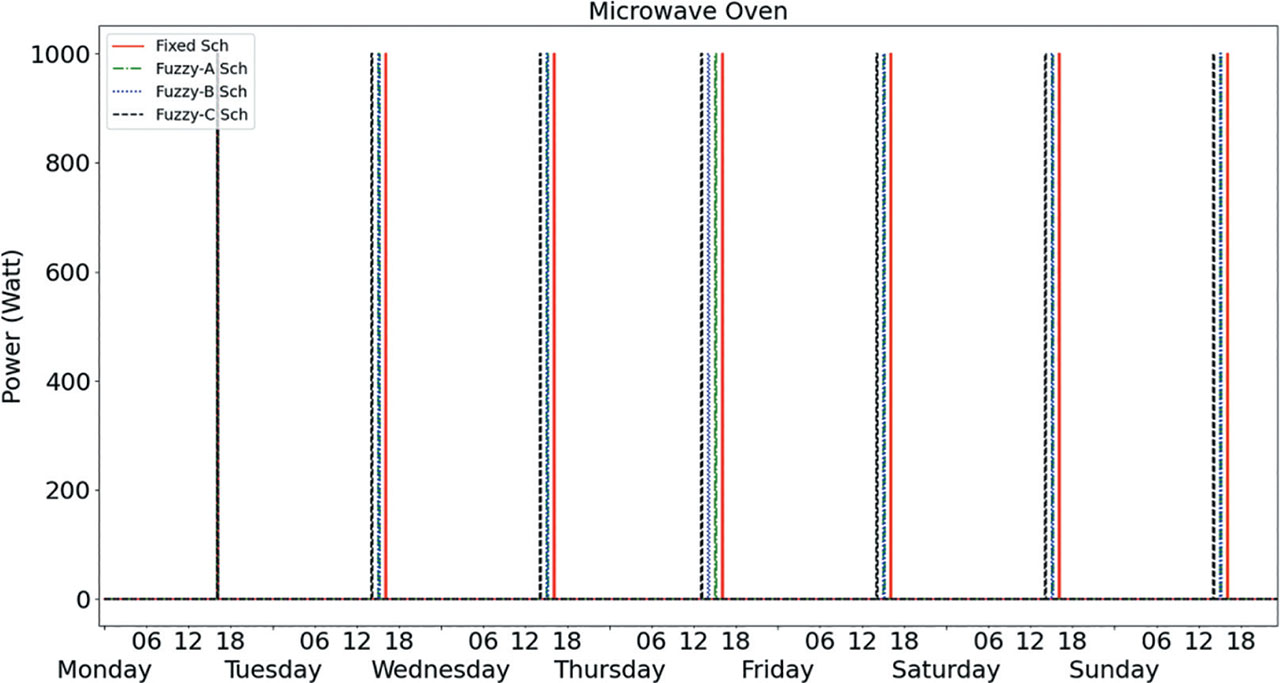
Figure 15:
Microwave oven power consumption profiles during a week.
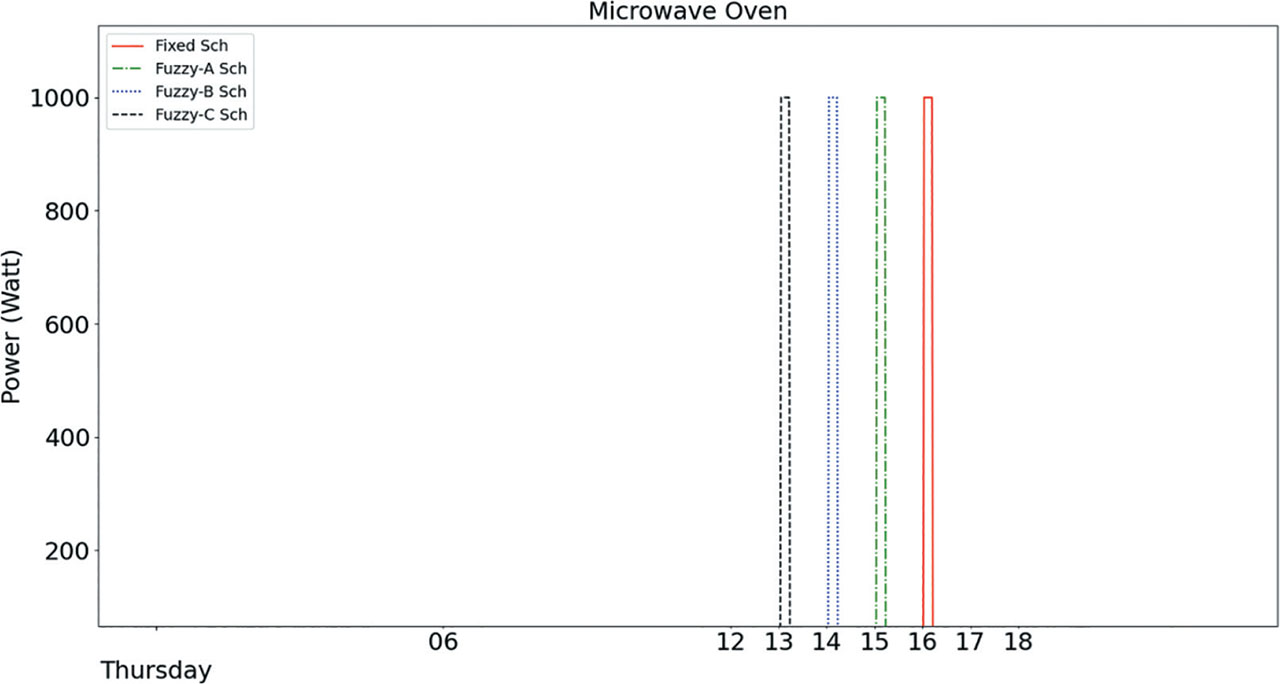
Figure 16:
Microwave oven power consumption profiles in 1 day.
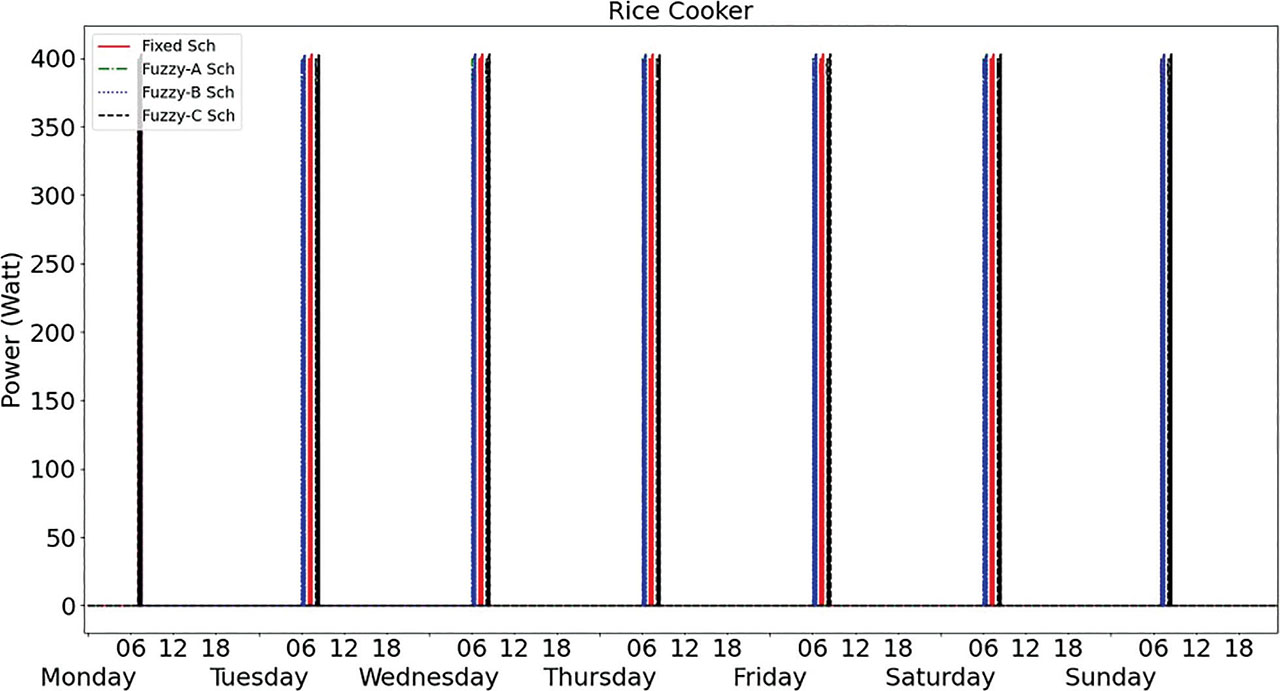
Figure 17:
Rice cooker power consumption profiles during a week.
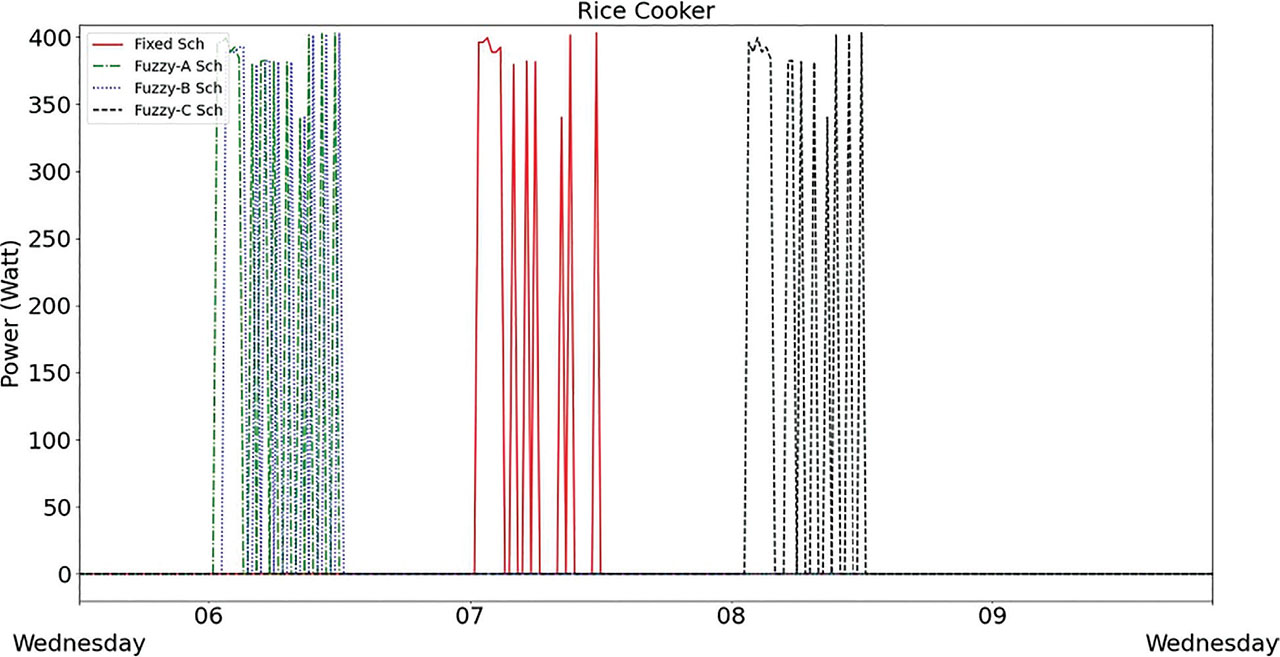
Figure 18:
Rice power consumption profiles in 1 day.
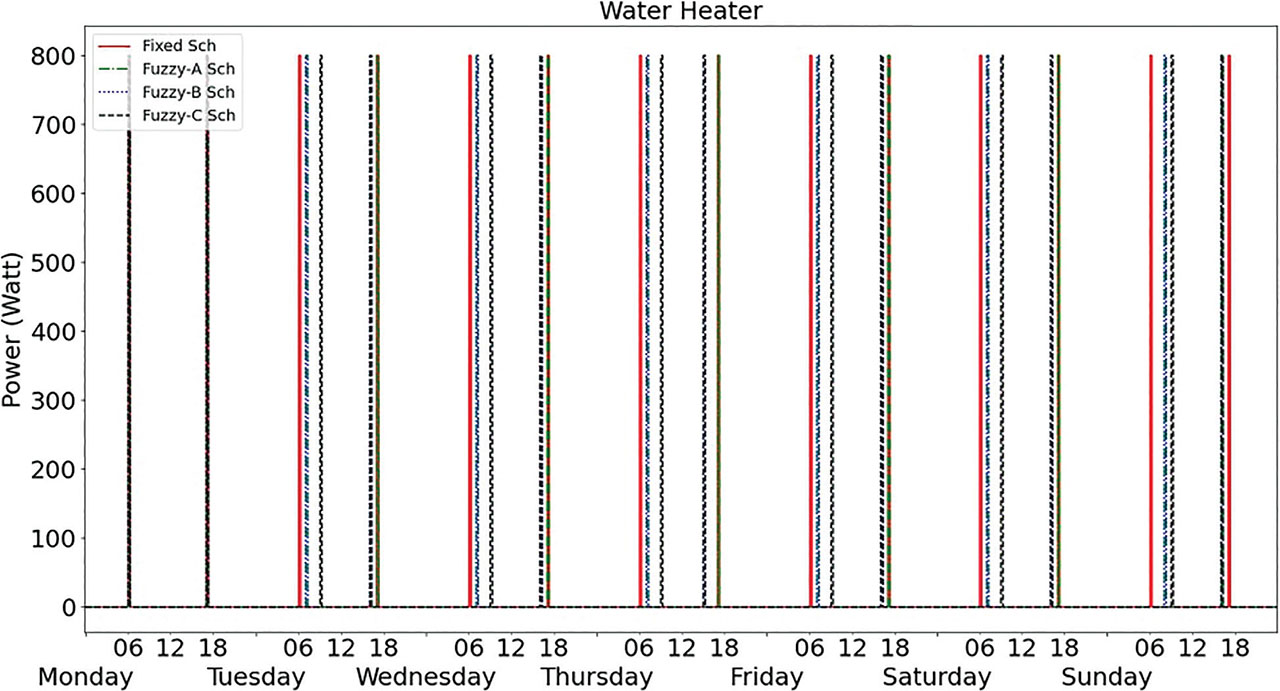
Figure 19:
Water heater power consumption profiles during a week.
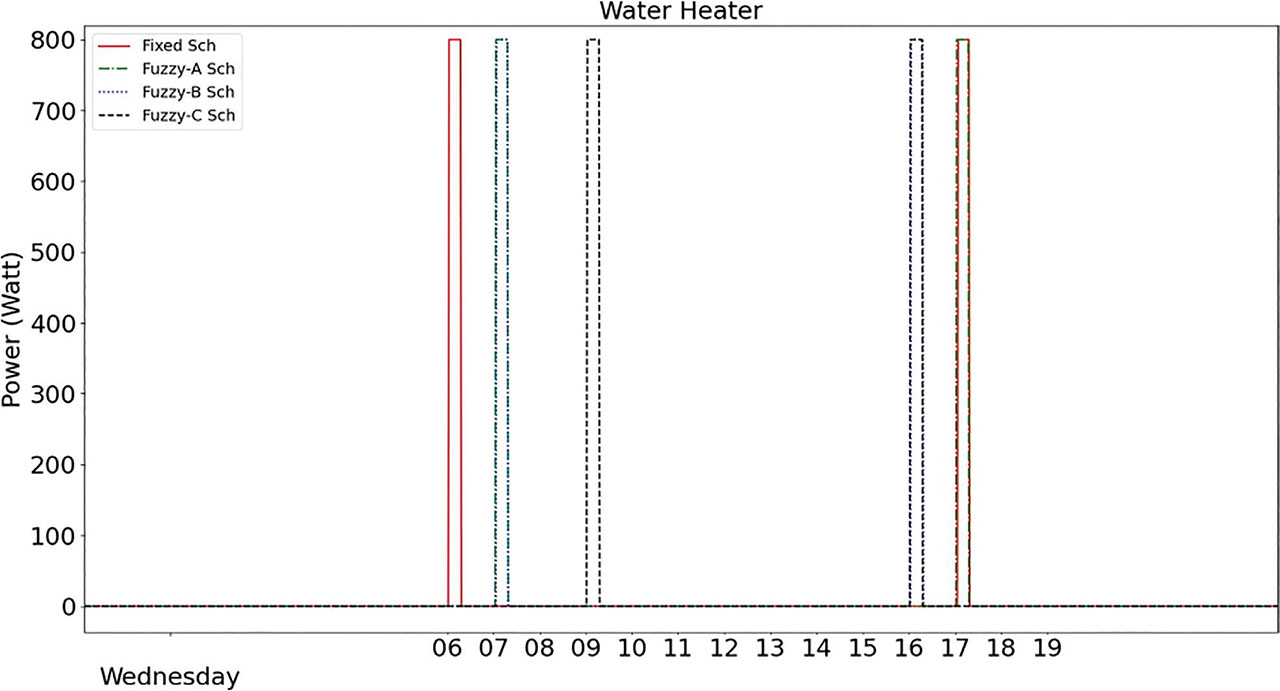
Figure 20:
Water heater power consumption profiles in 1 day.
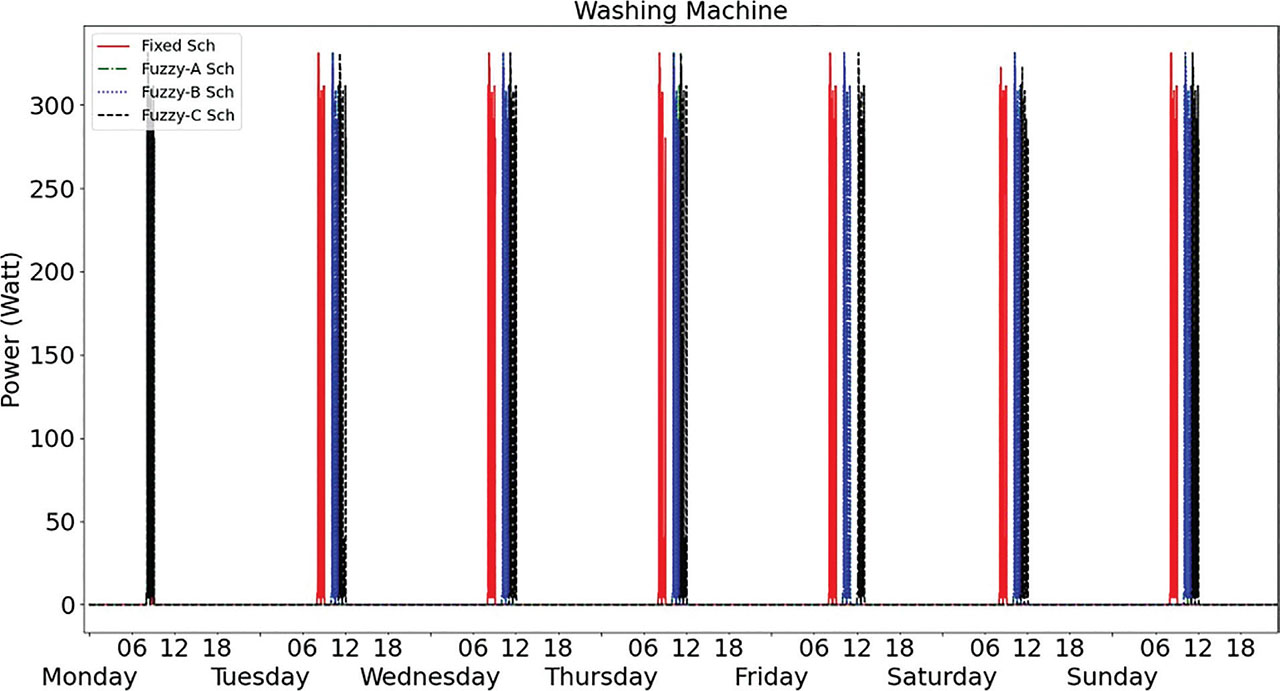
Figure 21:
Washing machine power consumption profiles during a week.
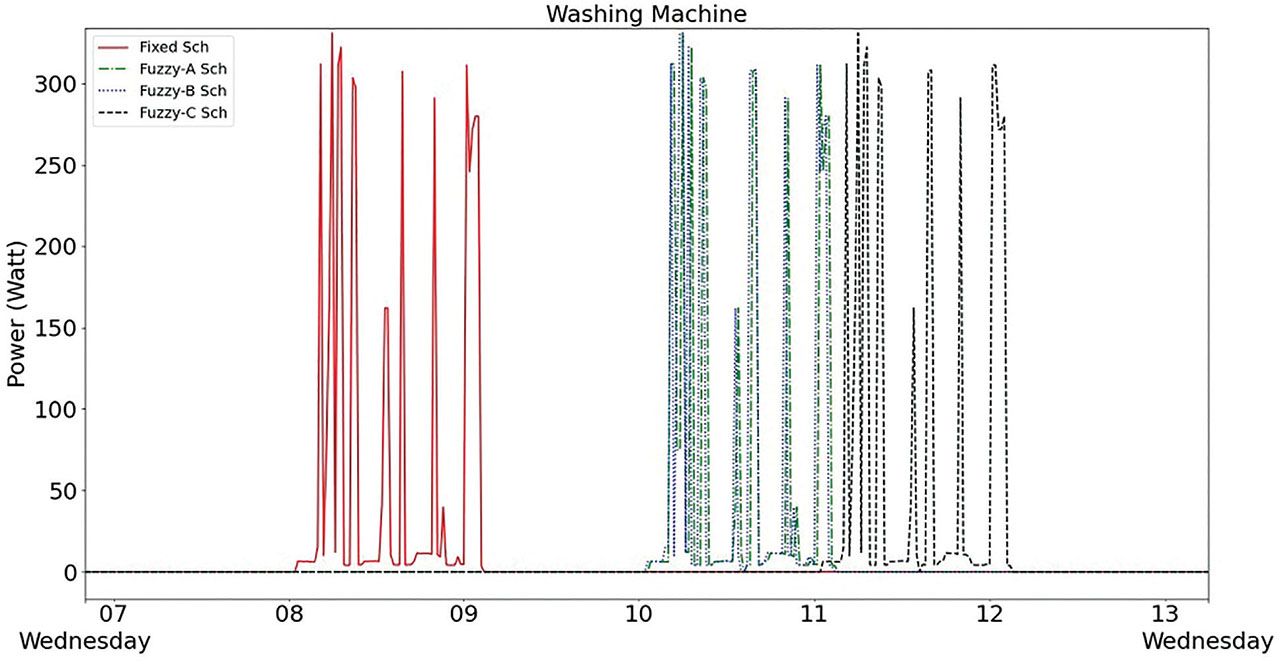
Figure 22:
Washing machine power consumption profiles in 1 day.
Table 4:
Comparison of daily energy consumption from grid
| Monday | Tuesday | Wednesday | Thursday | Friday | Saturday | Sunday | |
|---|---|---|---|---|---|---|---|
| Fixed | 5,323.05 | 5,681.67 | 5,568.30 | 5,535.62 | 5,455.28 | 5,750.07 | 5,501.20 |
| Fuzzy-A | 5,355.93 | 5,679.64 | 5,576.08 | 5,478.09 | 5,424.97 | 5,675.41 | 5,303.84 |
| Fuzzy-B | 5,311.13 | 5,663.61 | 5,565.32 | 5,260.69 | 5,377.45 | 5,642.21 | 5,282.40 |
| Fuzzy-C | 5,301.71 | 5,324.94 | 5,483.92 | 5,030.17 | 5,298.20 | 5,385.92 | 5,204.98 |
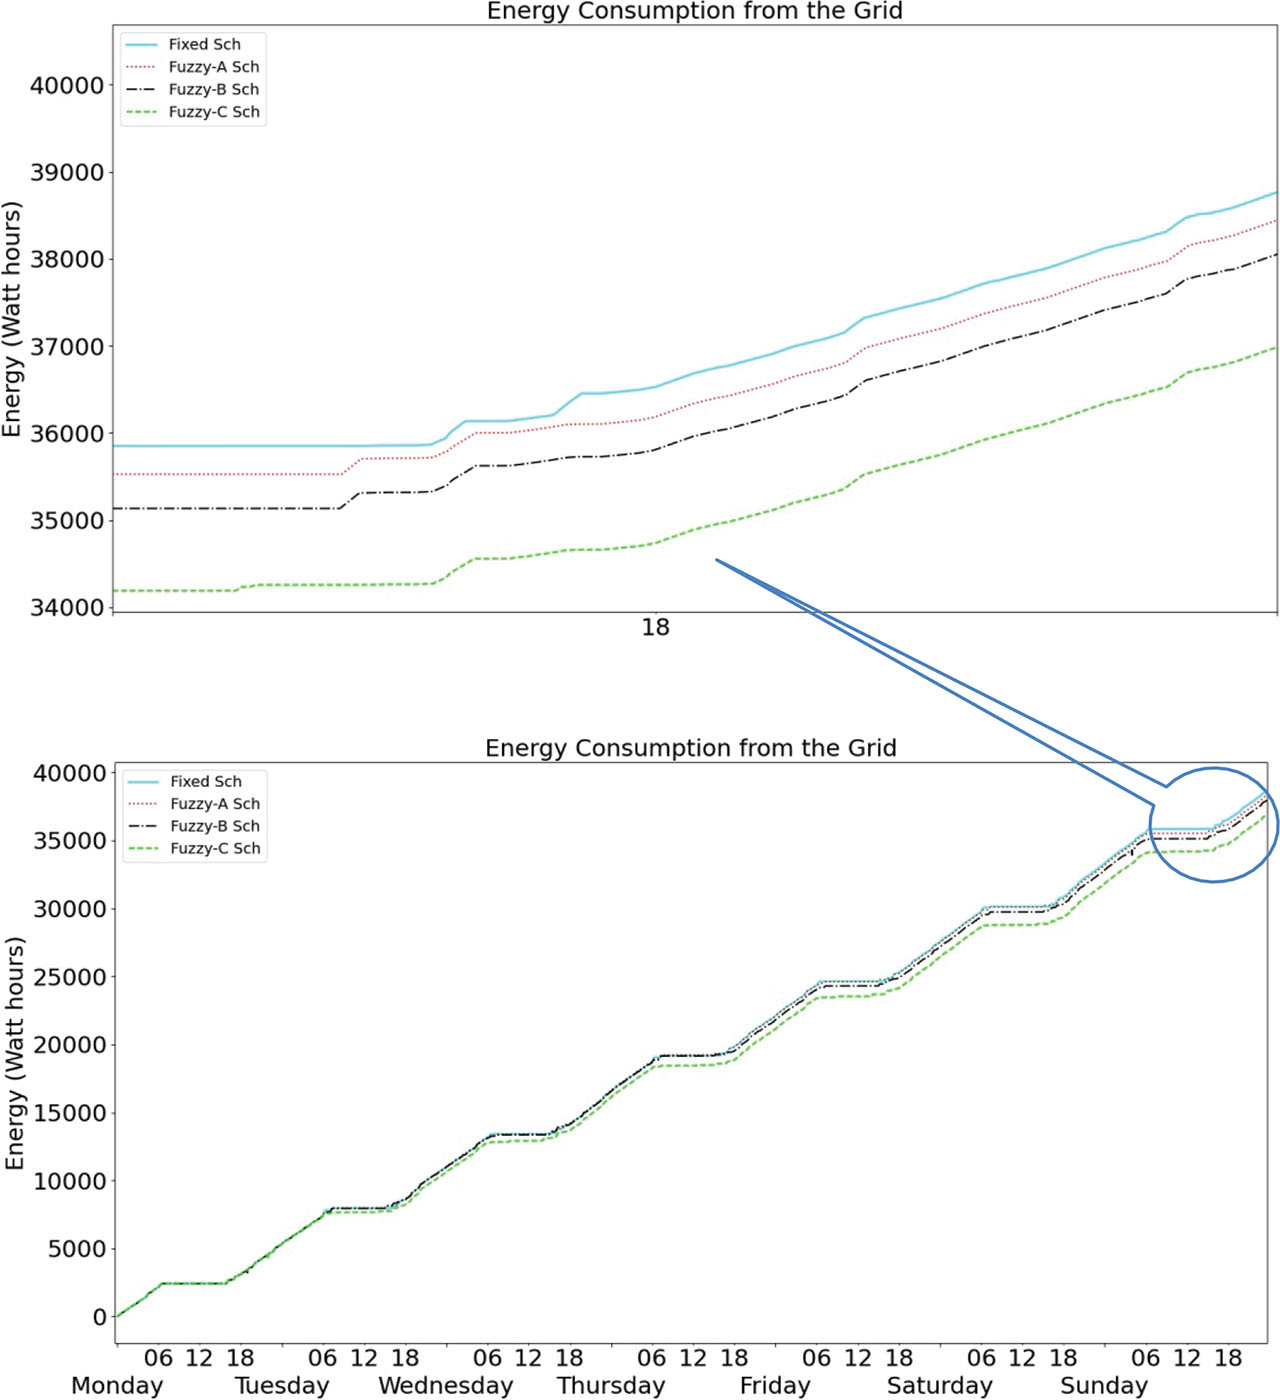
Figure 23:
Energy consumption from the grid profile during a week.
Table 5:
Comparison of energy consumption from grid during a week
| Monday | Tuesday | Wednesday | Thursday | Friday | Saturday | Sunday | Reduction (%) | |
|---|---|---|---|---|---|---|---|---|
| Fixed | 5,323.05 | 11,004.72 | 16,573.01 | 22,108.64 | 27,563.92 | 33,313.99 | 38,815.19 | 0 |
| Fuzzy-A | 5,355.93 | 11,035.57 | 16,611.65 | 22,089.73 | 27,514.71 | 33,190.11 | 38,493.95 | 0.8 |
| Fuzzy-B | 5,311.13 | 10,974.73 | 16,540.05 | 21,800.74 | 27,178.19 | 32,820.40 | 38,102.80 | 1.8 |
| Fuzzy-C | 5,301.71 | 10,626.65 | 16,110.57 | 21,140.74 | 26,438.94 | 31,824.86 | 37,029.84 | 4.6 |