
Table 1:
Summary of related work
| Reference | Dataset used | Evaluation metrics | Limitations/future scope |
|---|---|---|---|
| [1] | Datasets of two Udacity ND programs: ND-A and ND-B | ROC | In future, the indirect data can be incorporated into the GritNet. |
| [2] | WOU, XAPI, UCI, and AV student performance datasets | Precision, recall, F-score, and accuracy | Further validation on other large size imbalanced datasets is required. |
| [3] | Real data were collected from a multidisciplinary university | MAE and RMSE | Reliability of the system can be improved further by updating layers of NN |
| [4] | Dataset acquired from the “Khyber Pakh tunkhwa Board of Intermediate & Secondary Education” Peshawar | Accuracy and RMS | In big data environment, the DL models need to be integrated with traditional ML techniques. RNN model that updates learning rate is required to maximize precision of the prediction framework |
| [5] | Three different datasets | Accuracy | Educational contexts such as course subjects must be taken into account. Sample size aspect that verifies the empirical research results and implications is overlooked |
| [6] | Open University dataset | Precision, recall, accuracy, F1, and FM | This study basically focused on online mode of study, and in future, other modes can be analyzed. Hybrid models of TLBO optimization, ANN, and SVM were evaluated. Evaluation and comparison with other hybrid models is required to achieve more reliable predictions of academic performance |
| [7] | House, WOU, XAPI, UCI, and AV dataset | Accuracy | In future, the CNN model can be squeezed to reduce CNN structures |
| [8] | OULAD | Precision, recall, F1-score, and accuracy | As a limitation of this study, researchers should consider that MOOC students generate large clickstream records, and DL techniques require significant training time, which can delay data processing and evaluation of results. |
| [9] | OULAD | Precision, recall, F1-score, and accuracy | With fewer data streams, the system achieves lower accuracy, while more data streams improve prediction performance. In the future, data from various institutions and study areas will be collected to assess performance variations. Additionally, other DL and ML algorithms will be integrated to better understand relationships among student academic attributes and enhance prediction accuracy |
| [10] | OULA dataset | Accuracy, sensitivity, specificity, and precision | Limitation: It uses only a single dataset and limited performance metrics for predicting student performance, which affects its overall effectiveness. To achieve better results, more data should be considered. Future research can expand this work by using multiple datasets for student performance prediction |
[i] AV, analytics Vidhya; CNN, convolutional neural network; DL, deep learning; FM, Fowlkes-Mallows index; MAE, mean absolute error; ML, machine learning; MOOC, MAssive Open Online Courses; ND, nanodegree; NN, Neural Network; OULA, Open University Learning Analytics; OULAD, Open University Learning Analytics Dataset; RMS, root mean square; RMSE, root mean square error; ROC, receiver operating characteristic; TLBO, teaching–learning-based optimizer; UCI, University of California-Irvine; WOU, Western Ontario University; XAPI, experience API.
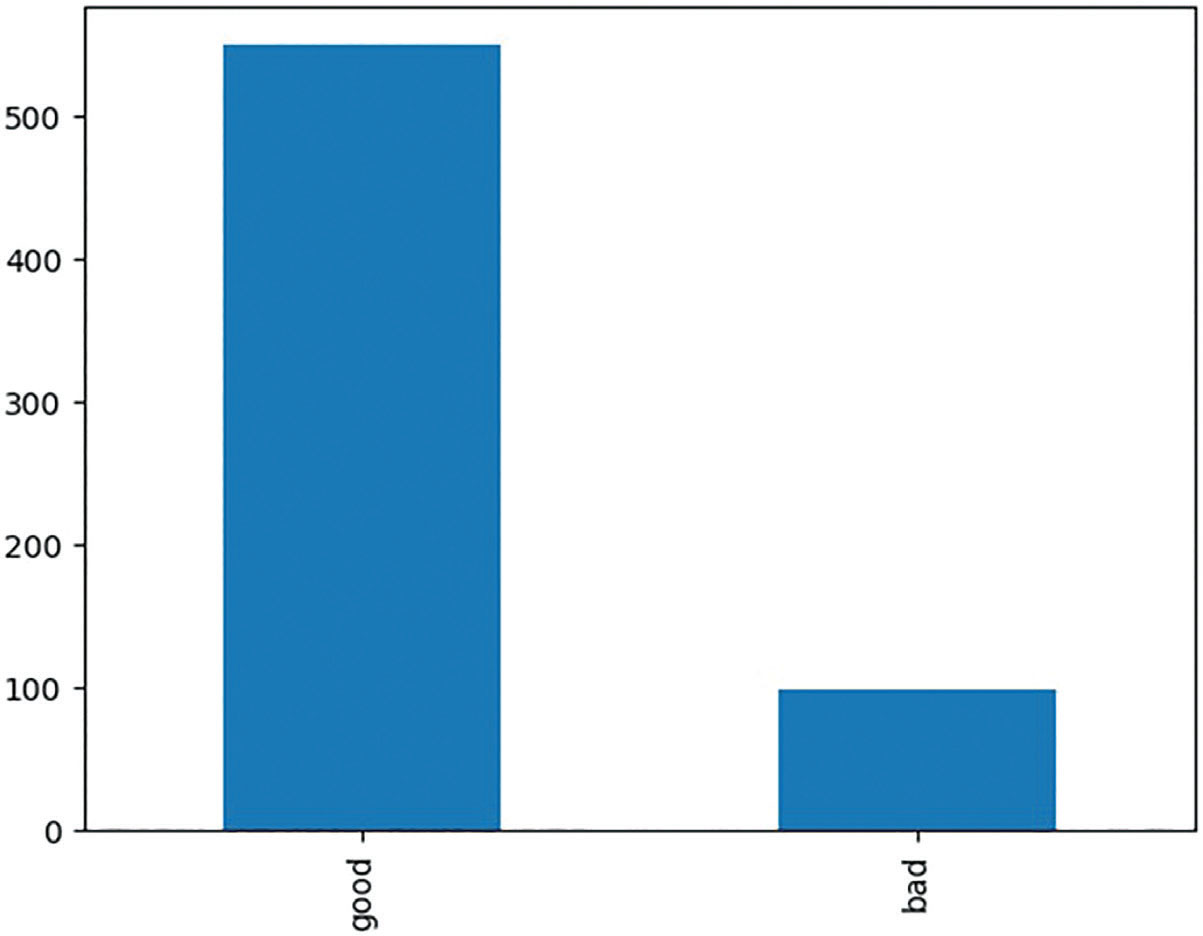
Figure 1:
Class distribution of dataset.
Table 2:
Descriptive analysis
| School | Sex | Age | Address | Family size | … | Absences | G1 | G2 | G3 | Performance | |
|---|---|---|---|---|---|---|---|---|---|---|---|
| Count | 649 | 649 | 649 | 649 | 649 | … | 649 | 649 | 649 | 649 | 649 |
| Unique | 2 | 2 | 8 | 2 | 2 | … | 24 | 27 | 16 | 17 | 2 |
| Top | GP | F | 17 | U | GT3 | … | 0 | 10 | 11 | 11 | Good |
| Frequency | 423 | 383 | 179 | 452 | 457 | … | 244 | 95 | 103 | 104 | 550 |
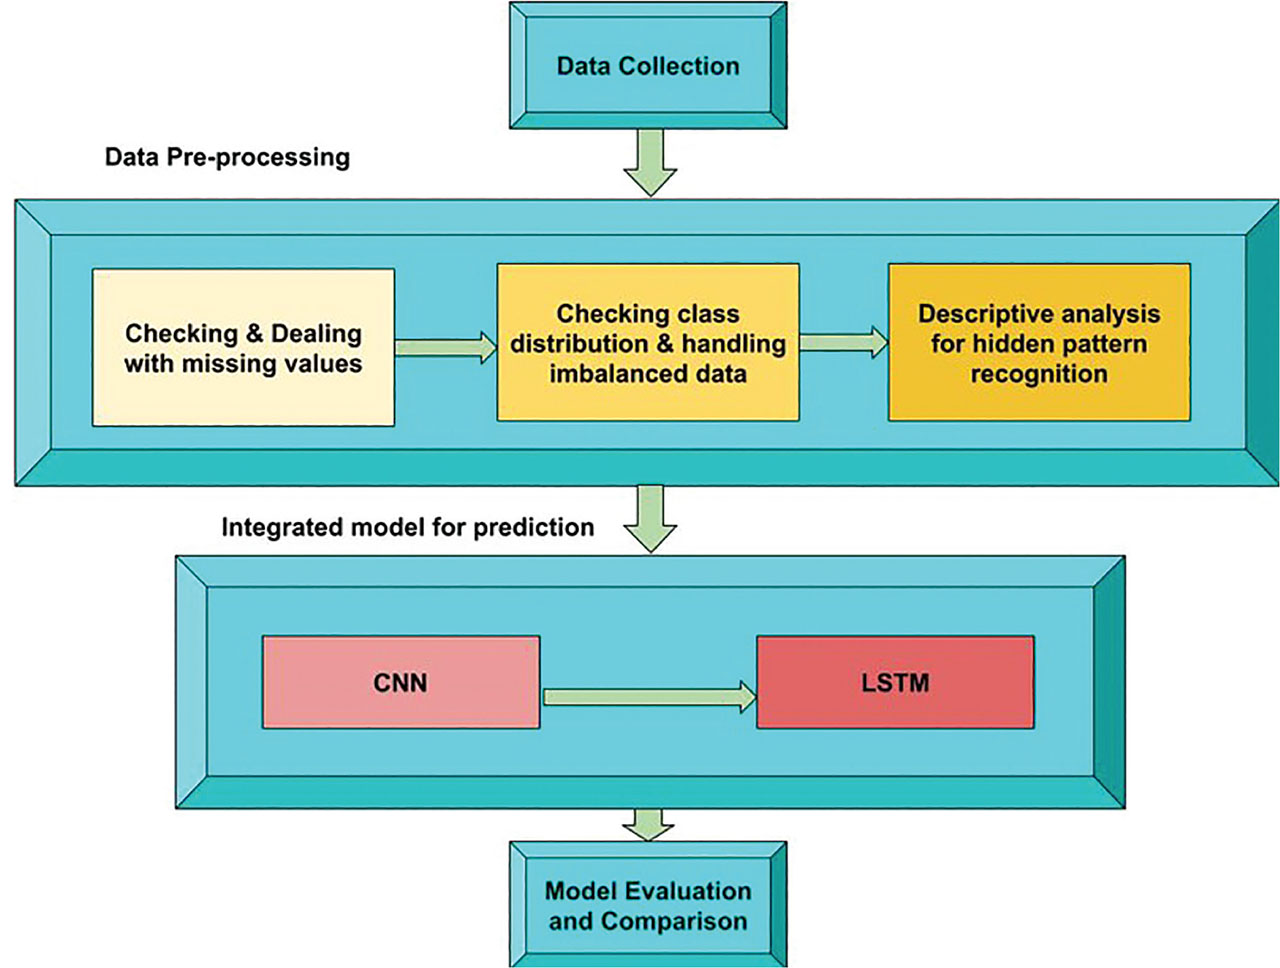
Figure 2:
Flowchart. CNN, convolutional neural network; LSTM, long short-term memory.
Table 3:
Comparison of LSTM-based student performance prediction models
| S.No | Model | Average accuracy | Average training time | Average loss |
|---|---|---|---|---|
| 1 | Simple LSTM | 85.83 | 333 ms/step | 0.2516 |
| 2 | LSTM with dropouts | 86.68 | 659 ms/step | 0.2334 |
| 3 | Bidirectional LSTM | 88.69 | 2 s/step | 0.2561 |
| 4 | Proposed CNN + LSTM | 98.45 | 183 ms/step | 0.1989 |
[i] CNN, convolutional neural network; LSTM, long short-term memory.
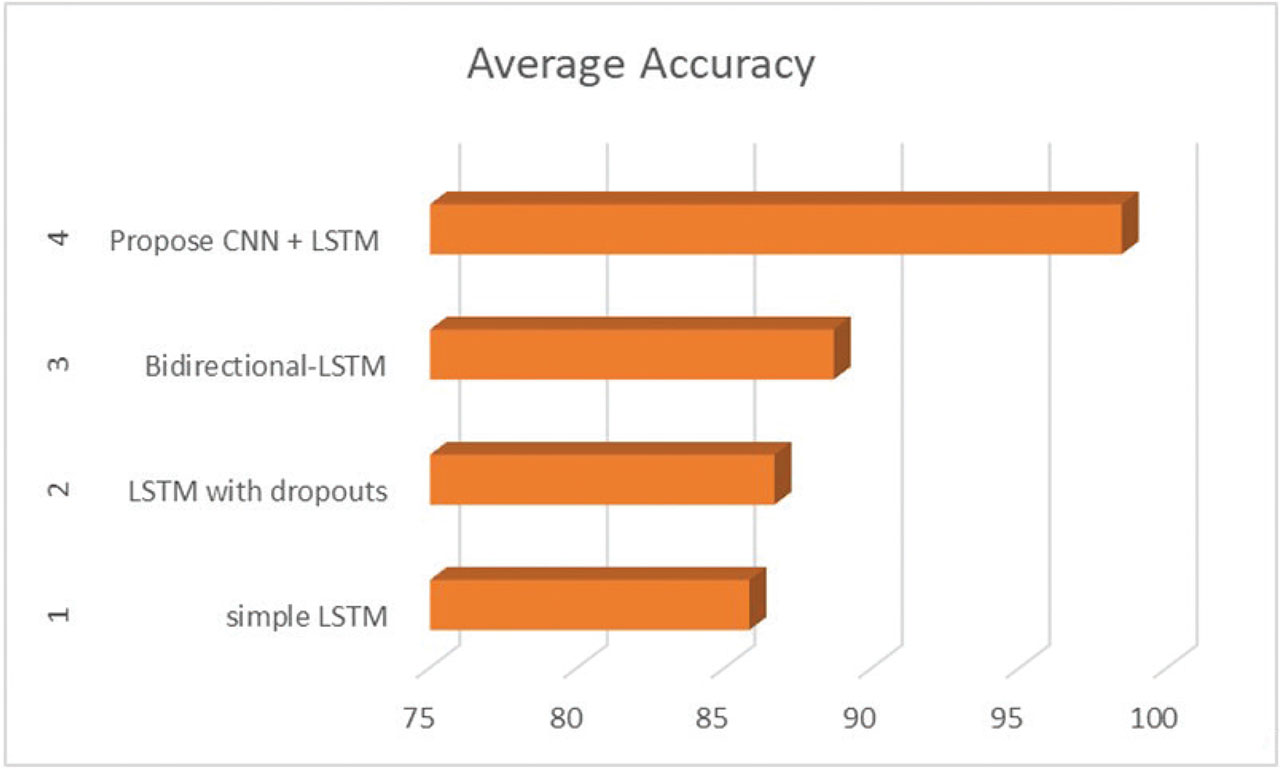
Figure 3:
Comparison of average accuracy. CNN, convolutional neural network; LSTM, long short-term memory.
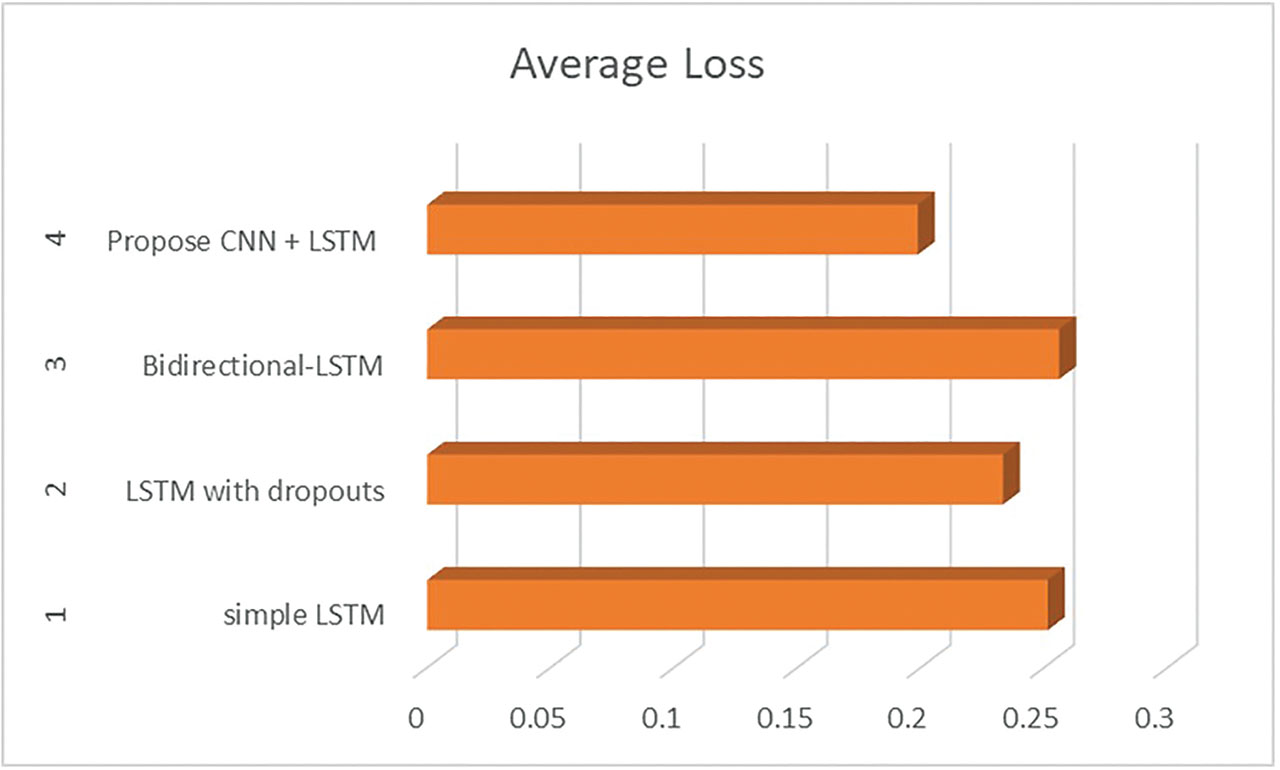
Figure 4:
Comparison of average loss. CNN, convolutional neural network; LSTM, long short-term memory.