
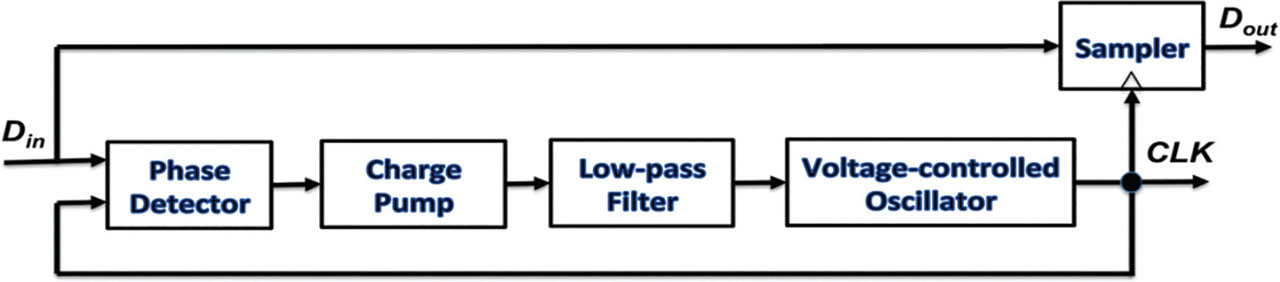
Figure 1:
Architecture of a CDR circuit using PLL. CDR, clock and data recovery; PLL, phase-locked loop.
Table 1:
Comparison of IoT communication protocols
| Wired protocols | Wireless protocol | ||||||||
|---|---|---|---|---|---|---|---|---|---|
| Characteristics | 1-wire protocol | PIC protocol | PDC protocol | Dynamic ECS protocol | Bluetooth  |  Zigbee Zigbee | Z-wave  | 6 LoWPAN  | SigFox  |
| Standard | NA | NA | NA | NA | IEEE 802.15.1 [20] | IEEE 802.15.4 [20] | Z-Wave [20] | IEEE 802.15.4 [20] | Sigfox [21] |
| Frequency bands | NA | 24 MHz [16] | 25 MHz [17] | 25 MHz [18] | 2.4 GHz [22] | 2.4 GHz [23] | 868–908 MHz [24] | 868 MHz (EU) | 868 MHz (EU) |
| 915 MHz (USA) | 902 MHz (USA) | ||||||||
| 2.4 GHz (Global) [24] | |||||||||
| Network | 1-wire network [8] | Ultra-low power network [16] | Ultra-low power network [17] | Ultra-low power network [18] | WPAN [25] | WPAN [25] | WPAN [25] | WPAN [25] | LPWAN [26] |
| Topology | Master and Slave [8] | Master and Slave [16] | Master and Slave [17] | Master and Slave [18] | Star–Bus [27] | Star, Mesh cluster | Mesh | Star-Mesh [27] | Star |
| Power | Low power protocol | 26.6 μW [16] | 25 μW [17] | 19 μW [18] | 30 mA Low power [28] | 30 mA Low power [28] | 2.5 mA Low power [29] | (1–2 years lifetime on batteries) [29] | 10–100 mW |
| Data rate | 16 Kbps [16] | 4.1 Mbps [16] | 7.33 Mbps [17] | 4.2–26.7 (6.4 Avg.) [18] | 1 Mbps | 250 Kbps | 40 Kbps [30] | 250 Kbps | 100–600 bps |
| Common applications | IoT sensor applications [16] | IoT sensor applications [16] | IoT sensor applications [17] | IoT sensor applications [18] | Wireless headsets, audio applications [31] | Controlling and monitoring home industry [31] | Home monitoring and controlling [31] | Monitor and control through the internet [31] | Energy meters & street lighting |

Figure 2:
(A) Normal serial transfer; (B) Edge-coded transmitter; (C) Edge-coded.
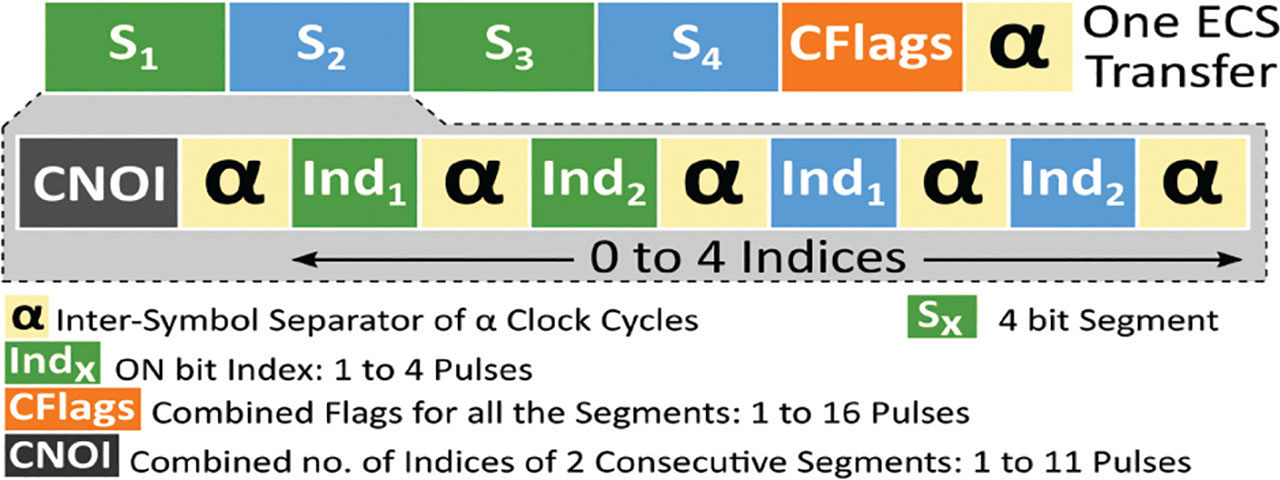
Figure 3:
ECS packet formation. ECS, edge coded signaling.
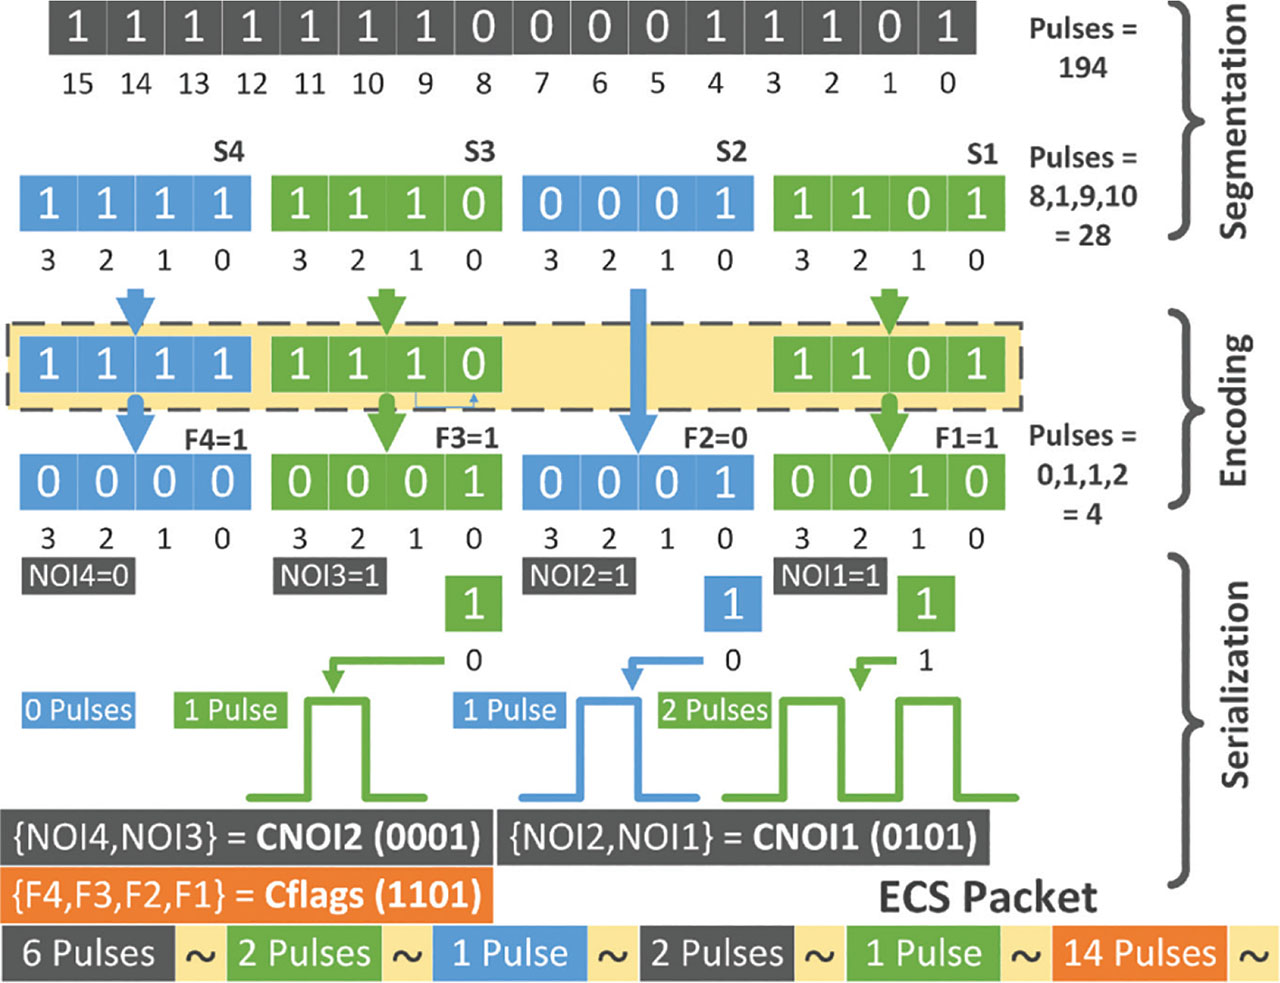
Figure 4:
Example: ECS packet formation. ECS, edge coded signaling.

Figure 5:
Standard ECS transmission (Data = 267). ECS, edge coded signaling.
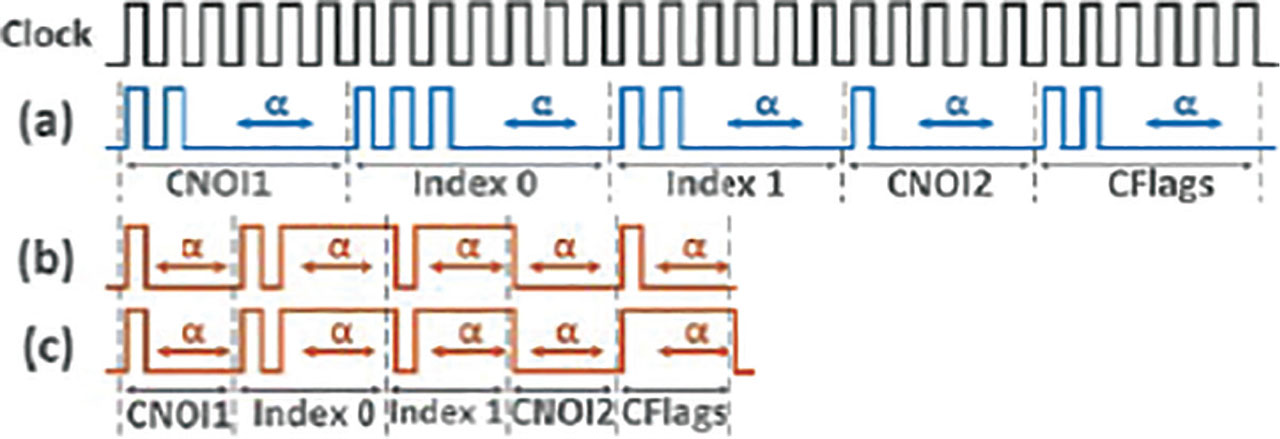
Figure 6:
(A) Standard ECS transmission (Data = 267) (B) DDR-ECS transmission = (Data = 267) (C) DDR-ECS transmission (Data = 132). DDR, double data rate; ECS, edge coded signaling.
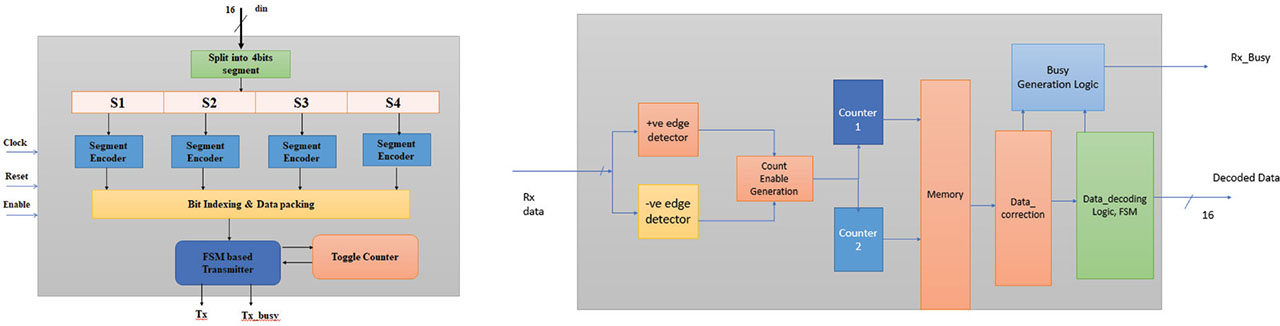
Figure 7:
Proposed DDR-ECS architecture. DDR, double data rate; ECS, edge coded signaling.
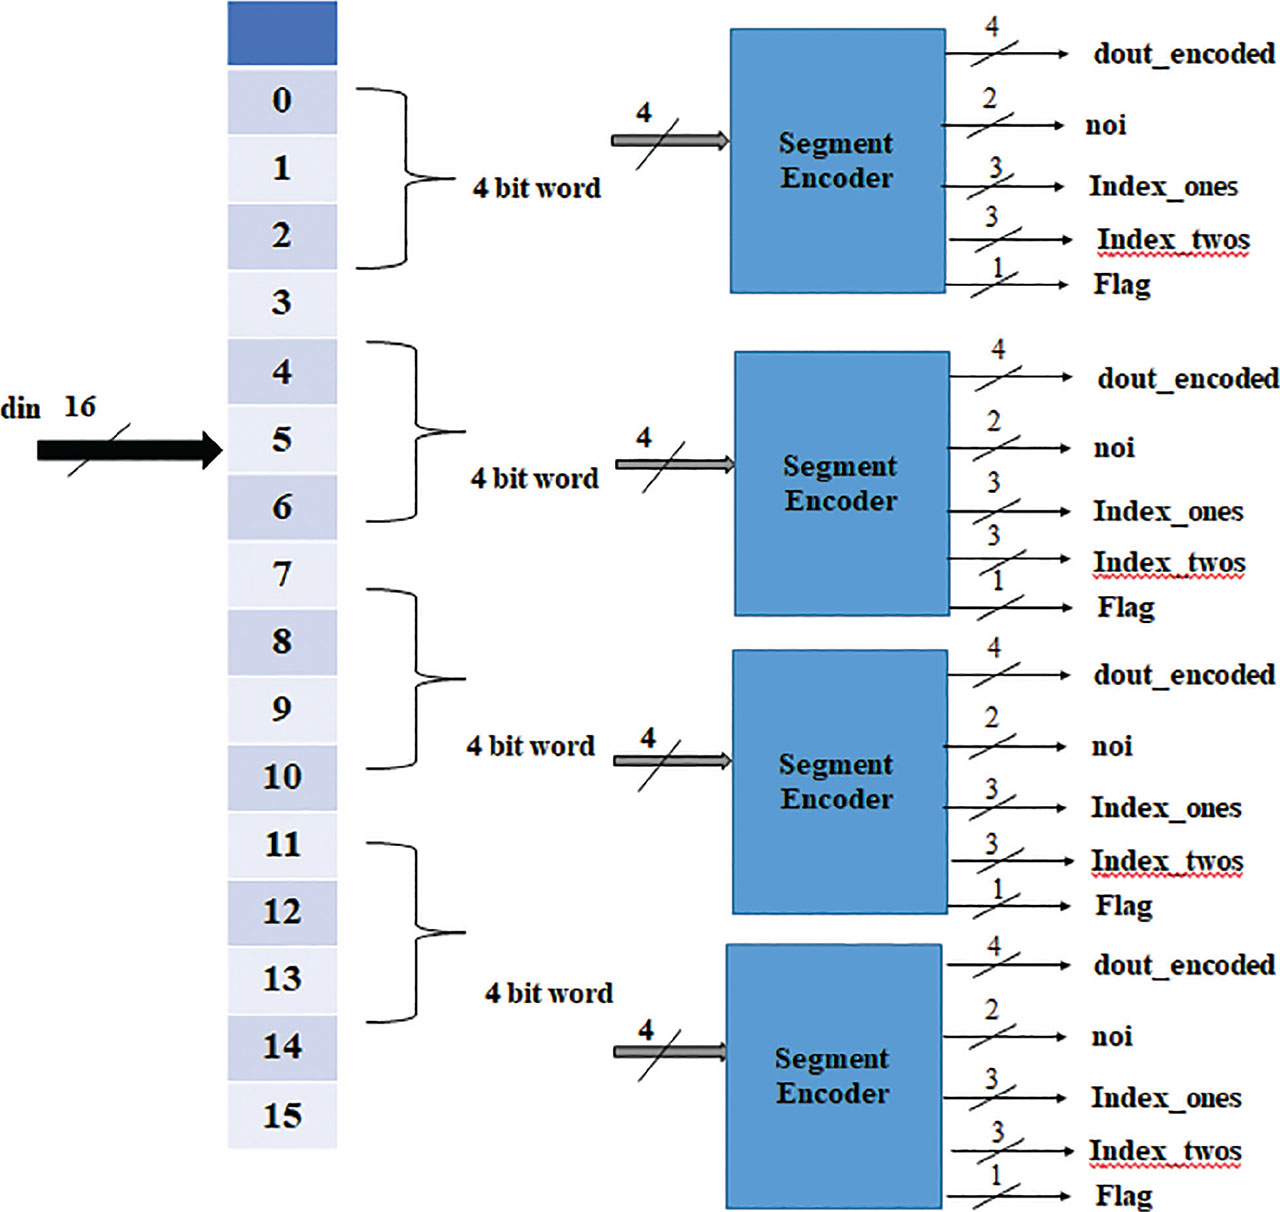
Figure 8:
Segmentation/bit splitter.

Figure 9:
Simulation result showing data segmentation for input 3EC8.
Table 2:
Encoded data and number of 1’s
| Regular data | Encoding/inversion | Number of 1’s | Flag |
|---|---|---|---|
| 0000 | 0000 | 0 | 0 |
| 0001 | 0001 | 1 | 0 |
| 0010 | 0010 | 1 | 0 |
| 0011 | 0011 | 2 | 0 |
| 0100 | 0100 | 1 | 0 |
| 0101 | 0101 | 2 | 0 |
| 0110 | 0110 | 2 | 0 |
| 0111 | 1000 | 1 | 1 |
| 1000 | 1000 | 1 | 0 |
| 1001 | 1001 | 2 | 0 |
| 1010 | 1010 | 2 | 0 |
| 1011 | 0100 | 1 | 1 |
| 1100 | 1100 | 2 | 0 |
| 1101 | 0010 | 1 | 1 |
| 1110 | 0001 | 1 | 1 |
| 1111 | 0000 | 0 | 1 |
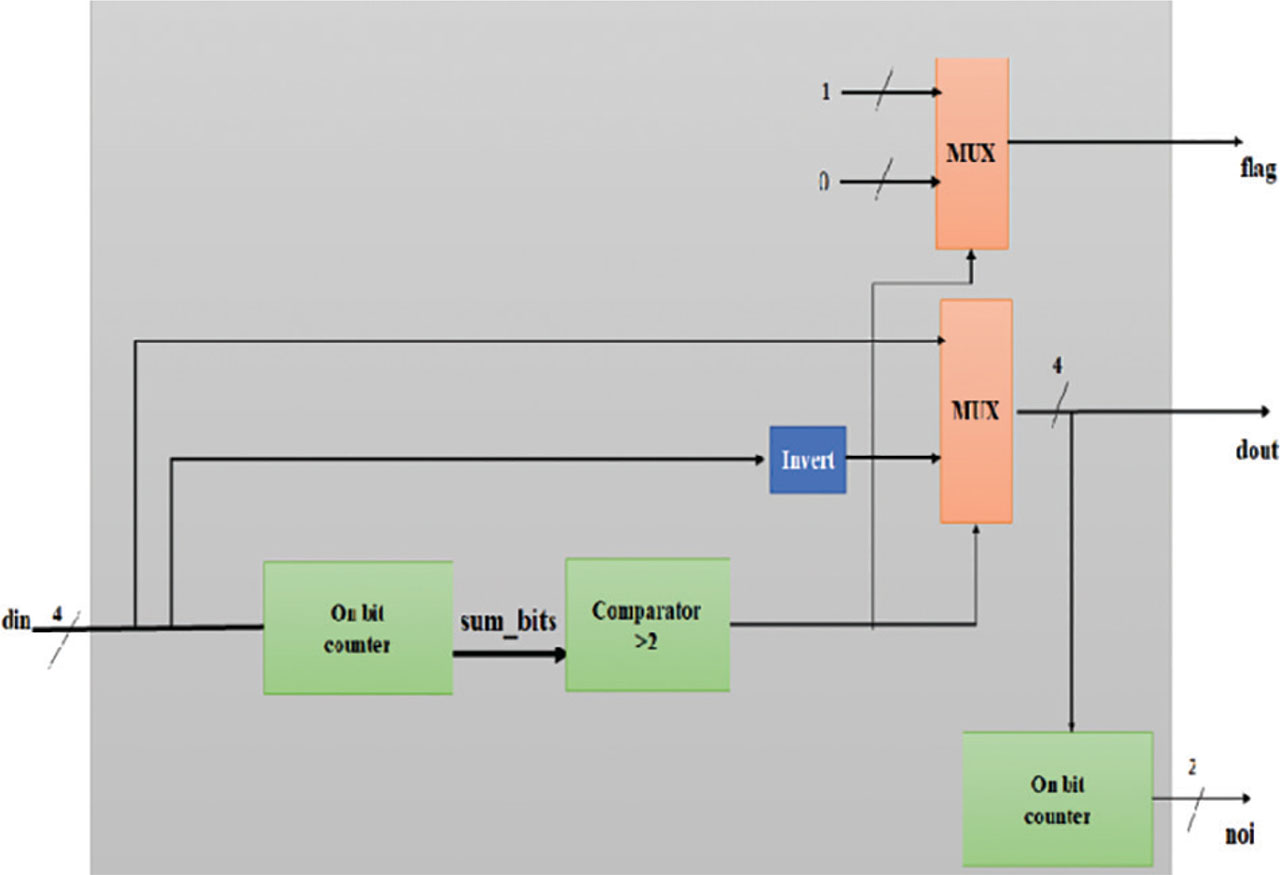
Figure 10:
Segment encoder.
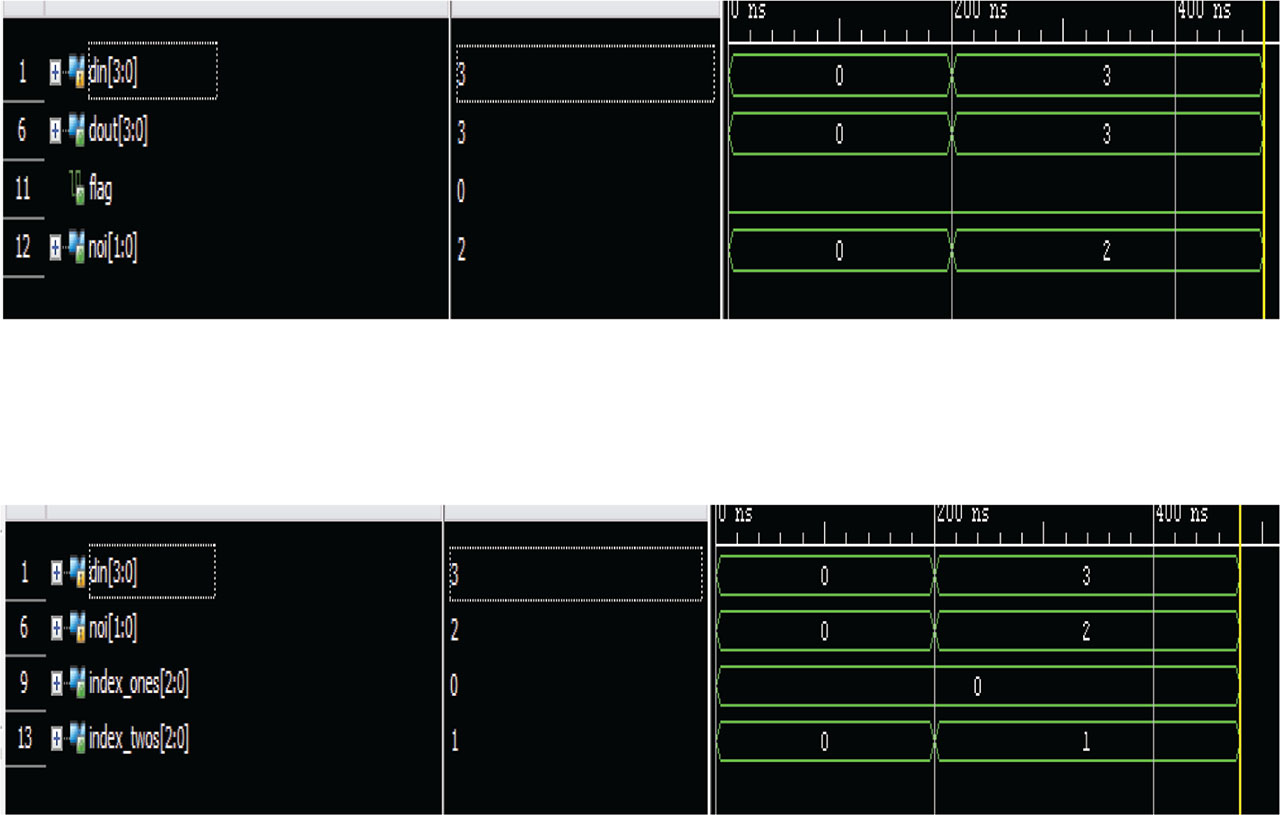
Figure 11:
Simulation results showing Index codes and NOIs.
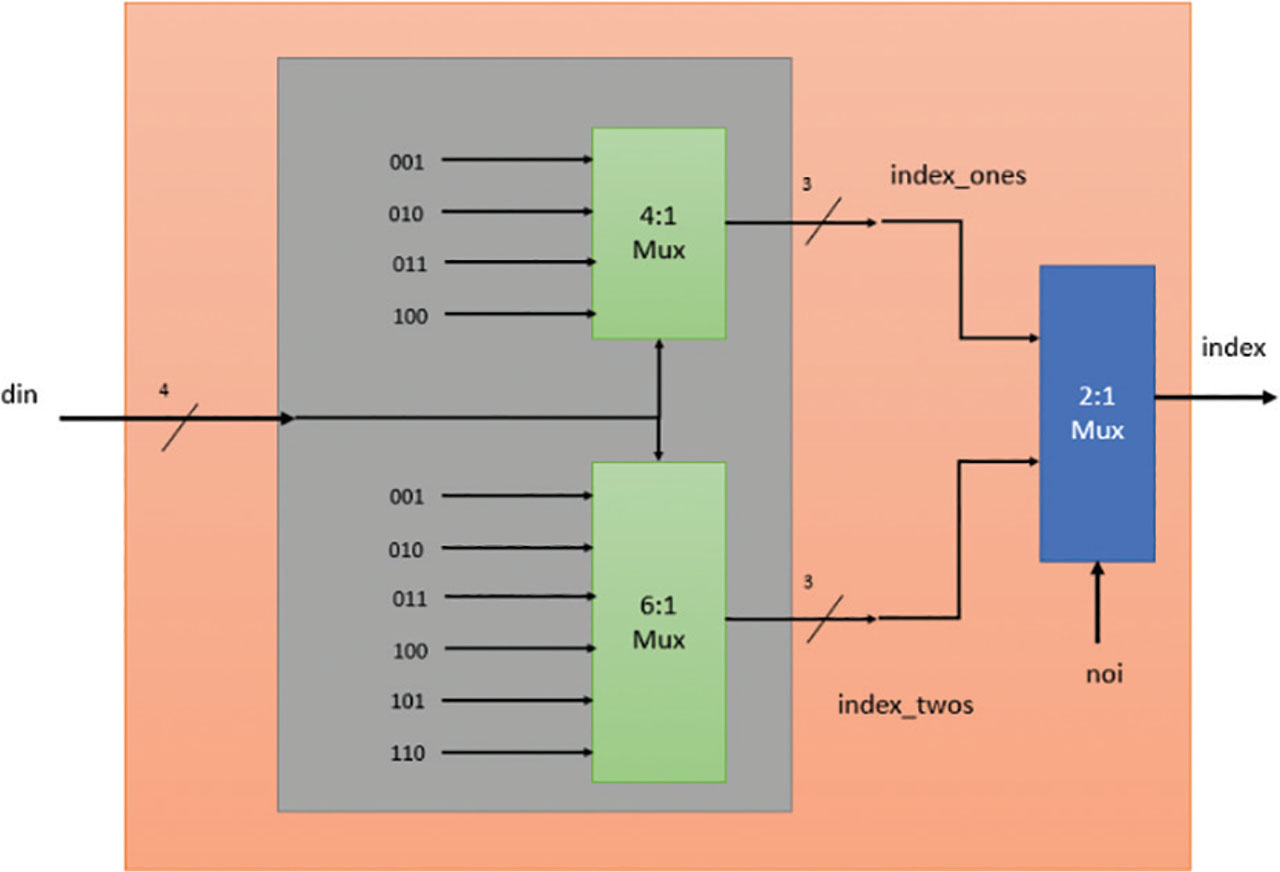
Figure 12:
Index code generation.

Figure 13:
Simulation result showing encoded data.
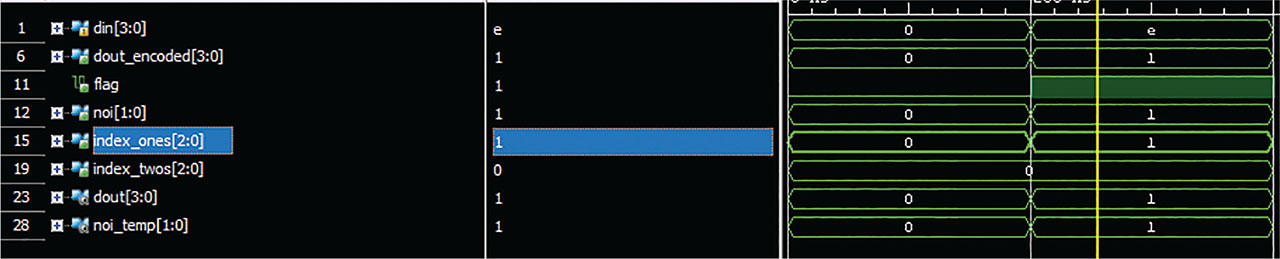
Figure 14:
Simulation result showing Index one output.

Figure 15:
Simulation result showing Index two output.
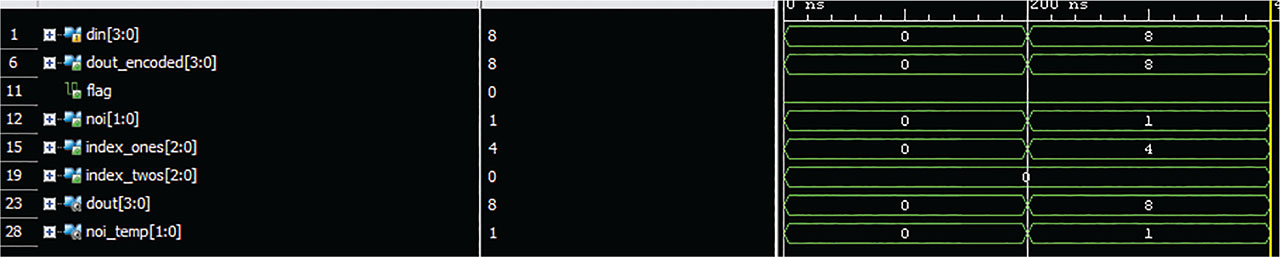
Figure 16:
Simulation result showing Flag bit.

Figure 17:
Proposed DDR-ECS packet. DDR, double data rate; ECS, edge coded signaling.
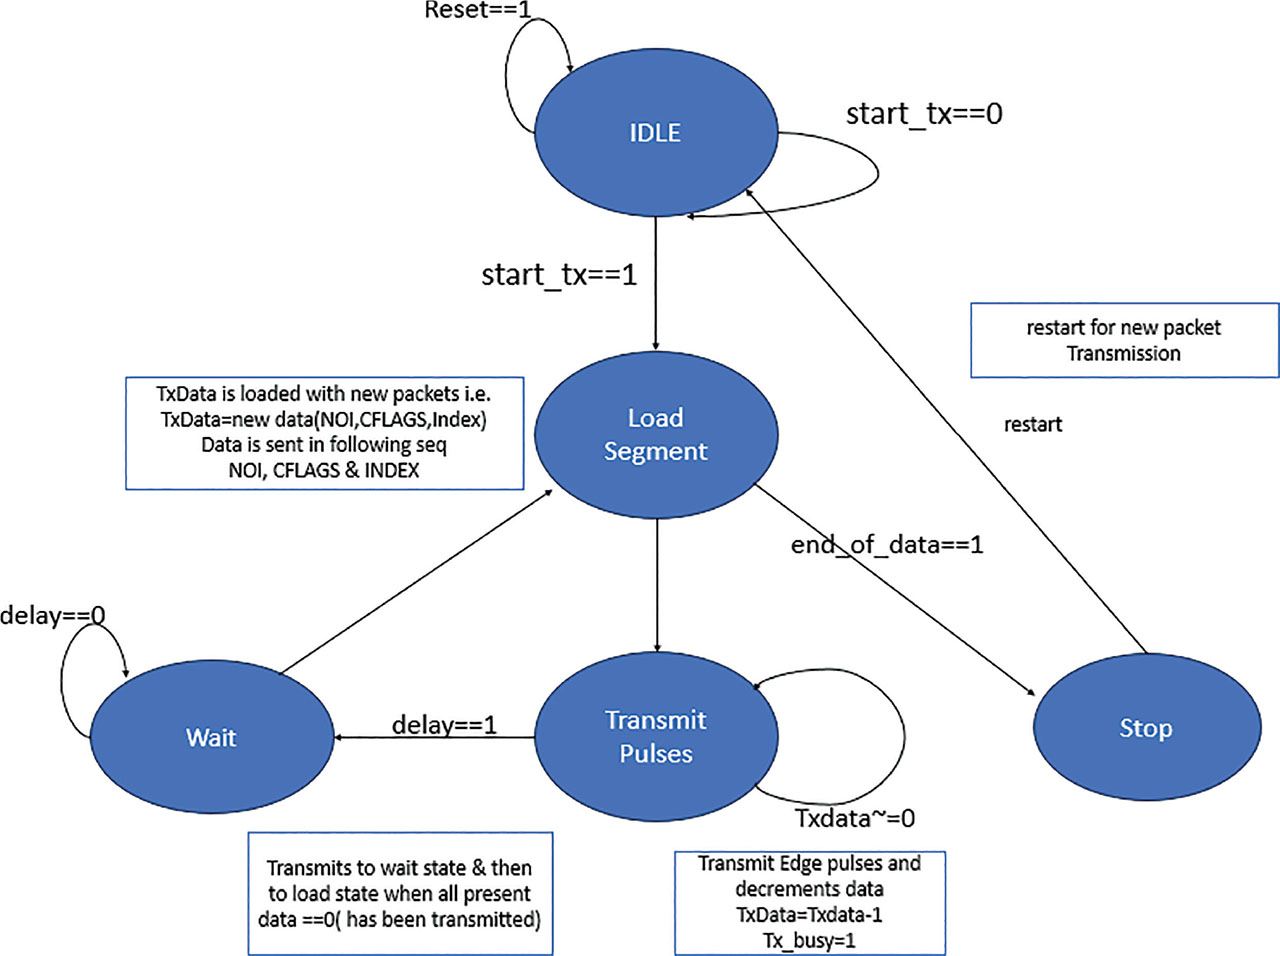
Figure 18:
FSM implementation of proposed DDR-ECS transmitter. DDR, double data rate; ECS, edge coded signaling.
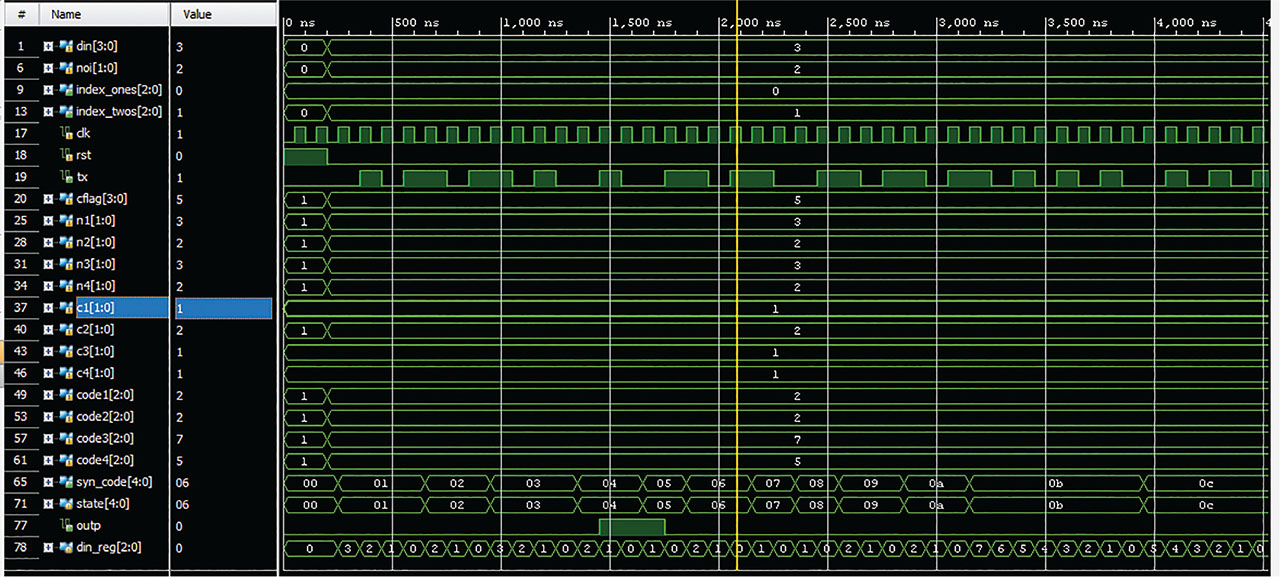
Figure 19:
Simulation result showing subsequent iterations.
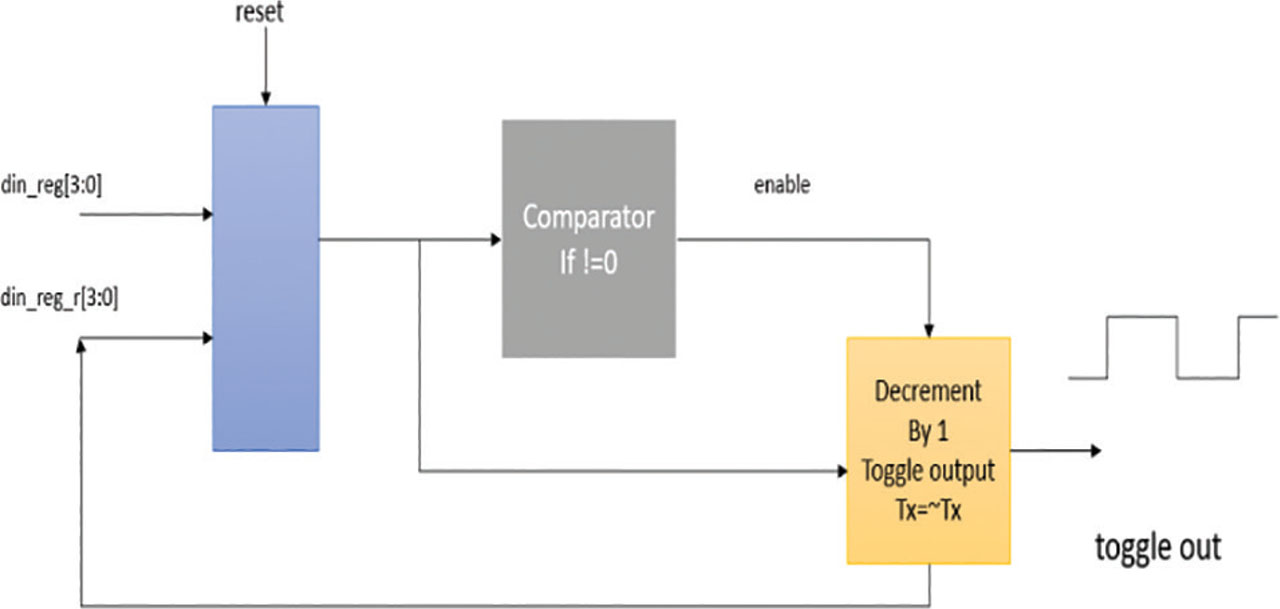
Figure 20:
Toggle counter.
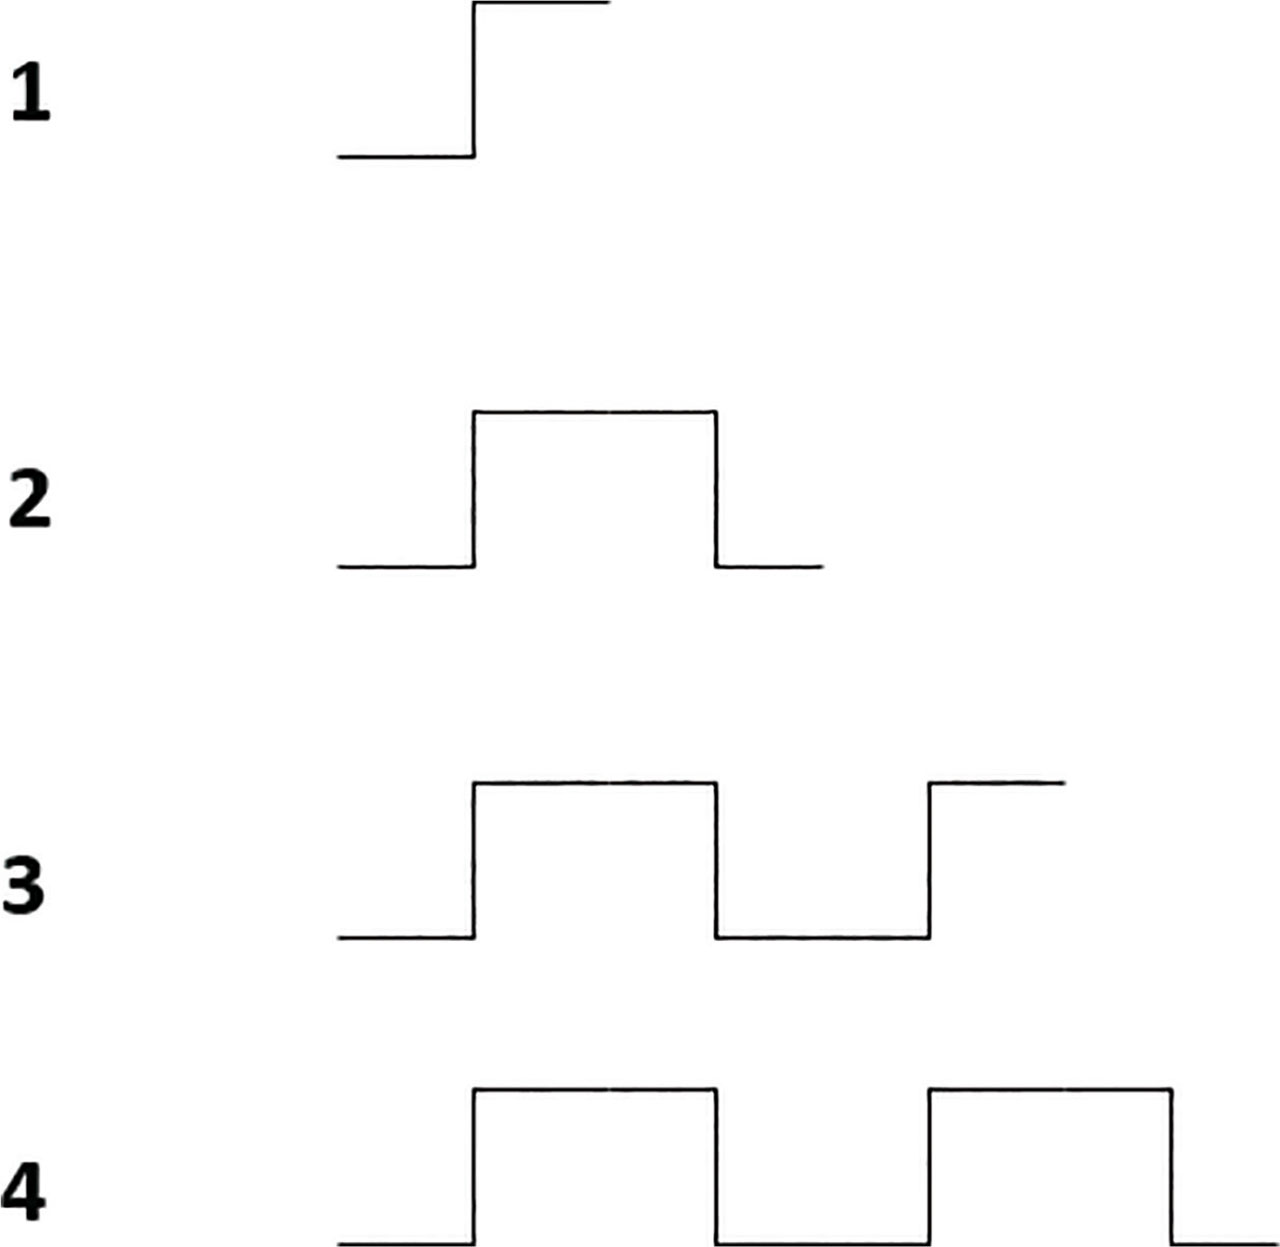
Figure 21:
Example of DDR-ECS pulse generation using toggle counter. DDR, double data rate; ECS, edge coded signaling.

Figure 22:
Simulation result showing generation of transmission pulse for the input 3EC8.
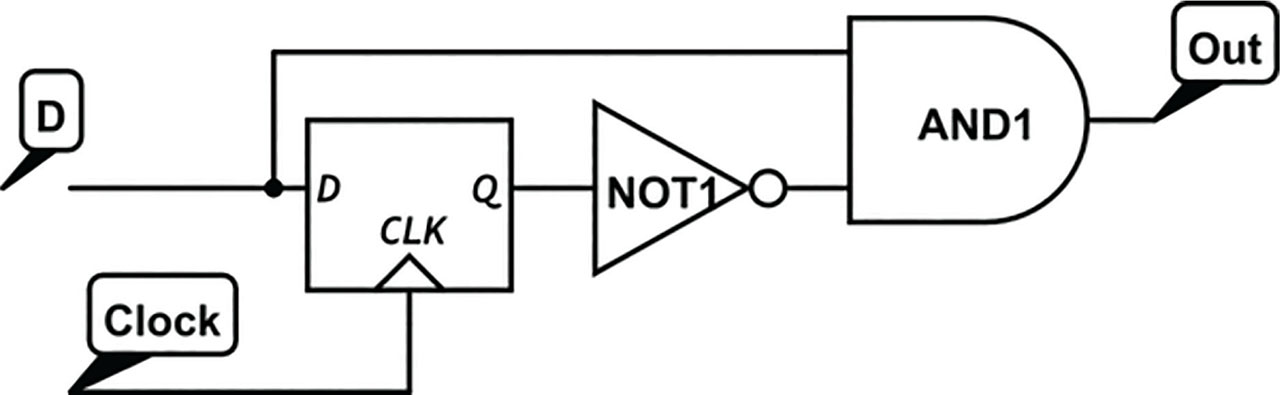
Figure 23:
Positive edge detector.

Figure 24:
Positive edge detection.
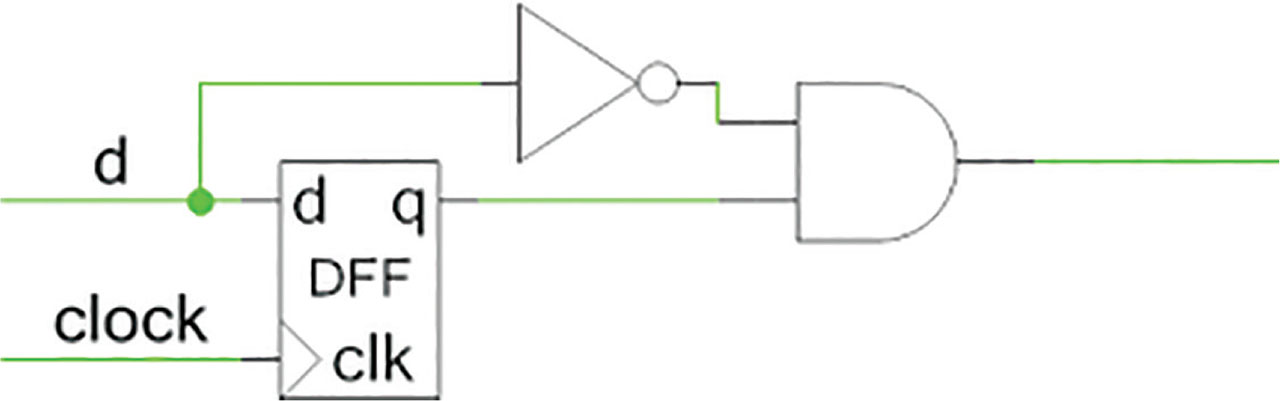
Figure 25:
Negative edge detector.

Figure 26:
Negative edge detection.

Figure 27:
Counter enable generation.
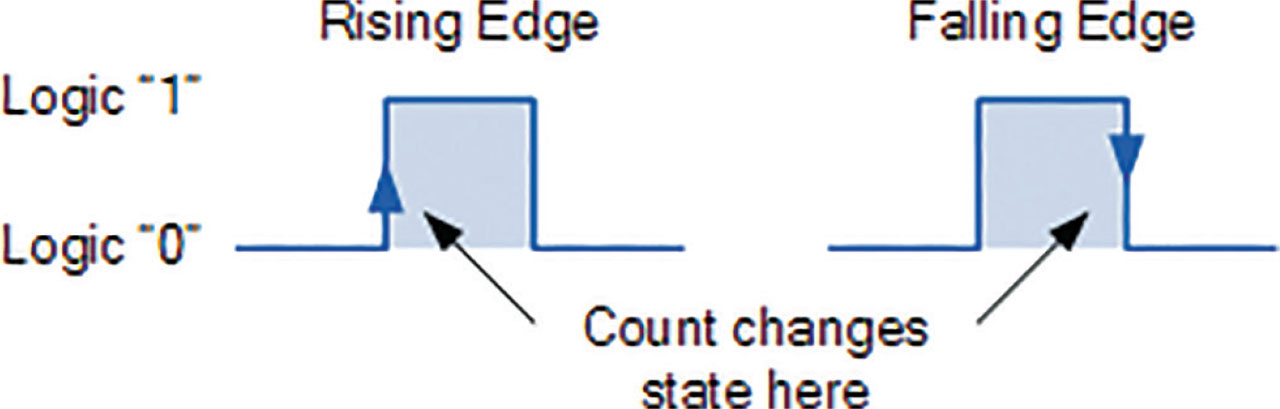
Figure 28:
Rising and falling edge of a pulse.

Figure 29:
Simulation result of counter 1.

Figure 30:
Simulation result of counter 2.
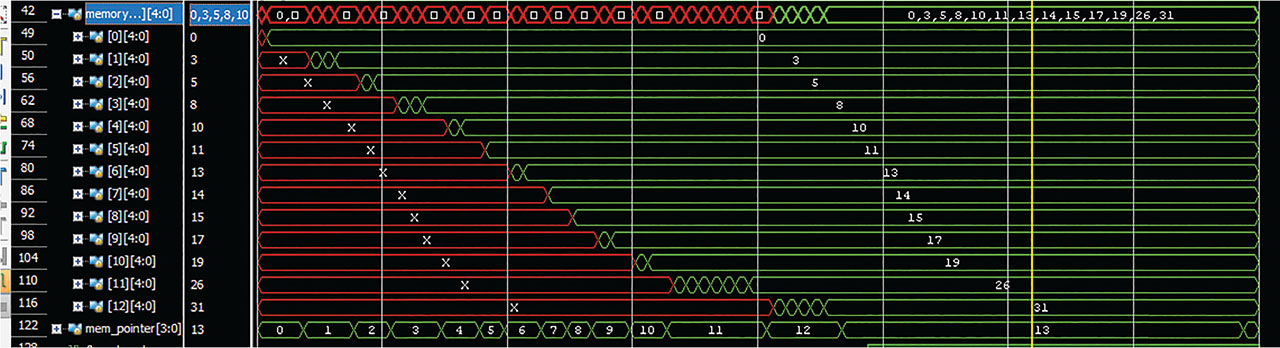
Figure 31:
Simulation result of memory unit.
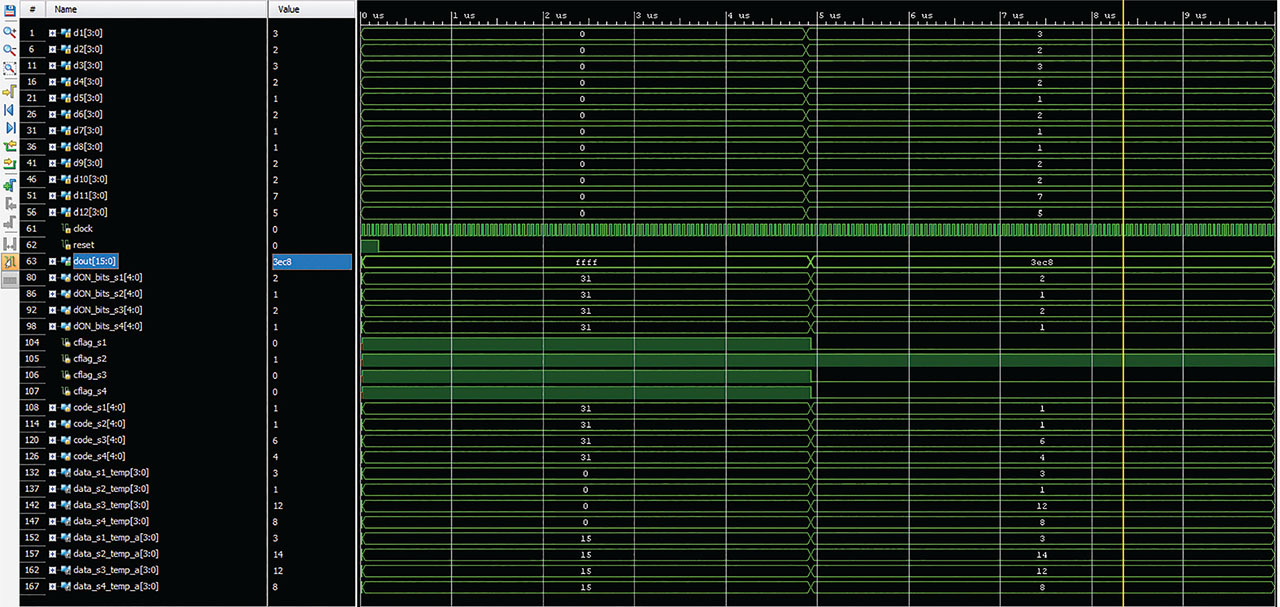
Figure 32:
Simulation result of data decoder.

Figure 33:
Simulation output of 16-bit DDR ECS transmitter module with data input 4539.Double data rate ECS.
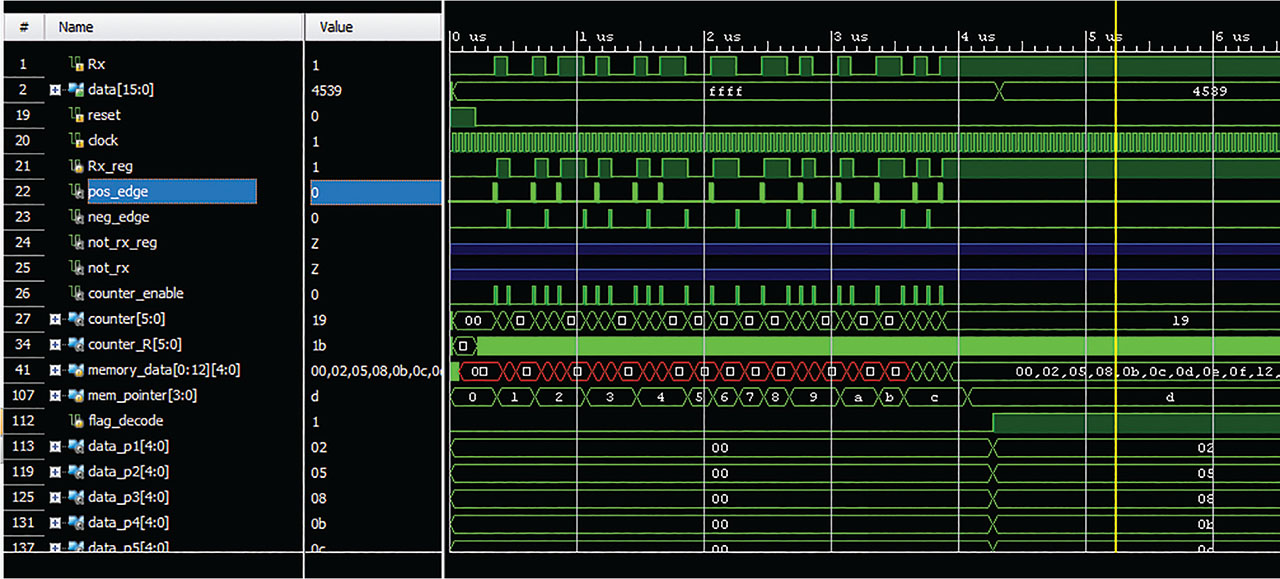
Figure 34:
Simulation output of 16-bit DDR ECS receiver module with data input 4539. Double data rate ECS.