
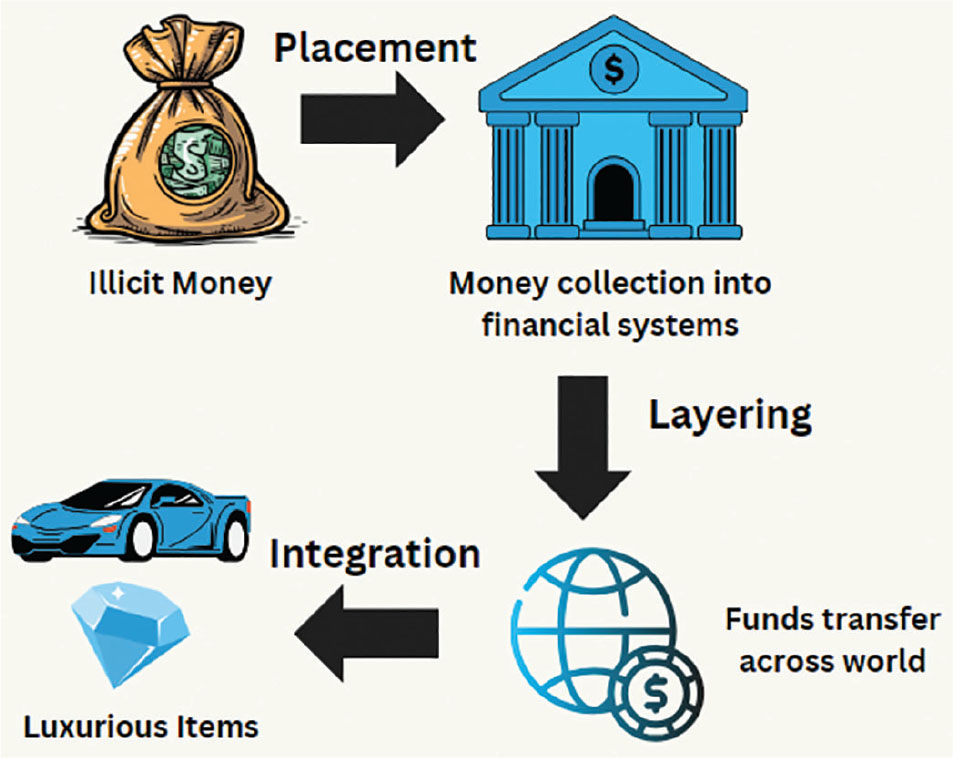
Figure 1:
Money laundering: a three-stage process.
Table 1:
The rising cost of AML shortcomings, urging stricter compliance across diverse sectors
| Company name/bank | Fine | Year | Reason for fine |
|---|---|---|---|
| Binance Holdings Ltd (US) | $4 billion | 2023 | Breaches of Bank Secrecy Act, failure to register as money transmitter, violations of the International Emergency Economic Powers Act |
| Crown Resorts Ltd (Australia) | $450 million | 2023 | Past infractions of Australian AML regulations at casinos |
| Deutsche Bank (Germany) | $186 million | 2023 | Insufficient efforts to remedy money-laundering control and other weaknesses |
| Bank of Queensland (Australia) | $50 million (potential) | 2023 | Breaches of prudential norms and AML regulations |
| William Hill & Mr Green (UK) | £19.2 million | 2023 | Violations of AML and social responsibility regulations |
| Guaranty Trust Bank UK Ltd | £7.6 million | 2023 | Serious flaws in AML procedures and controls |
| ADM Investor Services International Ltd (UK) | £6.47 million | 2023 | Inadequate AML procedures and controls |
| In Touch Games Ltd (UK) | £6.1 million | 2023 | Failing to adequately handle money-laundering and social responsibility issues |
| HSBC (Mexico and Colombia) | $1.9 billion (£1.2 billion) | 2023 | Inadequate controls against money laundering |
| Credit Suisse Group (US) | $536 million | 2009 | Money-laundering allegations |
| Lloyds Banking Group PLC (UK) | $350 million | 2009 | Money-laundering allegations |
| ING Bank Group (the Netherlands) | $619 million | 2012 | Facilitating illegal movement of billions through the US banking system |
| Standard Bank PLC (UK) | $7.6 million | 2014 | Shortcomings in AML controls |
Table 2:
Traditional AML methods struggle with dynamic schemes, outdated data, and manual burden
| Traditional methods | Challenges |
|---|---|
| Watchlists and blacklists [15] | Limited effectiveness in identifying novel or evolving money-laundering schemes, reliance on static lists |
| Transaction monitoring [15] | Overreliance on historical data, potential to miss emerging patterns, and high manual review workload |
| CDD [16] | Difficulty in maintaining up-to-date customer profiles, potential for false negatives in risk assessments |
| Manual investigations [16] | Are labor-intensive, prone to human error, and may result in delays in identifying suspicious activities |
Table 3:
Advanced techniques for AML: challenges in data labeling, interpretability, and evolving threats
| ML algorithms/techniques | Challenges |
|---|---|
| ML algorithms [18] | Need for substantial labeled data, interpretability concerns, and potential biases in training data |
| Predictive analytics [19] | Dependence on accurate historical data, challenges in predicting novel or emerging techniques |
| NLP [20] | Handling diverse language nuances, extracting meaningful insights from vast textual data |
| Anomaly detection [21] | Balancing sensitivity and specificity, adapting to evolving tactics of sophisticated criminals |
| Big data analytics [22] | Ensuring scalability, data quality, and the need for robust infrastructure |
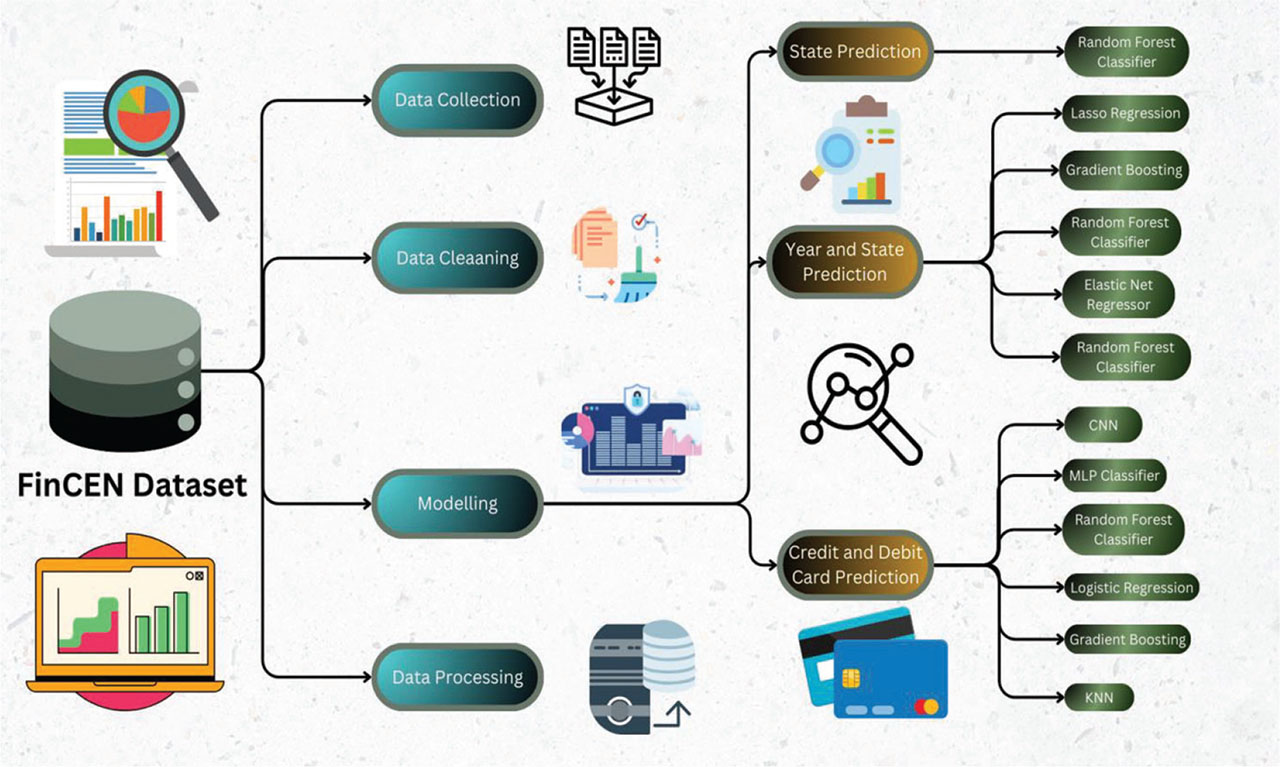
Figure 2:
System flow architecture in AML modeling. AML, anti–money laundering; CNN, convolutional neural network; FinCEN, Financial Crimes Enforcement Network; KNN, K-nearest neighbor; MLP, multilayer perceptron.
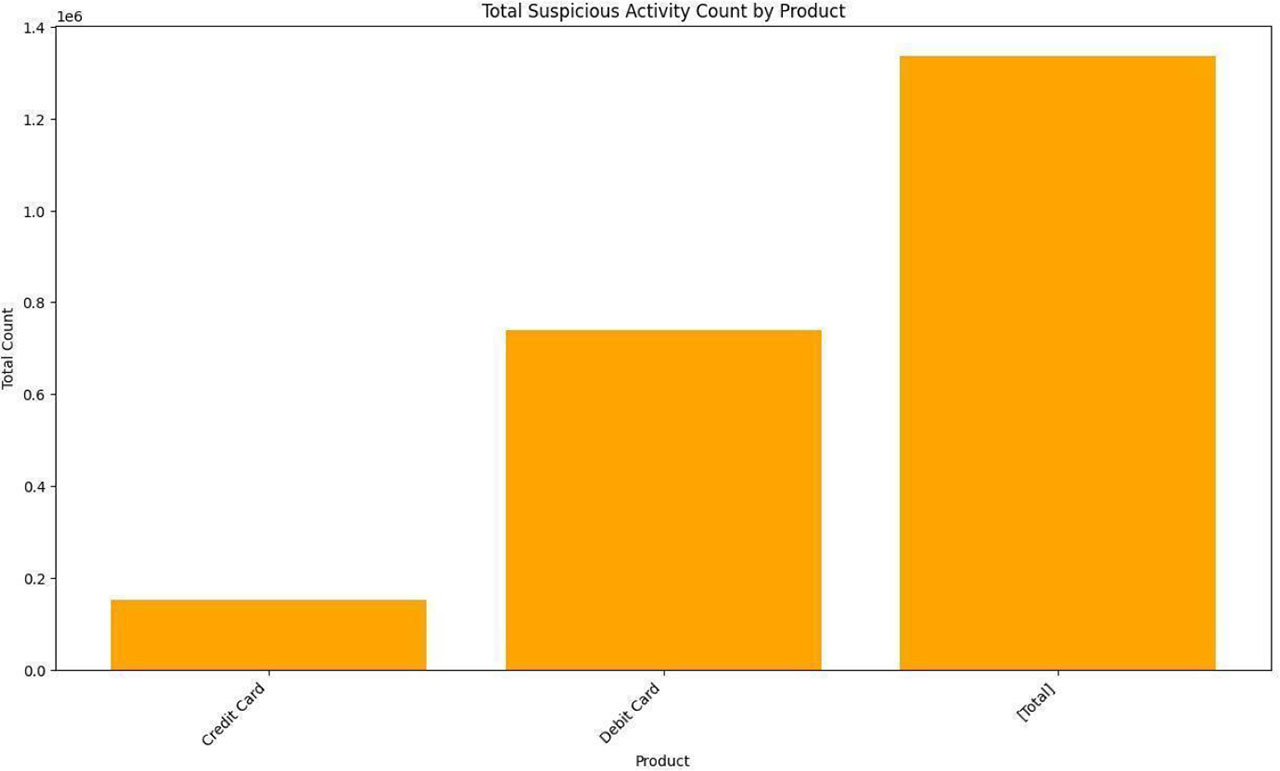
Figure 3:
Illustration of the “differentiating suspicious activity counts,” showcasing varying totals of suspicious activities across “Credit Card, Debit Card, and Total” categories. This variation suggests differing risk levels and potential financial irregularities associated with each category.
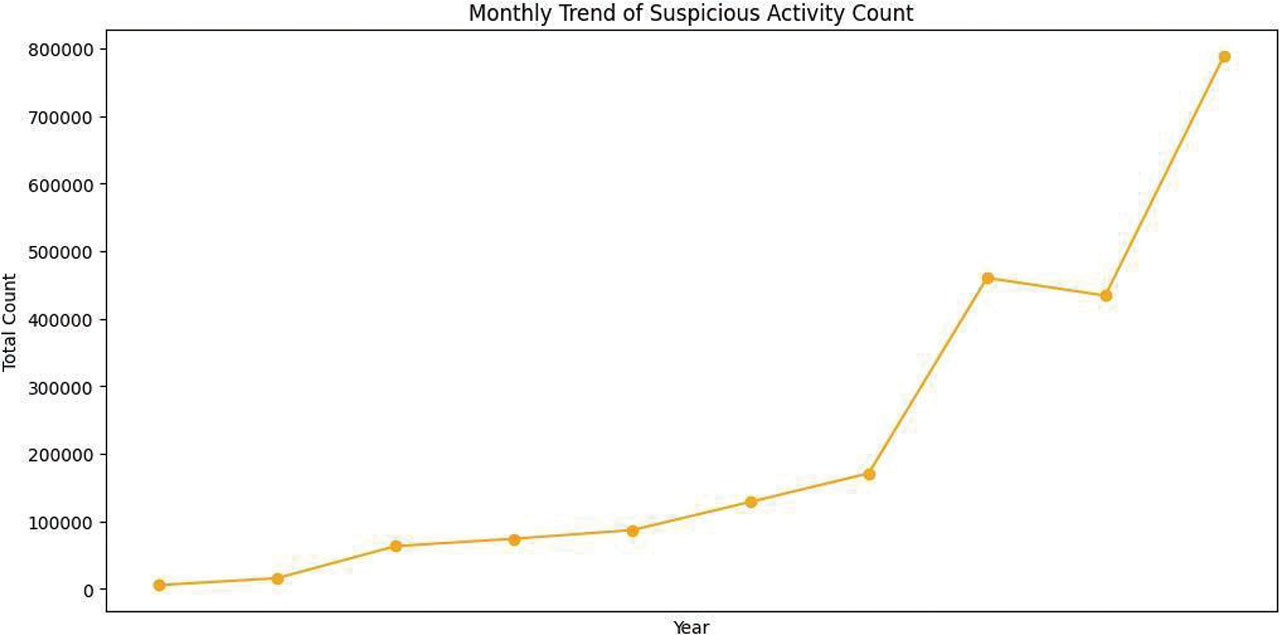
Figure 4:
Tracking suspicious activity trends: figure shows a gradual rise, followed by a sharp increase in monthly suspicious activity counts over the years.
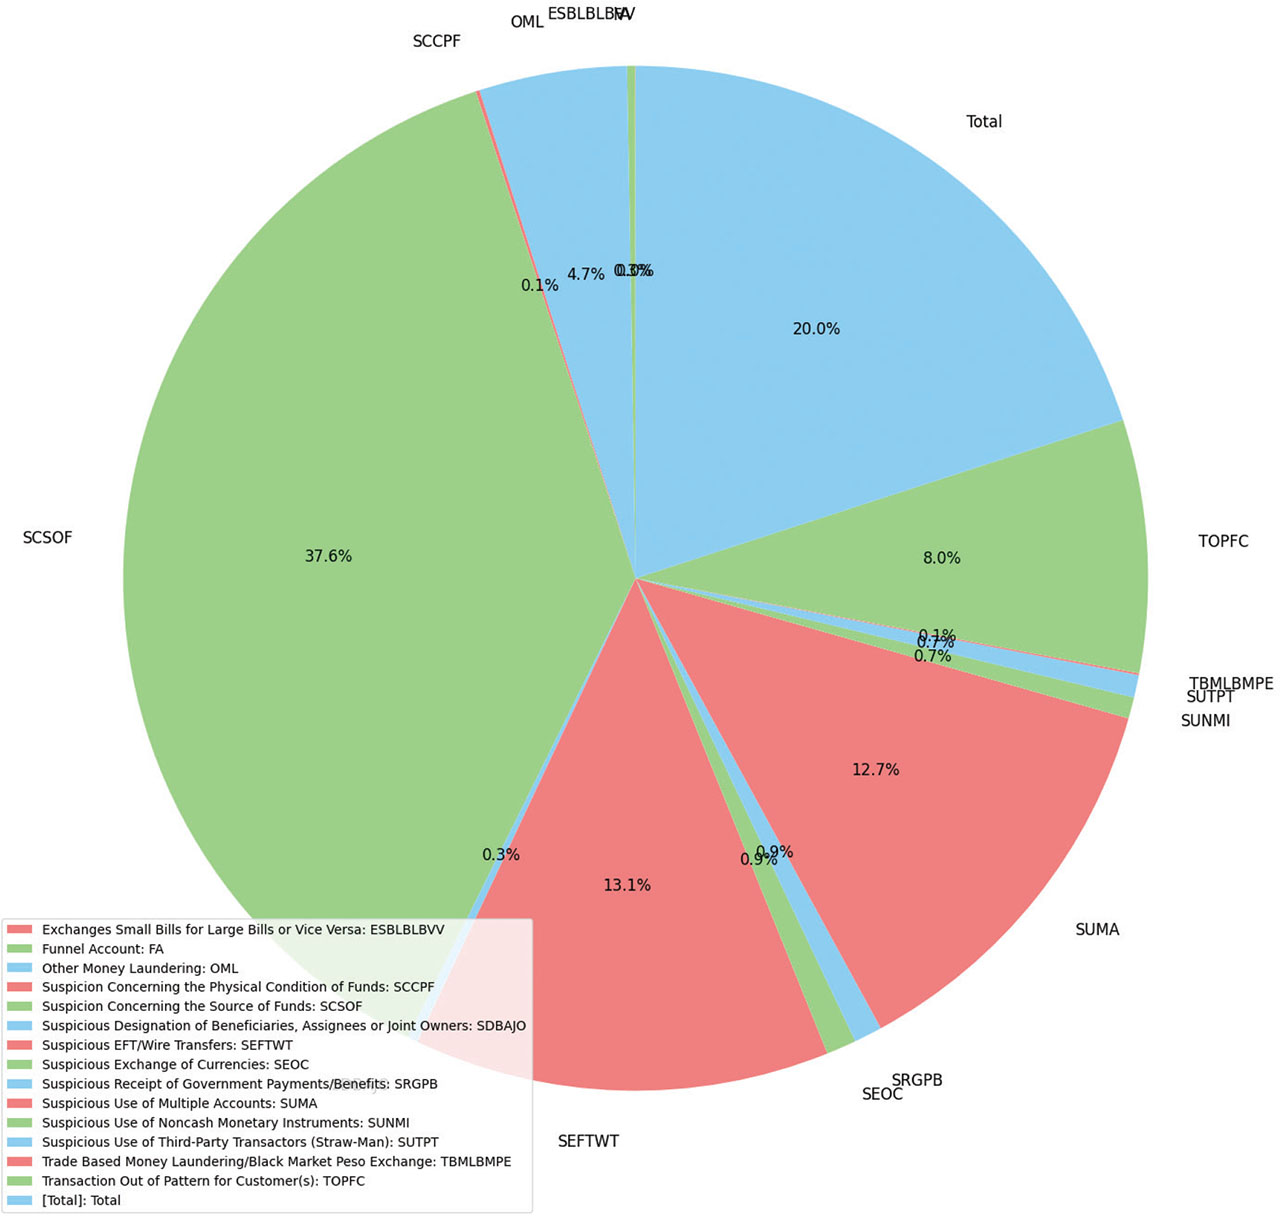
Figure 5:
The “spectrum of suspicious activities,” showing—in a pie chart format—a breakdown that highlights prevalent concerns in financial transactions, including “Source of funds” and “Exchanges/transfers,” among others.
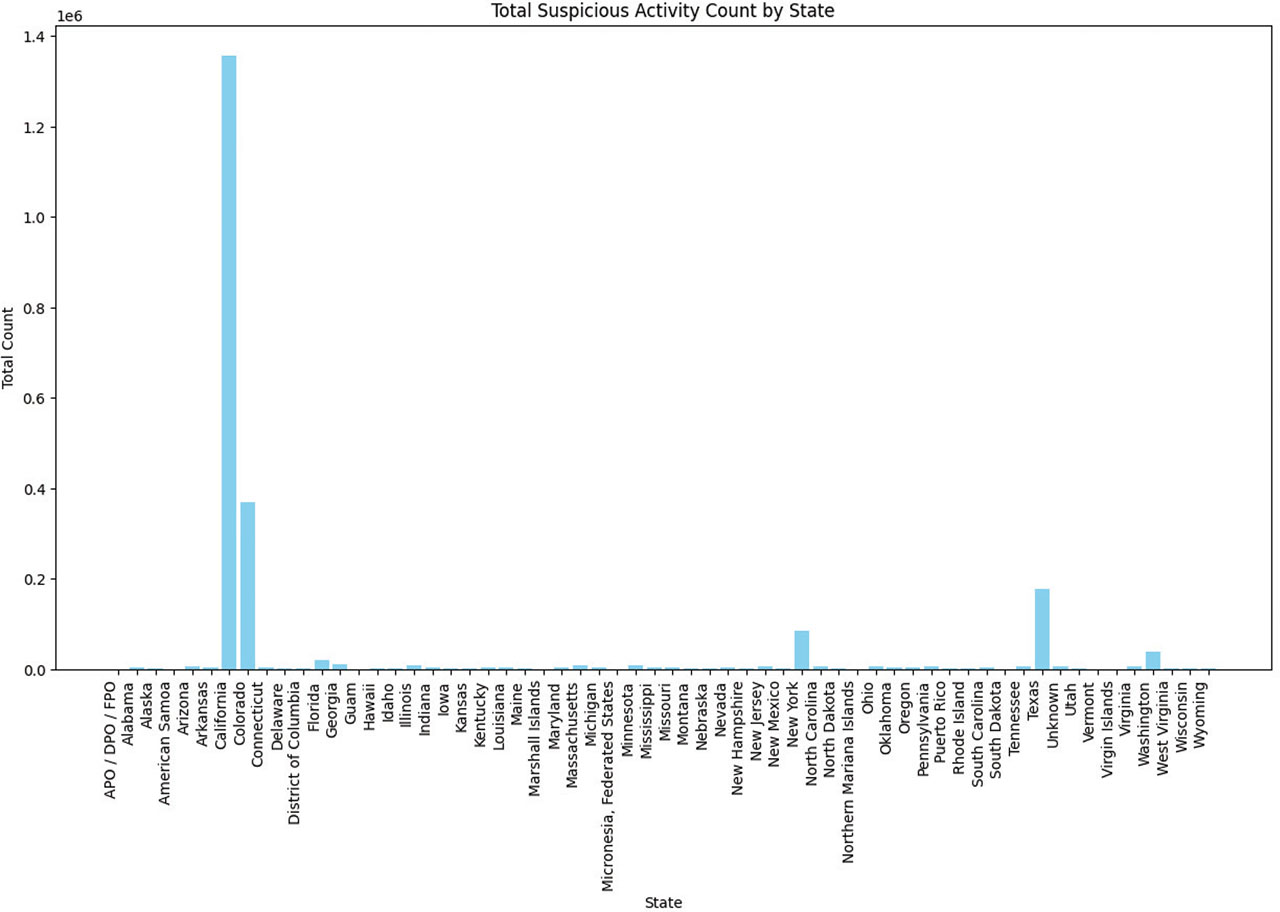
Figure 6:
Regional disparities in SAR filings are shown, depicting high activity in populous coastal states versus lower reports in rural areas, signaling potential money-laundering vulnerabilities. SAR, suspicious activity report.
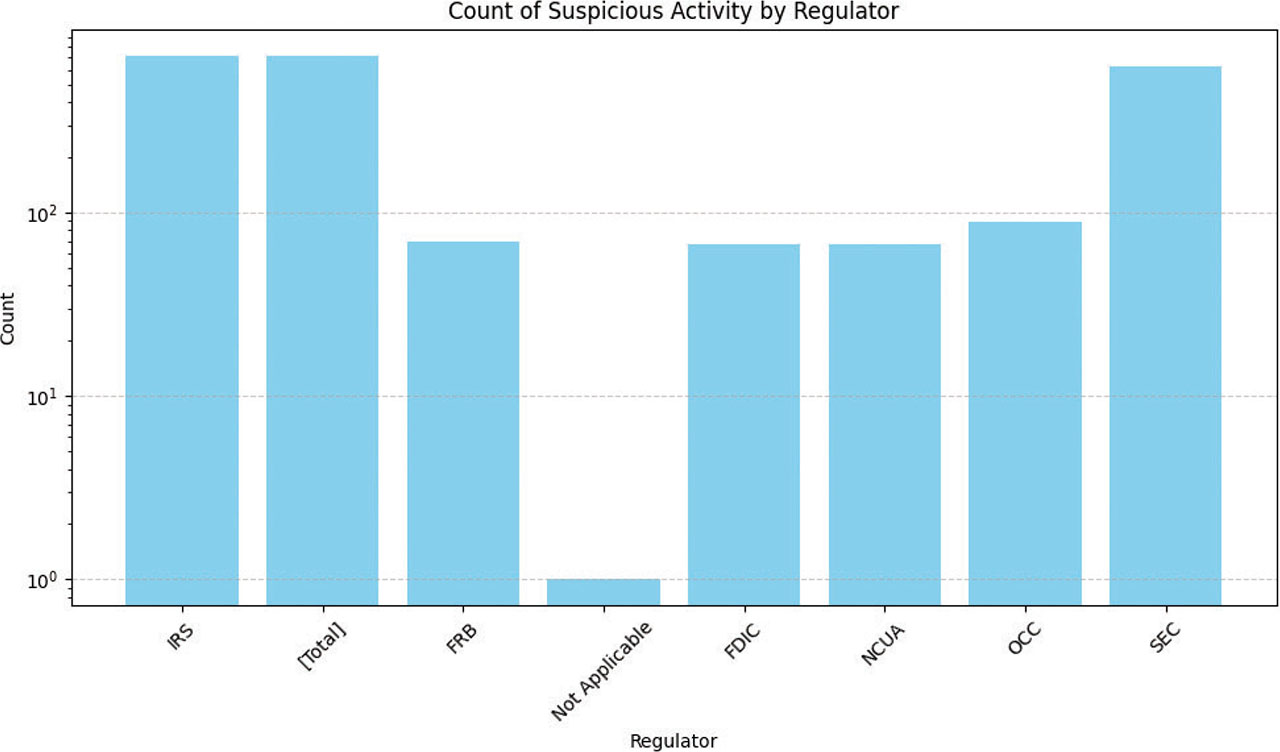
Figure 7:
IRS leads in SAR Filings: figure reveals IRS as the primary recipient of SARs, reflecting its extensive oversight in financial transactions. FDIC, Federal Deposit Insurance Corporation; FRB, Federal Reserve Board; IRS, Internal Revenue Service; NCUA, National Credit Union Administration; OCC, Office of the Comptroller of the Currency; SARs, suspicious activity reports; SEC, Securities and Exchange Commission.
Table 4:
Confusion matrix illustrating the predicted versus actual classifications of financial transactions
| Predicted nonfraud | Predicted fraud | |
|---|---|---|
| Actual nonfraud | 3,689 | 62 |
| Actual fraud | 62 | 123 |
Table 5:
Performance metrics of different models for year and state
| Algorithms | MSE | R2 | MAE |
|---|---|---|---|
| Elastic net regressor | 3.25 | 0.10 | 1.085 |
| LASSO regression | 3.28 | 0.10 | 0.840 |
| Random forest | 2.50 | 0.60 | 0.800 |
| Gradient boosting regressor | 2.90 | 0.24 | 1.010 |
| Linear regression | 3.20 | 0.50 | 1.060 |
Table 6:
Performance metrics of different models for credit card classification
| Model | Accuracy | Precision | Recall | F1 score | ROC_AUC score |
|---|---|---|---|---|---|
| MLP (DL) | 0.75 | 0.31 | 0.06 | 0.10 | 0.51 |
| CNN (DL) | 0.76 | 0.55 | 0.03 | 0.05 | 0.51 |
| Random forest classifier | 0.77 | 0.56 | 0.07 | 0.13 | 0.53 |
| Logistic regression | 0.77 | 0.51 | 0.13 | 0.21 | 0.55 |
| Gradient boosting | 0.77 | 0.55 | 0.20 | 0.29 | 0.57 |
| KNN | 0.75 | 0.44 | 0.24 | 0.31 | 0.57 |
Table 7:
Performance metrics of different models for debit card classification
| Model | Accuracy | Precision | Recall | F1 score | ROC_AUC score |
|---|---|---|---|---|---|
| MLP (DL) | 0.65 | 0.55 | 0.42 | 0.48 | 0.60 |
| CNN (DL) | 0.68 | 0.60 | 0.54 | 0.57 | 0.65 |
| Random forest classifier | 0.69 | 0.63 | 0.50 | 0.55 | 0.68 |
| Logistic regression | 0.68 | 0.59 | 0.56 | 0.58 | 0.66 |
| Gradient boosting | 0.70 | 0.68 | 0.42 | 0.52 | 0.65 |
| KNN | 0.61 | 0.50 | 0.50 | 0.51 | 0.60 |