
Table 1:
PurpleAir sensor data, Primary and Secondary data sets of Channels A and B, gray cells represent the selected parameters of the study (PurpleAir, 2022)
| CHANNEL A | CHANNEL B | |
|---|---|---|
| Field 1 | PM1.0 (CF = 1) μg/m3 | PM1.0 (CF = 1) μg/m3 |
| Field 2 | PM2.5 (CF = 1) μg/m3 | PM2.5 (CF = 1) μg/m3 |
| Field 3 | PM10.0 (CF = 1) μg/m3 | PM10.0 (CF = 1) μg/m3 |
| Field 4 | Uptime (min) | Free HEAP memory |
| Field 5 | RSSI (WiFi signal strength) | ADC0 (analog input) voltage |
| Field 6 | Temperature (F) | FIRMWARE 2.5 and up: atmospheric pressure |
| Field 7 | Humidity (%) | FIRMWARE 4.10 and up: Bosch BSEC IAQ when BME680 gas sensor is present |
| Field 8 | PM2.5 (CF = ATM) μg/m3 | PM2.5 (CF = ATM) μg/m3 |
| SECONDARY | ||
| Field 1 | 0.3 μm particles/dL | 0.3 μm particles/dL |
| Field 2 | 0.5 μm particles/dL | 0.5 μm particles/dL |
| Field 3 | 1.0 μm particles/dL | 1.0 μm particles/dL |
| Field 4 | 2.5 μm particles/dL | 2.5 μm particles/dL |
| Field 5 | 5.0 μm particles/dL | 5.0 μm particles/dL |
| Field 6 | 10.0 μm particles/dL | 10.0 μm particles/dL |
| Field 7 | PM1.0 (CF = ATM) μg/m3 | PM1.0 (CF = ATM) μg/m3 |
| Field 8 | PM10 (CF = ATM) μg/m3 | PM10 (CF = ATM) μg/m3 |
[i] BSEC, Bosch Sensortec Environmental Cluster; IAQ, Indoor Air Quality; PM, particulate matter; RSSI, Received Signal Strength Indicator.
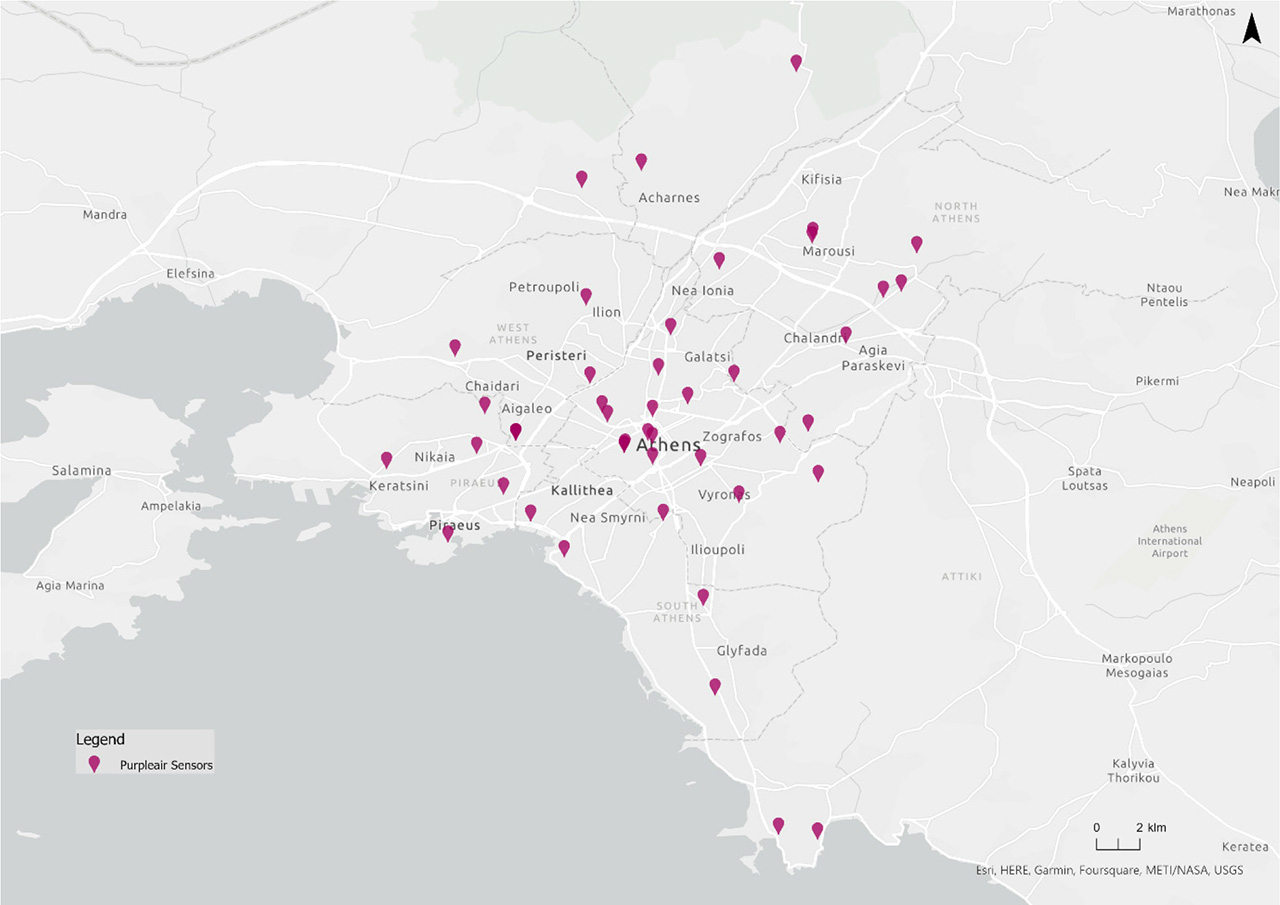
Figure 1:
Map of the PurpleAir network of sensors in Athens Greece.
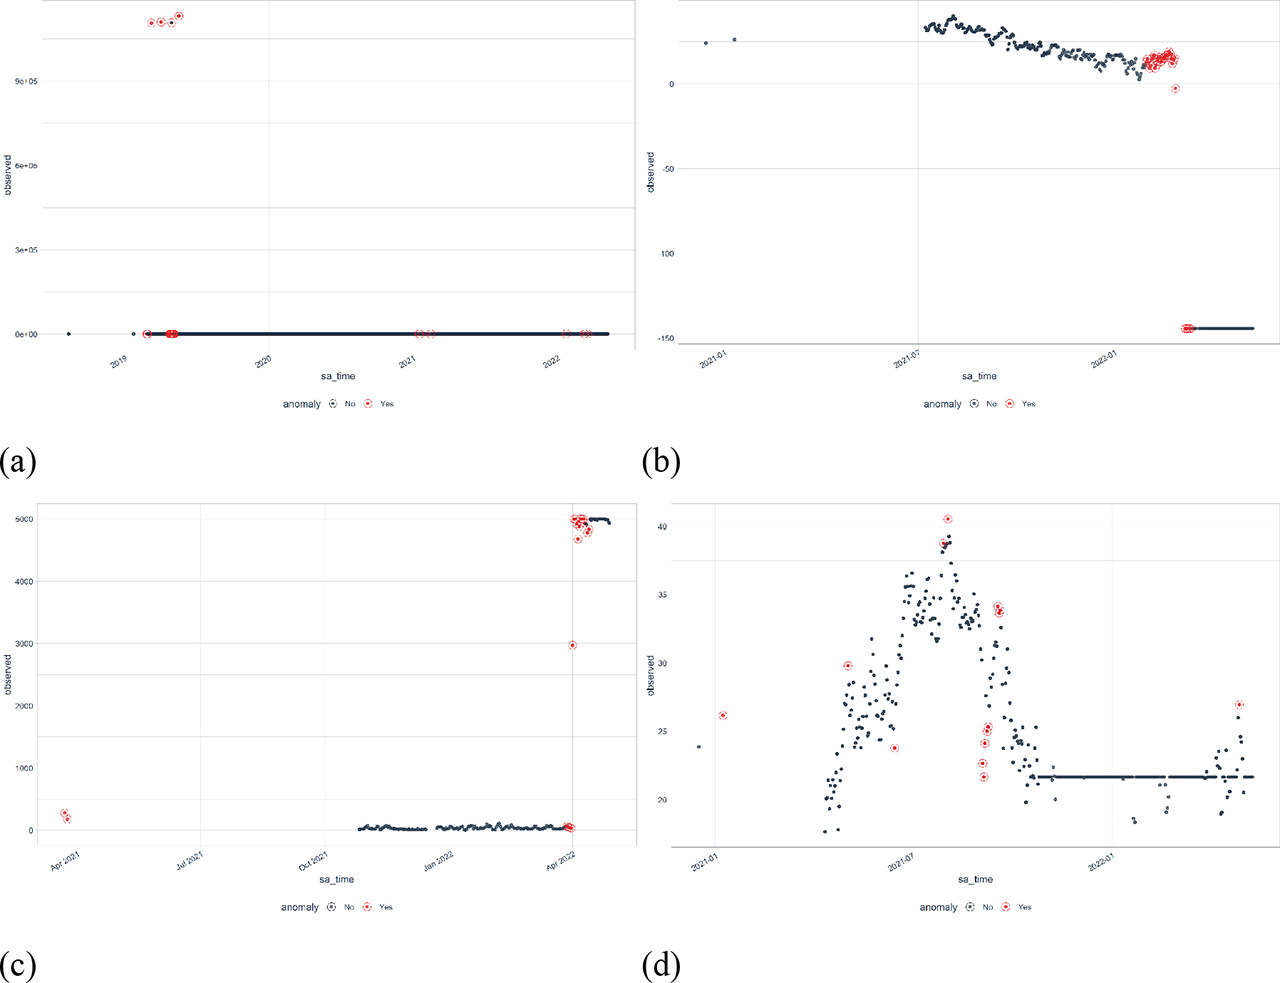
Figure 2:
Outliers by IQR method on daily data with (a) extreme high-temperature values on sensor, (b) continuous malfunction of temperature sensor, (c) continuous malfunction of PM10.00μm/m3 on sensor, (d) continuous malfunction of temperature sensor. IQR, interquartile range; PM, particulate matter.
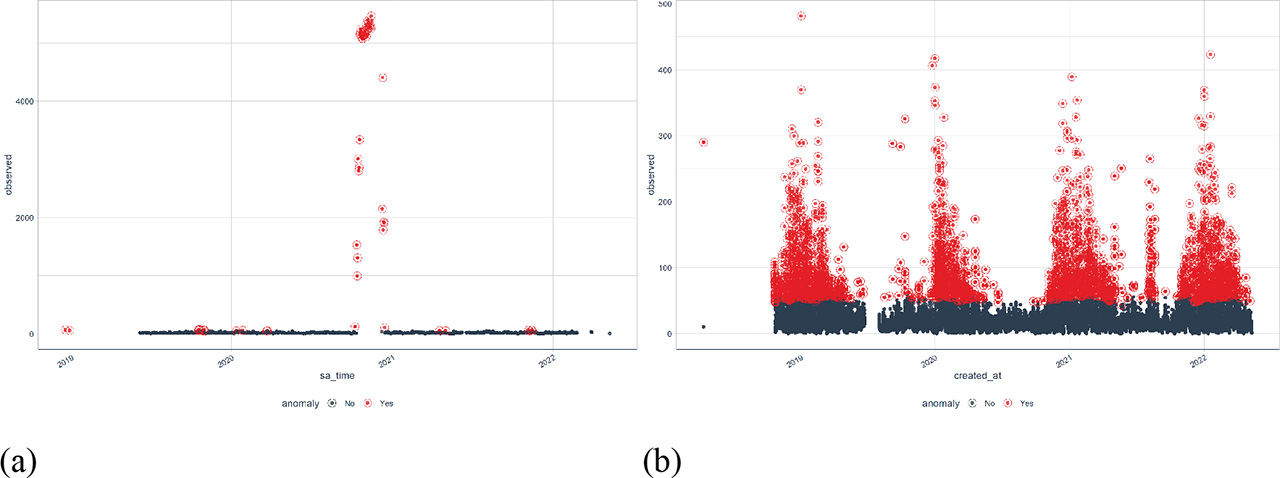
Figure 3:
(a) Daily PM 10.0μm/m3 outliers by IQR method with extremely high values due to sensor malfunction, (b) Hourly PM 10.0μm/m3 outliers with GESD method. GESD, generalized extreme studentized deviate; IQR, interquartile range; PM, particulate matter.
Table 2:
Outliers of IQR and GESD methods on daily data for temperature (°C), humidity (%), and PM (1.0 μm/m3, 2.5 μm/m3, 10.0 μm/m3) before and after filter application
| Observations (n) | IQR outliers (n) | GESD outliers (n) | Outlier observations in both methods (n) | IQR outliers/observations (%) | GESD outliers/observations (%) | Both methods/observations (%) | |
|---|---|---|---|---|---|---|---|
| Temperature (°C) | 45,740 | 1,094 | 1,932 | 1,034 | 2.4 | 4.2 | 2.3 |
| Humidity (%) | 45,740 | 260 | 556 | 260 | 0.6 | 1.2 | 0.6 |
| PM1.0 μm/m3 cf_1 | 46,305 | 1,655 | 2,745 | 1,655 | 3.6 | 5.9 | 3.6 |
| PM2.5 μm/m3 cf_1 | 46,305 | 1,822 | 3,042 | 1,815 | 3.9 | 6.6 | 3.9 |
| PM10.0 μm/m3 cf_1 | 46,305 | 1,869 | 3,146 | 1,862 | 4.0 | 6.8 | 4.0 |
| PM1.0 μm/m3 cf_atm | 46,299 | 1,498 | 2,019 | 1,488 | 3.2 | 4.4 | 3.2 |
| PM2.5 μm/m3 cf_atm | 46,305 | 1,632 | 2,193 | 1,537 | 3.5 | 4.7 | 3.3 |
| PM10.0 μm/m3 cf_atm | 46,299 | 1,762 | 2,558 | 1,626 | 3.8 | 5.5 | 3.5 |
| AFTER FILTER | |||||||
| Temperature (°C) | 44,928 | 624 | 1,470 | 624 | 1.4 | 3.3 | 1.4 |
| Humidity (%) | 45,740 | 260 | 556 | 260 | 0.6 | 1.2 | 0.6 |
| PM1.0 μm/m3 cf_1 | 46,091 | 1,386 | 2,449 | 1,378 | 3.0 | 5.3 | 3.0 |
| PM2.5 μm/m3 cf_1 | 46,091 | 1,549 | 2,738 | 1,545 | 3.4 | 5.9 | 3.4 |
| PM10.0 μm/m3 cf_1 | 46,091 | 1,598 | 2,854 | 1,593 | 3.5 | 6.2 | 3.5 |
| PM1.0 μm/m3 cf_atm | 46,089 | 1,232 | 1,741 | 1,225 | 2.7 | 3.8 | 2.7 |
| PM2.5 μm/m3 cf_atm | 46,095 | 1,376 | 1,897 | 1,282 | 3.0 | 4.1 | 2.8 |
| PM10.0 μm/m3 cf_atm | 46,089 | 1,475 | 2,231 | 1,340 | 3.2 | 4.8 | 2.9 |
[i] GESD, generalized extreme studentized deviate; IQR, interquartile range; PM, particulate matter.
Table 3:
Outliers of IQR and GESD methods on hourly data for temperature (°C), humidity (%), and PM (1.0 μm/m3, 2.5 μm/m3, 10.0 μm/m3) before and after filter application
| Observations (n) | IQR outliers (n) | GESD outliers (n) | Outlier observations in both methods (n) | IQR outliers/observations (%) | GESD outliers/observations (%) | Both methods/observations (%) | |
|---|---|---|---|---|---|---|---|
| Temperature (°C) | 1,074,342 | 5,643 | 7,471 | 4,272 | 0.4 | 0.7 | 0.4 |
| Humidity (%) | 1,074,342 | 6,373 | 7,196 | 6,026 | 0.6 | 0.7 | 0.6 |
| PM1.0 μm/m3 cf_1 | 1,087,434 | 49,742 | 70,944 | 48,046 | 4.4 | 6.5 | 4.4 |
| PM2.5 μm/m3 cf_1 | 1,087,434 | 52,848 | 73,647 | 51,091 | 4.7 | 6.8 | 4.7 |
| PM10.0 μm/m3 cf_1 | 1,087,434 | 54,936 | 75,768 | 53,141 | 4.9 | 7.0 | 4.9 |
| PM1.0 μm/m3 cf_atm | 1,087,362 | 37,216 | 46,946 | 34,170 | 3.4 | 4.3 | 3.1 |
| PM2.5 μm/m3 cf_atm | 1,087,434 | 38,954 | 46,011 | 34,936 | 3.6 | 4.2 | 3.2 |
| PM10.0 μm/m3 cf_atm | 1,087,362 | 49,344 | 67,686 | 45,595 | 4.5 | 6.2 | 4.2 |
| AFTER FILTER | |||||||
| Temperature (°C) | 1,056,463 | 2,984 | 4,682 | 2,812 | 0.3 | 0.4 | 0.3 |
| Humidity (%) | 1,074,342 | 6,373 | 7,196 | 6,026 | 0.6 | 0.7 | 0.6 |
| PM1.0 μm/m3 cf_1 | 1,082,638 | 46,121 | 67,057 | 44,444 | 4.3 | 6.2 | 4.1 |
| PM2.5 μm/m3 cf_1 | 1,082,631 | 49,387 | 69,968 | 47,650 | 4.6 | 6.5 | 4.4 |
| PM10.0 μm/m3 cf_1 | 1,082,619 | 50,824 | 71,449 | 49,052 | 4.7 | 6.6 | 4.5 |
| PM1.0 μm/m3 cf_atm | 1,082,576 | 33,896 | 43,637 | 30,887 | 3.1 | 4.0 | 2.9 |
| PM2.5 μm/m3 cf_atm | 1,082,646 | 35,257 | 42,116 | 31,249 | 3.3 | 3.9 | 2.9 |
| PM10.0 μm/m3 cf_atm | 1,082,573 | 45,929 | 63,842 | 42,188 | 4.2 | 5.9 | 3.9 |
[i] GESD, generalized extreme studentized deviate; IQR, interquartile range; PM, particulate matter.
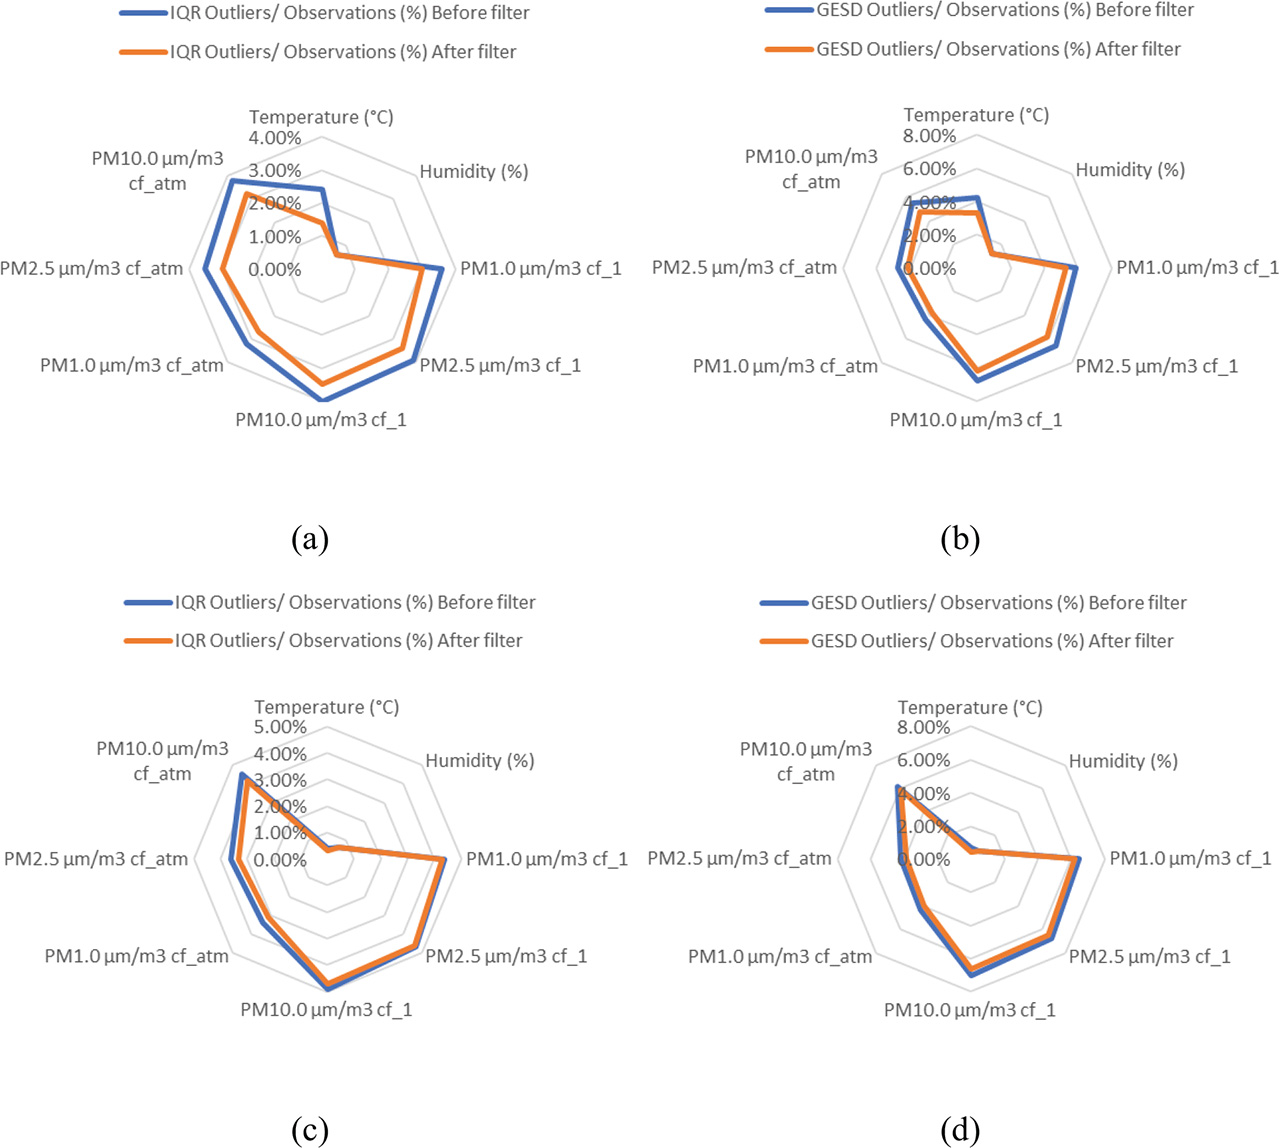
Figure 4:
Outliers/observations (%) before and after filter for (a) IQR method on daily data, (b) GESD method on daily data, (c) IQR method on hourly data, and (d) GESD method on hourly data. GESD, generalized extreme studentized deviate; IQR, interquartile range; PM, particulate matter.
Table 4:
IQR and GESD outliers on hourly data without duplicates, for Temperature (°C), Humidity (%), and PM (1.0 μm/m3, 2.5 μm/m3, 10.0 μm/m3) before and after filter application
| Observations (n) | IQR outliers (n) | GESD outliers (n) | Outlier observations in both methods (n) | IQR outliers/observations (%) | GESD outliers/observations (%) | Both methods/observations (%) | |
|---|---|---|---|---|---|---|---|
| Temperature (°C) | 682,028 | 3,533 | 4,763 | 3,531 | 0.5 | 0.7 | 0.5 |
| Humidity (%) | 682,028 | 2,685 | 3,817 | 2,685 | 0.4 | 0.6 | 0.4 |
| PM1.0 μm/m3 cf_1 | 691,210 | 28,161 | 40,473 | 28,161 | 4.1 | 5.9 | 4.1 |
| PM2.5 μm/m3 cf_1 | 691,210 | 29,515 | 42,624 | 29,515 | 4.3 | 6.2 | 4.3 |
| PM10.0 μm/m3 cf_1 | 691,210 | 30,364 | 43,831 | 30,364 | 4.4 | 6.3 | 4.4 |
| PM1.0 μm/m3 cf_atm | 691,159 | 18,076 | 22,099 | 18,074 | 2.6 | 3.2 | 2.6 |
| PM2.5 μm/m3 cf_atm | 691,210 | 18,874 | 23,095 | 18,866 | 2.7 | 3.3 | 2.7 |
| PM10.0 μm/m3 cf_atm | 691,159 | 22,396 | 33,156 | 22,020 | 3.2 | 4.8 | 3.2 |
| AFTER FILTER | |||||||
| Temperature (°C) | 671,277 | 2,068 | 3,486 | 2,066 | 0.3 | 0.5 | 0.3 |
| Humidity (%) | 682,028 | 2,685 | 3,817 | 2,685 | 0.4 | 0.6 | 0.4 |
| PM1.0 μm/m3 cf_1 | 688,544 | 26,450 | 38,706 | 26,450 | 3.8 | 5.6 | 3.8 |
| PM2.5 μm/m3 cf_1 | 688,537 | 27,692 | 40,662 | 27,692 | 4.0 | 5.9 | 4.0 |
| PM10.0 μm/m3 cf_1 | 688,527 | 28,398 | 41,690 | 28,398 | 4.1 | 6.1 | 4.1 |
| PM1.0 μm/m3 cf_atm | 688,500 | 16,234 | 20,235 | 16,232 | 2.4 | 2.9 | 2.4 |
| PM2.5 μm/m3 cf_atm | 688,549 | 17,050 | 21,219 | 17,042 | 2.5 | 3.1 | 2.5 |
| PM10.0 μm/m3 cf_atm | 688,497 | 20,508 | 31,115 | 20,132 | 3.0 | 4.5 | 2.9 |
[i] GESD, generalized extreme studentized deviate; IQR, interquartile range; PM, particulate matter.
Table 5:
IQR and GESD outliers on daily data without duplicates, for Temperature (°C), Humidity (%), and PM (1.0 μm/m3, 2.5 μm/m3, 10.0 μm/m3) before and after filter application
| Observations (n) | IQR outliers (n) | GESD outliers (n) | Outlier observations in both methods (n) | IQR outliers/observations (%) | GESD outliers/observations (%) | Both methods/observations (%) | |
|---|---|---|---|---|---|---|---|
| Temperature (°C) | 29,040 | 380 | 735 | 380 | 1.3 | 2.5 | 1.3 |
| Humidity (%) | 29,040 | 94 | 234 | 94 | 0.3 | 0.8 | 0.3 |
| PM1.0 μm/m3 cf_1 | 29,437 | 665 | 1,302 | 665 | 2.3 | 4.4 | 2.3 |
| PM2.5 μm/m3 cf_1 | 29,437 | 716 | 1,494 | 708 | 2.4 | 5.1 | 2.4 |
| PM10.0 μm/m3 cf_1 | 29,437 | 751 | 1,552 | 751 | 2.6 | 5.3 | 2.6 |
| PM1.0 μm/m3 cf_atm | 29,435 | 560 | 835 | 553 | 1.9 | 2.8 | 1.9 |
| PM2.5 μm/m3 cf_atm | 29,437 | 596 | 926 | 596 | 2.0 | 3.1 | 2.0 |
| PM10.0 μm/m3 cf_atm | 29,435 | 608 | 1,051 | 606 | 2.1 | 3.6 | 2.1 |
| AFTER FILTER | |||||||
| Temperature (°C) | 28,552 | 221 | 579 | 221 | 0.8 | 2.0 | 0.8 |
| Humidity (%) | 29,040 | 94 | 234 | 94 | 0.3 | 0.8 | 0.3 |
| PM1.0 μm/m3 cf_1 | 29,316 | 554 | 1,188 | 554 | 1.9 | 4.1 | 1.9 |
| PM2.5 μm/m3 cf_1 | 29,316 | 592 | 1,360 | 584 | 2.0 | 4.6 | 2.0 |
| PM10.0 μm/m3 cf_1 | 29,316 | 624 | 1,417 | 624 | 2.1 | 4.8 | 2.1 |
| PM1.0 μm/m3 cf_atm | 29,316 | 443 | 713 | 436 | 1.5 | 2.4 | 1.5 |
| PM2.5 μm/m3 cf_atm | 29,318 | 485 | 807 | 485 | 1.7 | 2.8 | 1.7 |
| PM10.0 μm/m3 cf_atm | 29,316 | 495 | 930 | 493 | 1.7 | 3.2 | 1.7 |
[i] GESD, generalized extreme studentized deviate; IQR, interquartile range; PM, particulate matter.
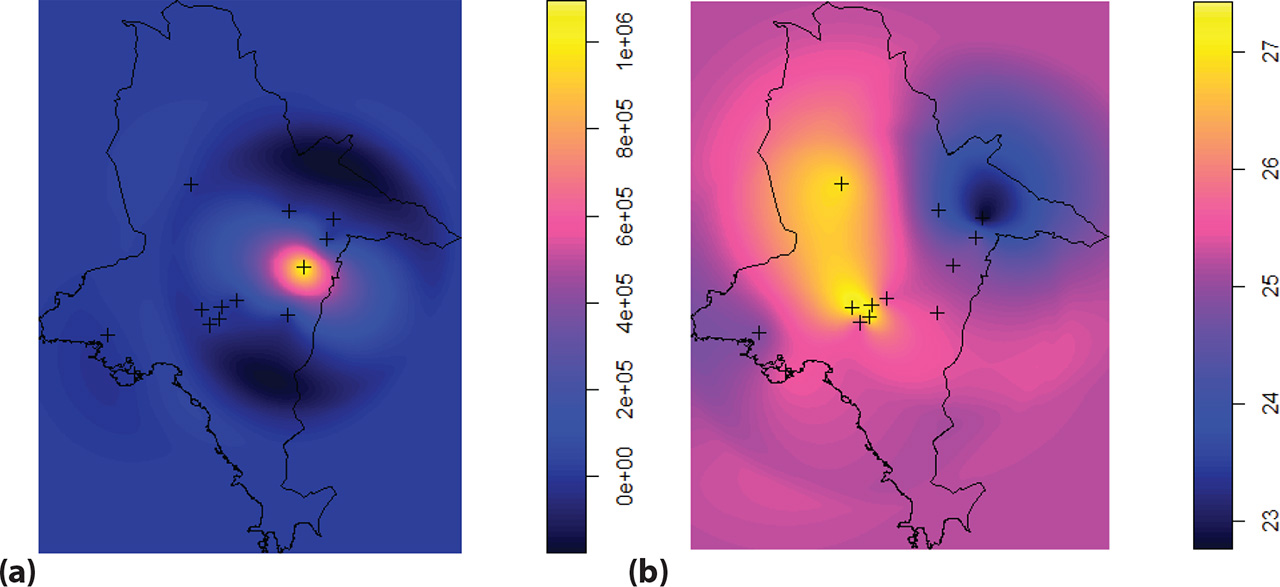
Figure 5:
OK of hourly temperature data on 2019-05-24 00:00:00 UTC (a) with an extreme value, (b) without outliers. OK, ordinary kriging.
Table 6:
OK RMSE of hourly temperature data on 2019-05-24 00:00:00 UTC, before and after outlier filter for 10 repetitions
| Before filter | 4,083.351 | 8,997.641 | 4,102.043 | 4,080.238 | 544.752 | 4,141.303 | 426.213 | 4,087.449 | 8,030.859 | 3,272.878 |
| After filter | 0.209 | 0.540 | 0.501 | 0.204 | 0.155 | 0.507 | 0.285 | 0.312 | 0.503 | 0.245 |
[i] OK, ordinary kriging; RMSE, root mean square error.