
Figure 1:
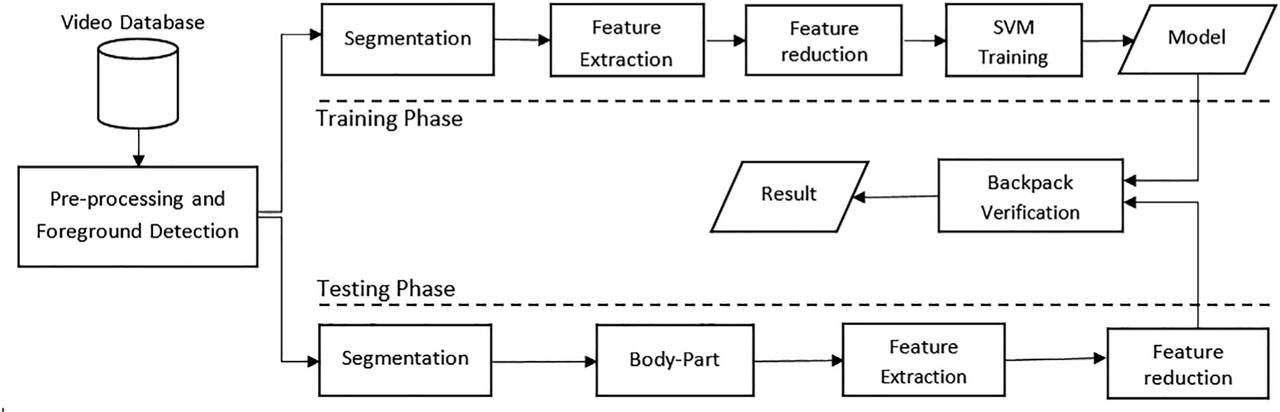
Figure 2:
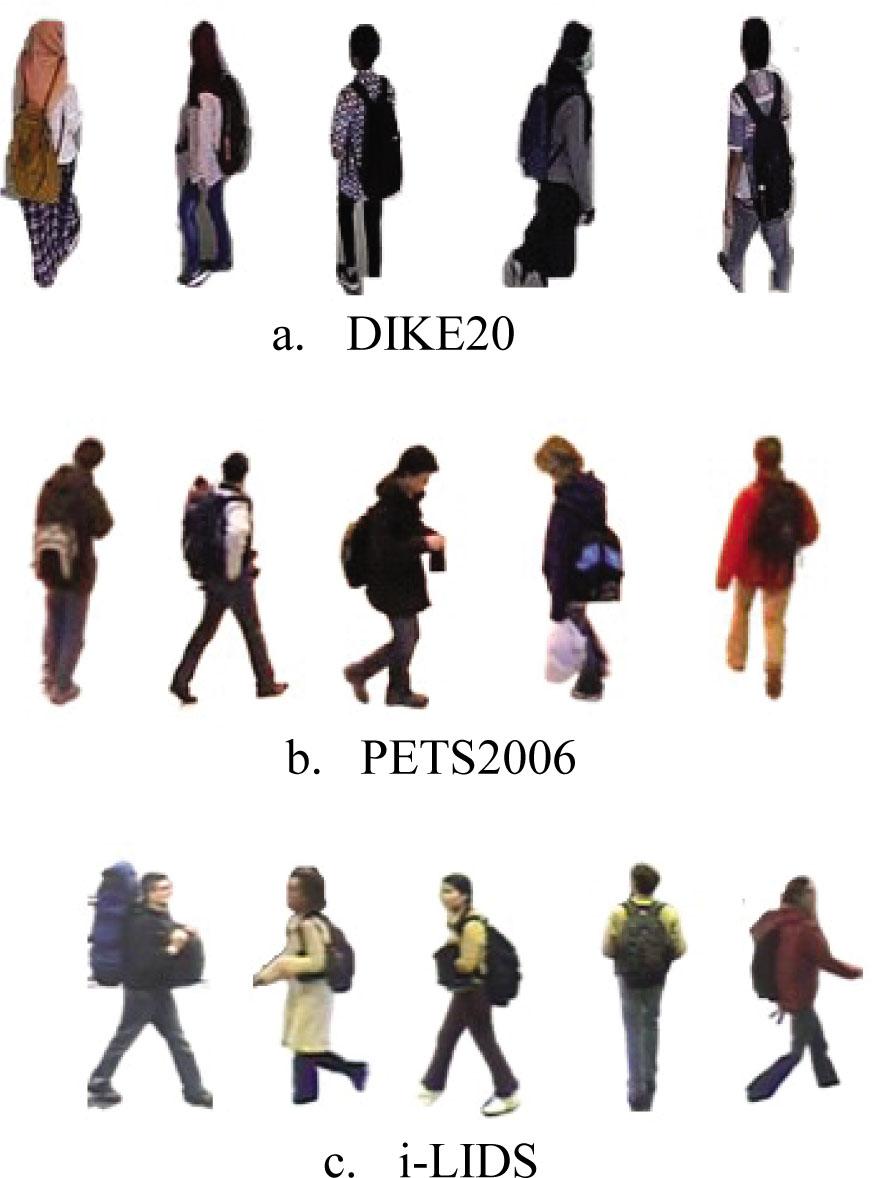
Figure 3:
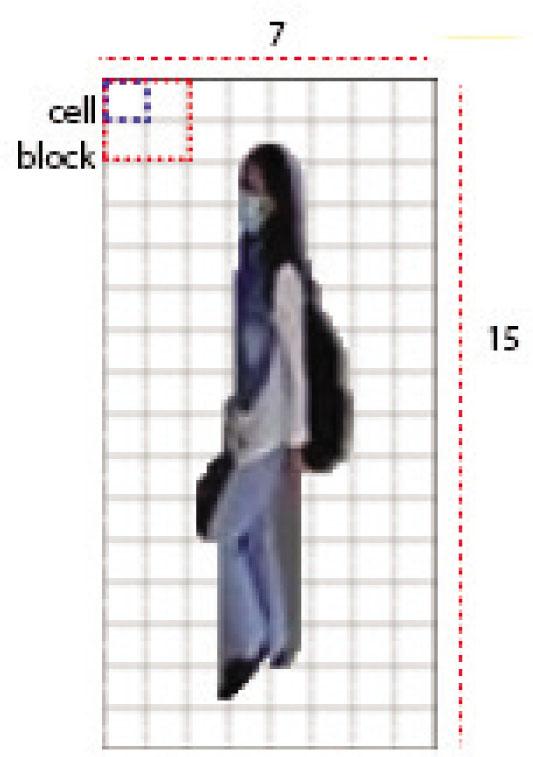
Figure 4:
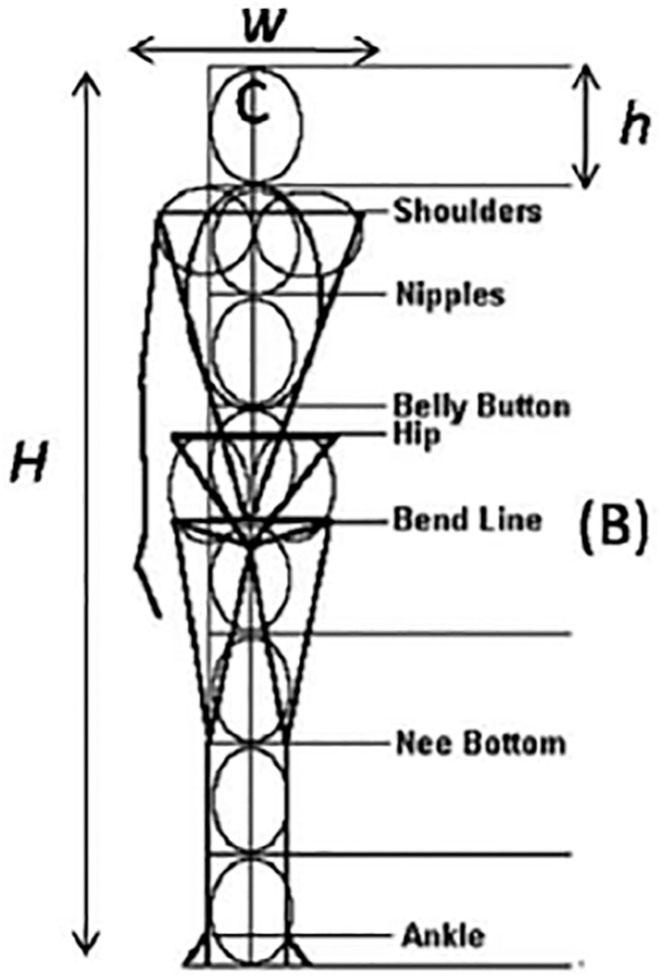
Figure 5:
Figure 6:
Figure 7:

Figure 8:
Figure 9:
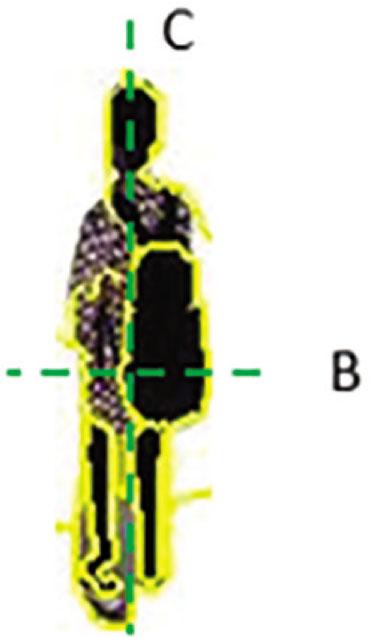
Figure 10:

Figure 11:
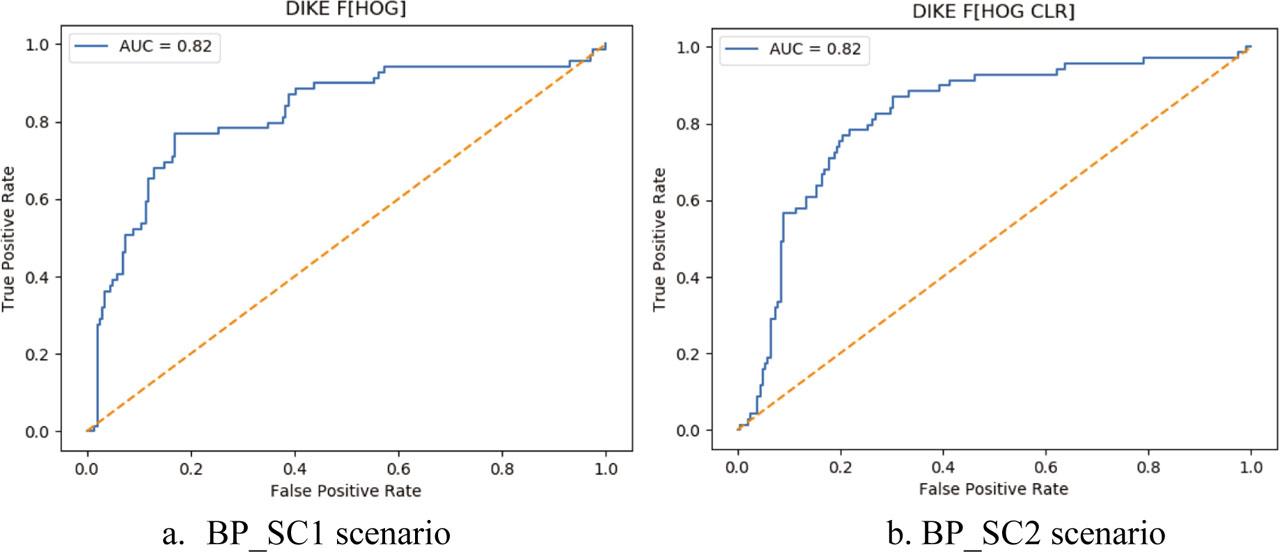
Figure 12:
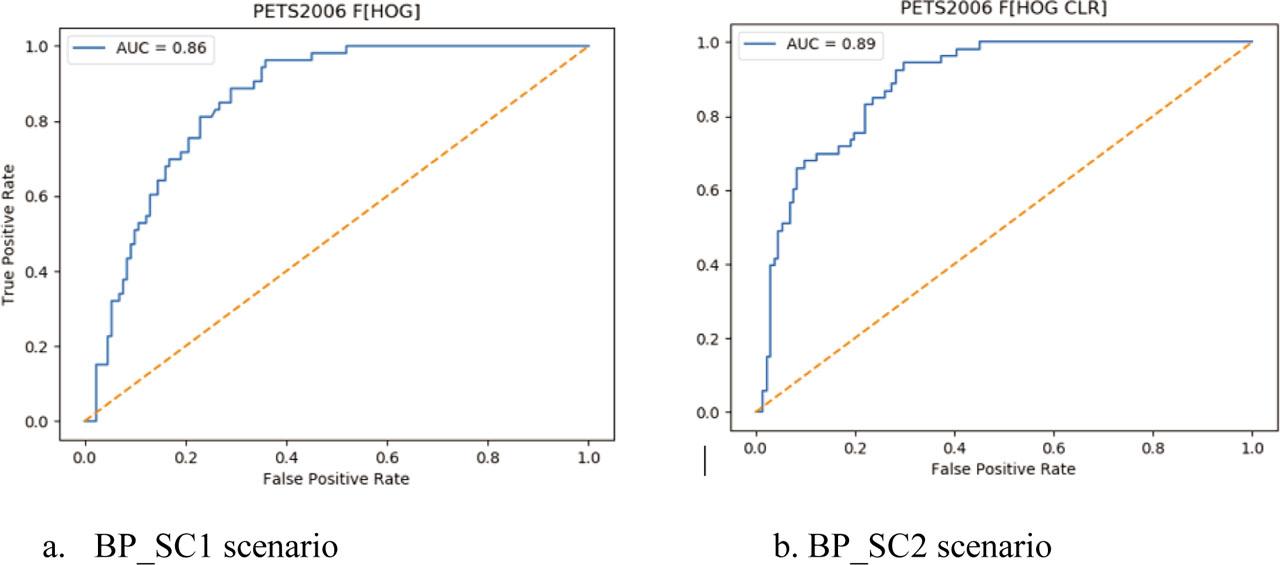
Figure 13:
The selected superpixels and their location based on bend line
| Superpixels | Location |
|---|---|
| B + 3h | |
| B + 2h | |
| B + 2h | |
| B + h | |
| B + h |
Comparison of precision, recall, and F1 scores on the PETS2006 dataset
| Methods | Precision | Recall | F1 score |
|---|---|---|---|
| Damen and Hog (2012) | 50% | 55% | 52% |
| Ghadiri et al. (2017) | 57% | 71% | 63% |
| Ghadiri et al. (2019) | 60% | 79% | 68% |
| Proposed Methods | |||
| BP_SC1 | 56% | 85% | 68% |
| BP_SC2 | 59% | 83% | 69% |
SLIC segmentation
| 1: | Centroid Initialization Ck=[lk,ak,bk,xk,yk]T |
| 2: | Put centroid in n × n window |
| 3: | repeat |
| 4: | for each cluster Ck do |
| 5: | Group each pixel in the nearest centroid (based on measurement of pixel distance to centroid) |
| end for | |
| 6: | Update centroid |
| 7: | until centroid unchanged |
Number of test images in each dataset
| Dataset | Test Images |
|---|---|
| DIKE20 | 271 |
| PETS2006 | 323 |
| i-LIDS | 185 |
| Total | 779 |
The precision, recall, and F1 scores on DIKE20 dataset
| Methods | Precision | Recall | F1 score |
|---|---|---|---|
| BP_SC1 | 46% | 79% | 60% |
| BP_SC2 | 52% | 80% | 63% |
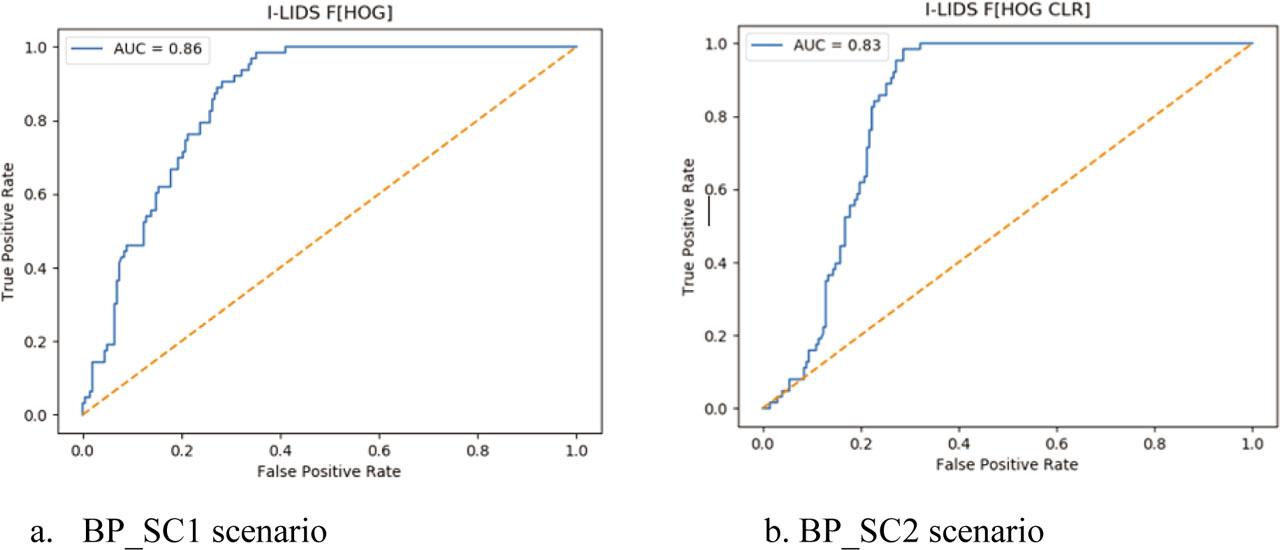
Comparison of precision, recall, and F1 scores on the i-LIDS dataset
| Methods | Precision | Recall | F1 score |
|---|---|---|---|
| Damen and Hog (2012) | 52% | 47% | 49% |
| Ghadiri et al. (2017) | 62% | 60% | 61% |
| Ghadiri et al. (2019) | 72% | 64% | 67% |
| Proposed Methods | |||
| BP_SC1 | 49% | 90% | 64% |
| BP_SC2 | 52% | 95% | 67% |