
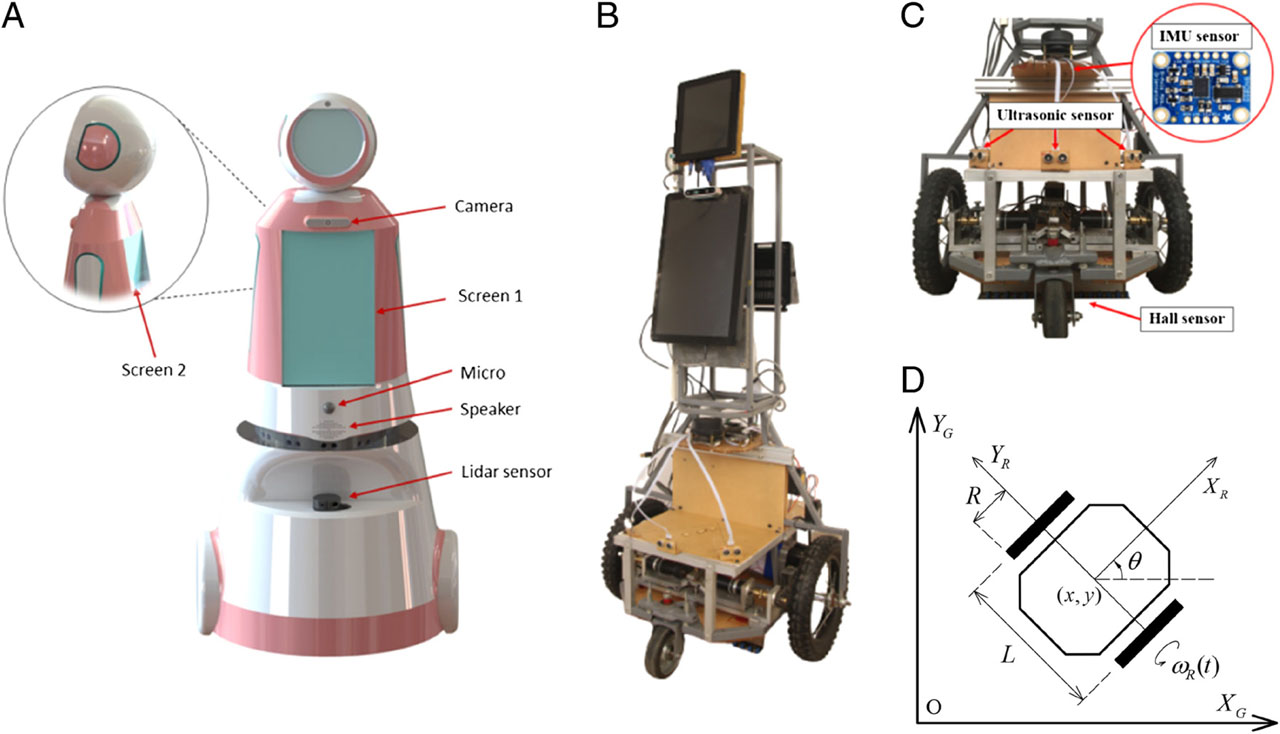
Figure 1
(a) 3D simulation image of iRobt. (b) Crafted iRobt images. (c) Location of sensors, (d) Posture and parameters of the robot in two coordinate system.
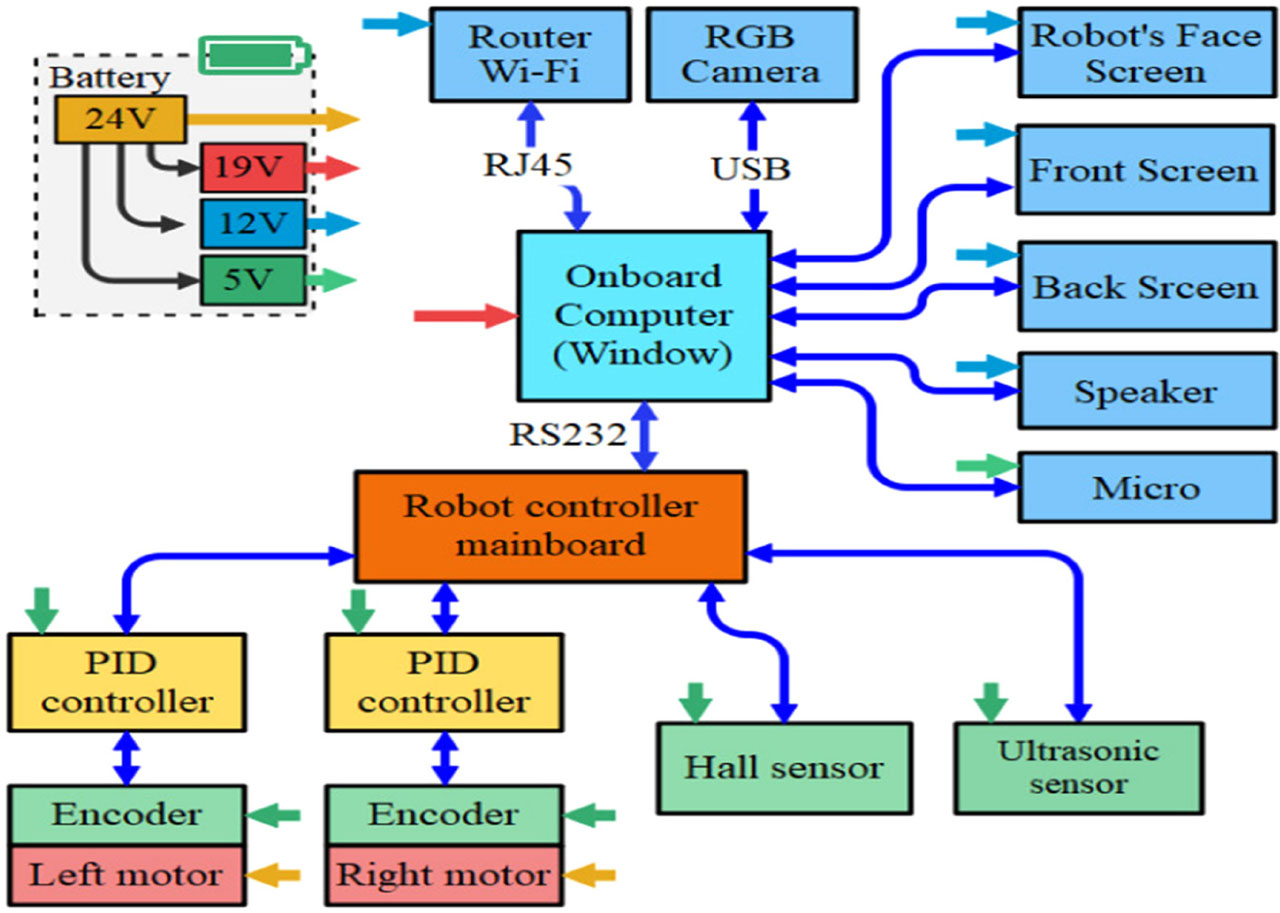
Figure 2
Block diagram of the robot system.
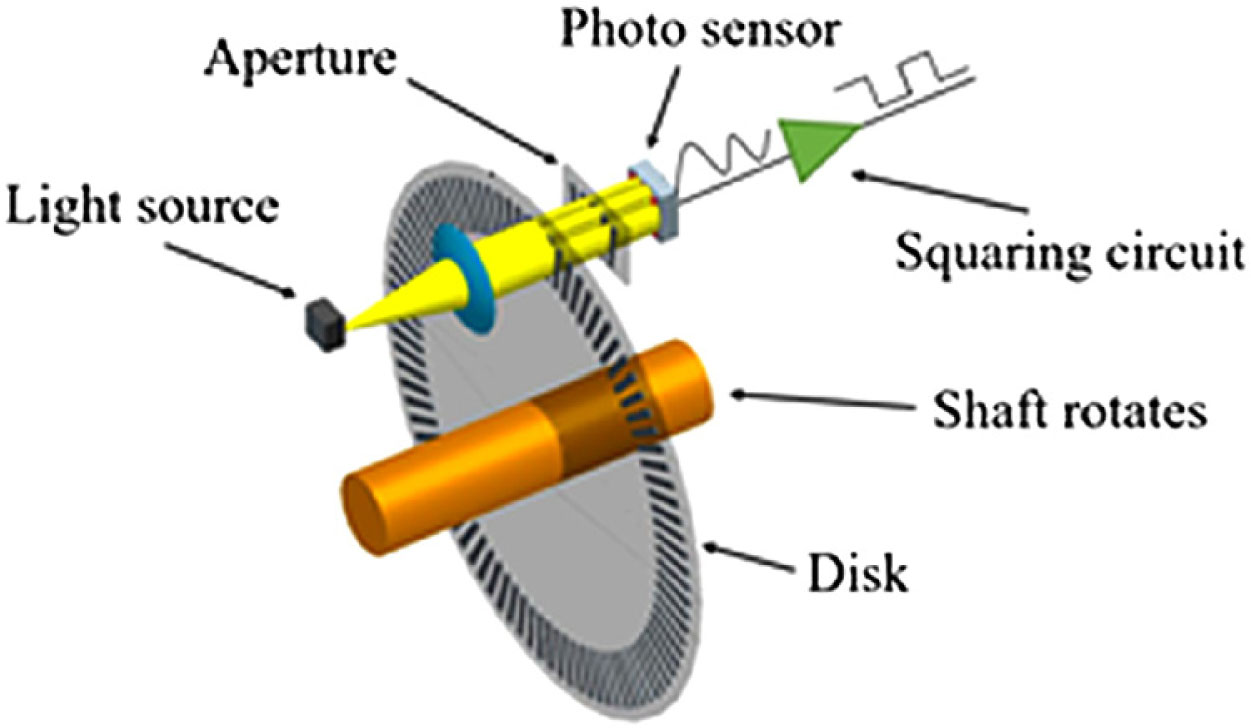
Figure 3
Structure of the rotary encoder.
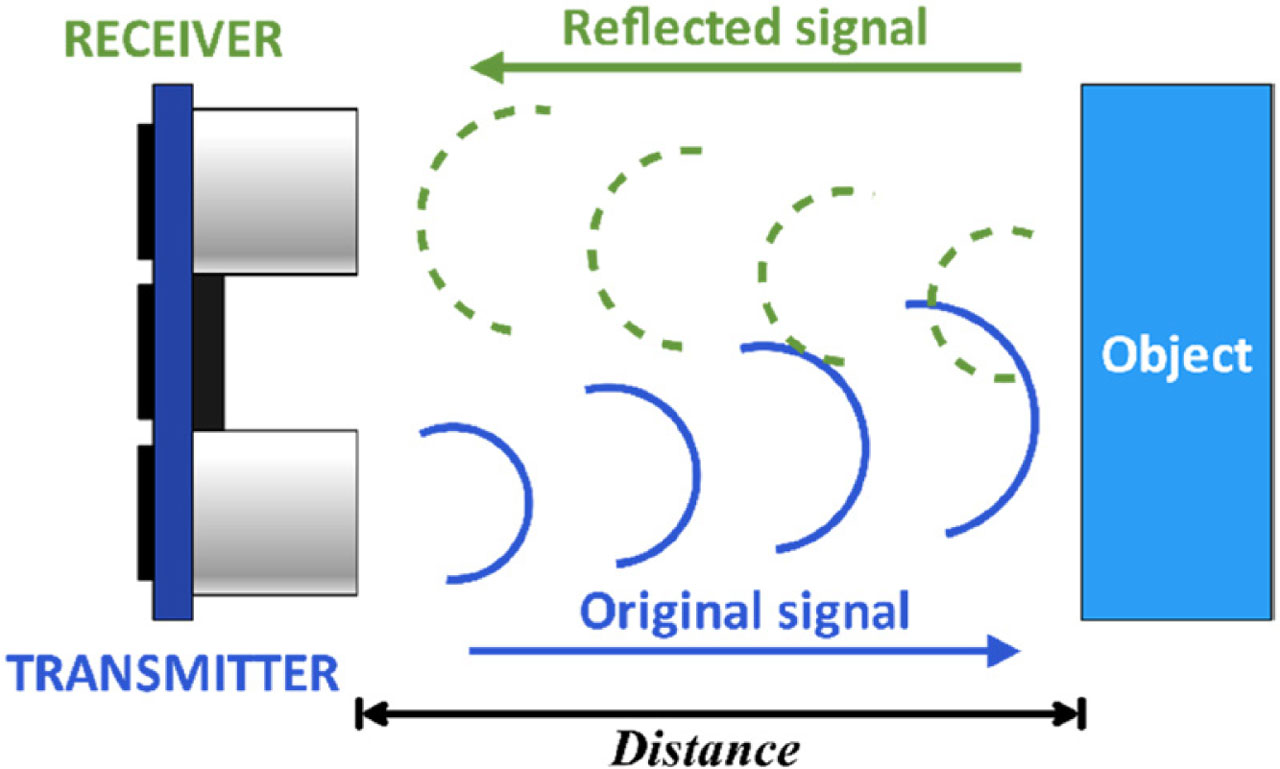
Figure 4
Ultrasonic sensor.
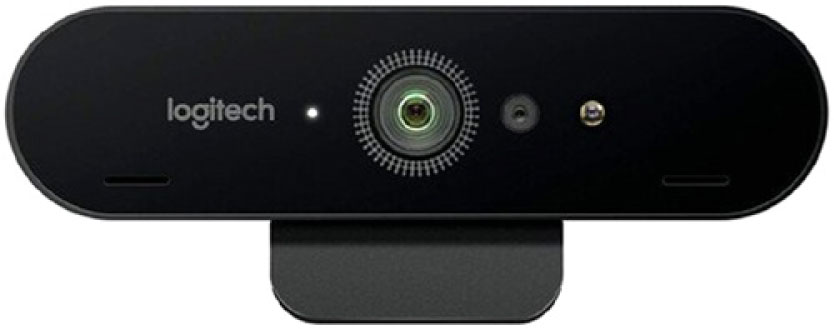
Figure 5
Logitech BRIO 4K.
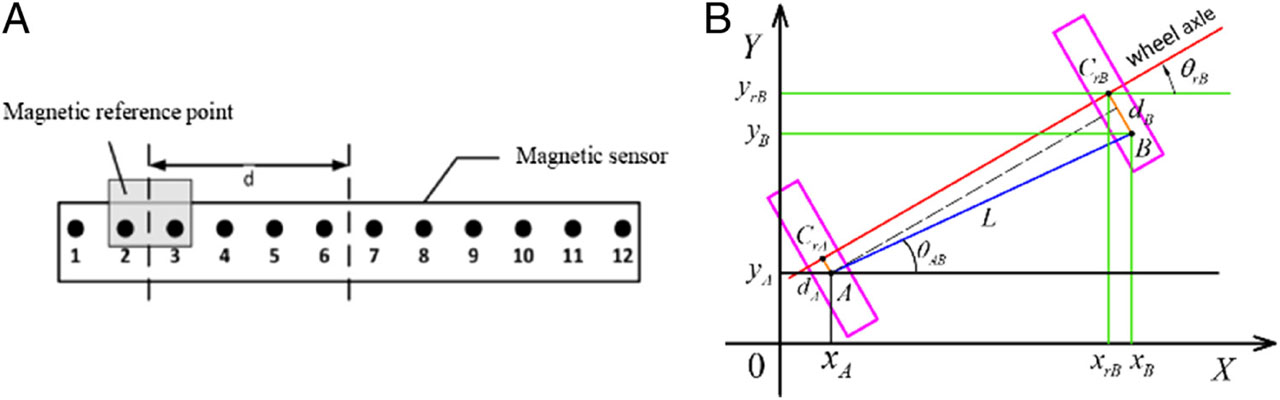
Figure 6
(a) Magnetic sensor model and magnet reference point. (b) Calculation of position and orientation of Robot at the reference point.
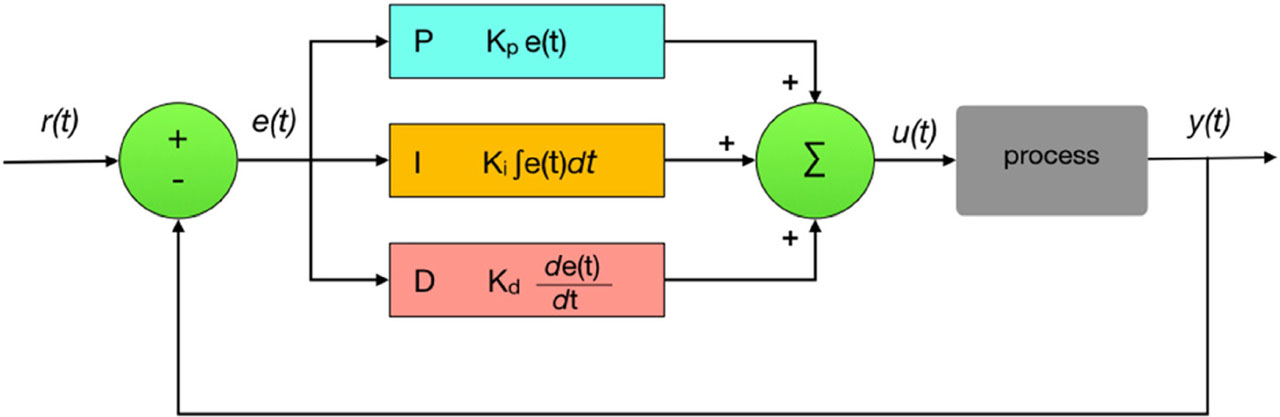
Figure 7
Block diagram of a PID controller in a feedback loop.
Table 1
Keyword and label data sheet.
| No | Keywork | Tag |
|---|---|---|
| 1 | Flight information, flight schedule, etc. | __label__#fly_schedule# |
| 2 | Station map, etc. | __label__#station_map# |
| 3 | Restaurant, cafeteria, food, food, etc. | __label__#restaurant# |
| 4 | Things not to bring on board, dangerous items, etc. | __label__#dangerous_object# |
| 5 | Smile, take photo, etc. | __label__#capture_photo# |
| 6 | Hello, hello robot, etc. | __label__#greeting# |
| 7 | bye bye, goodbye, thank you, etc. | __label__#goodbye# |
| 8 | give me information about the weather, etc. | __label__#weather# |
| 9 | … | … |
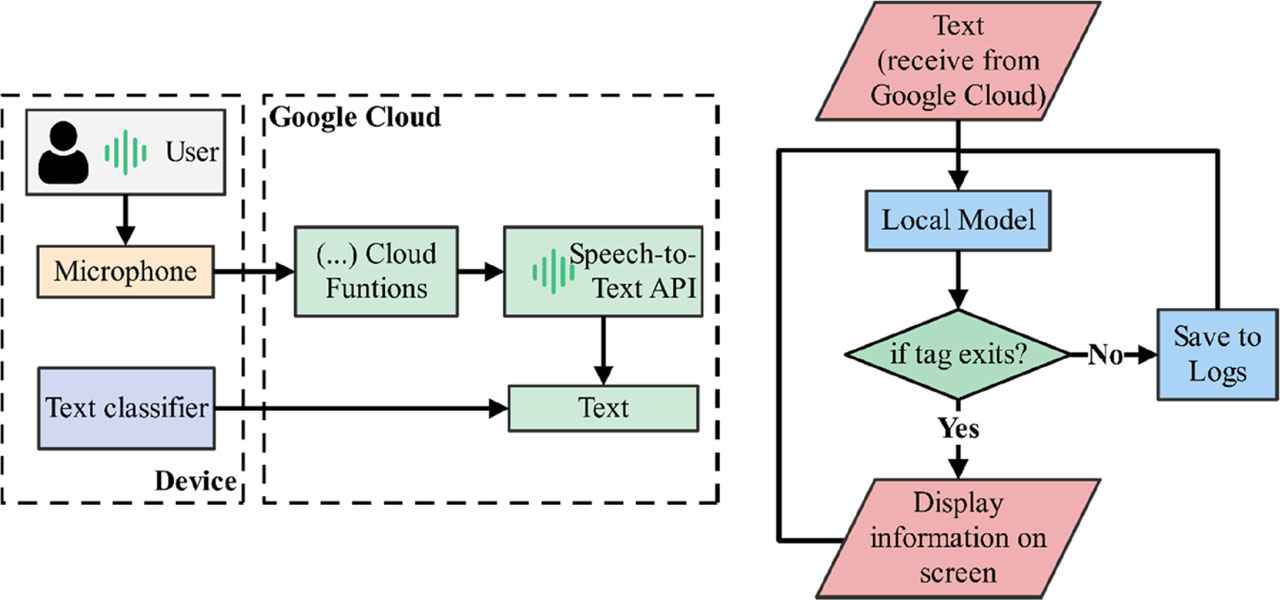
Figure 8
(a) Voice recognition model. (b) Flowchart of the passenger answering program algorithm.
Figure 9
The image pyramid object.
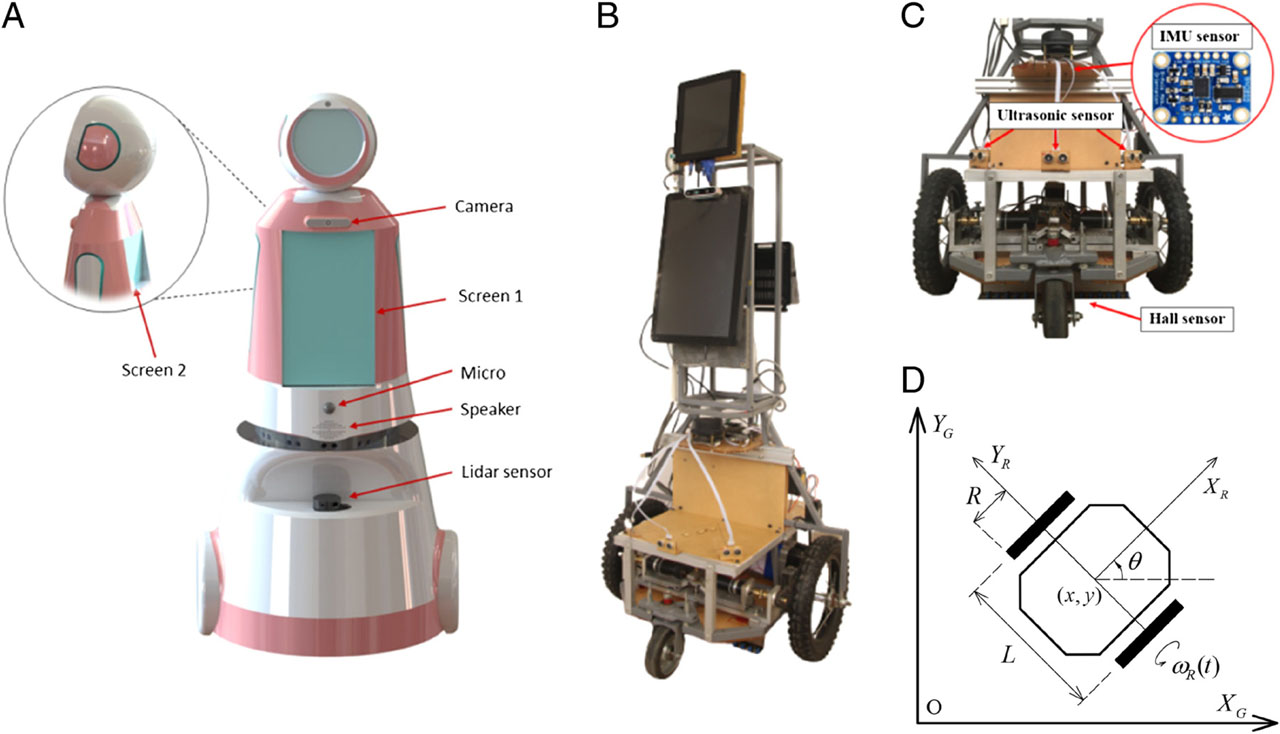
Figure 10
(a) P-net, R-net and image processing results of NMS. (b) O-net and face detection result.
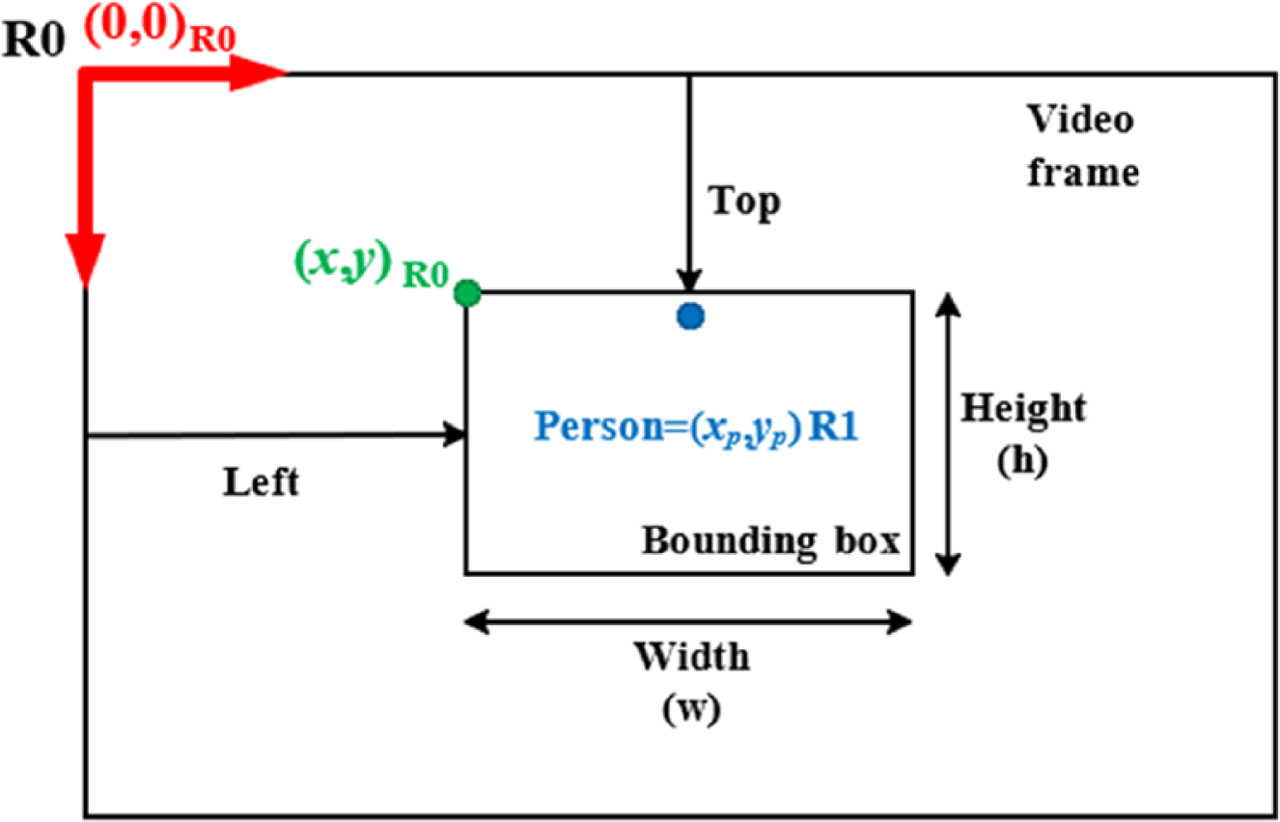
Figure 11
Coordinates and dimensions of the bounding box in the image.
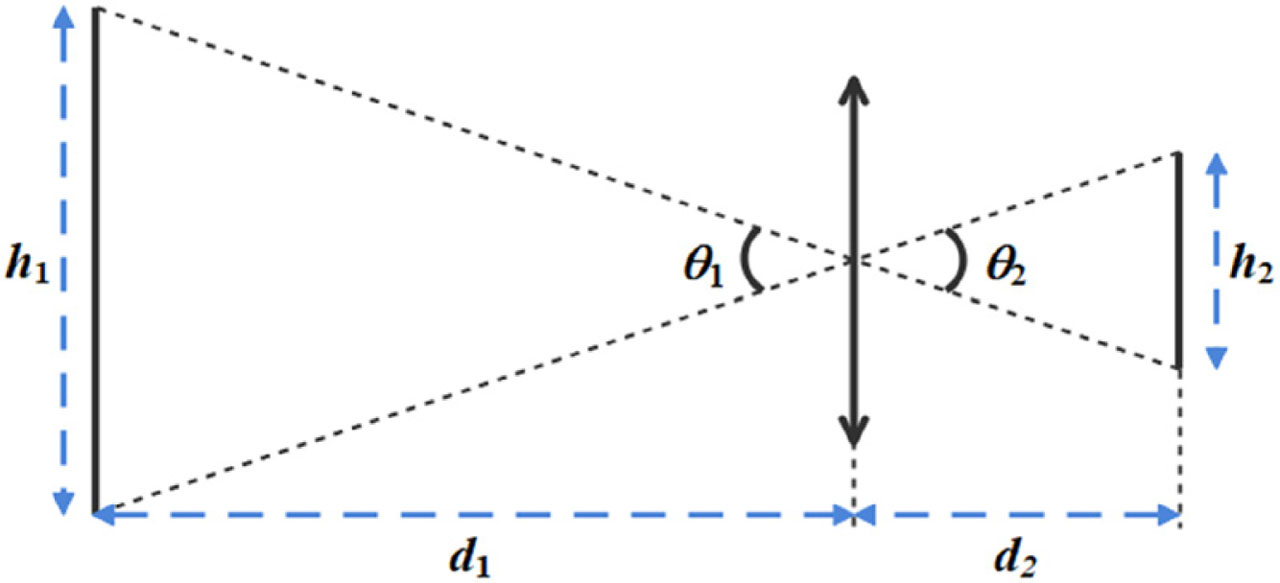
Figure 12
Two similar triangles opposite each other.
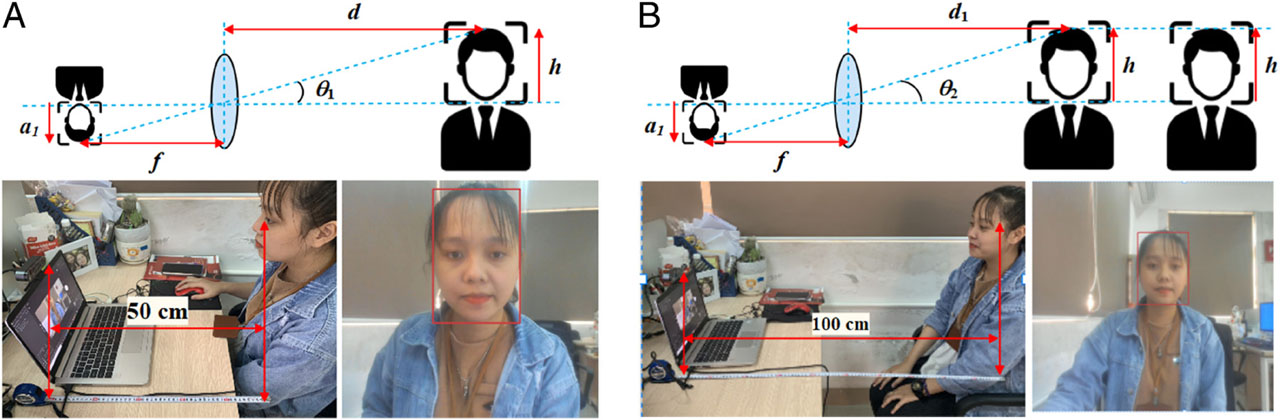
Figure 13
(a) Method of determining the focal length of the camera. (b) Determine the distance using the triangle similarity method.
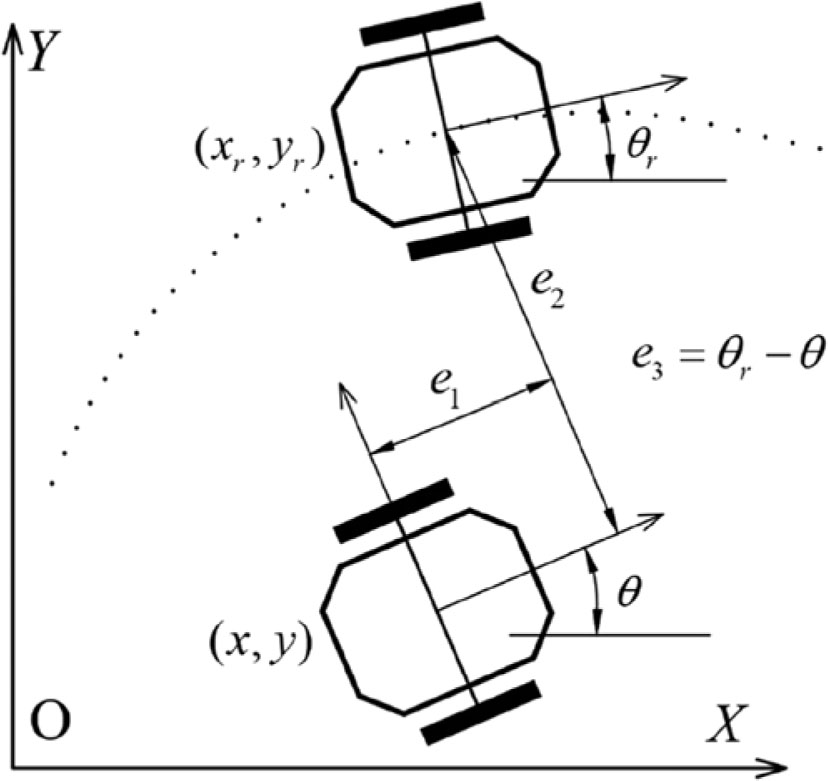
Figure 14
The positional error between the robot's actual coordinates and the reference coordinates in the trajectory.
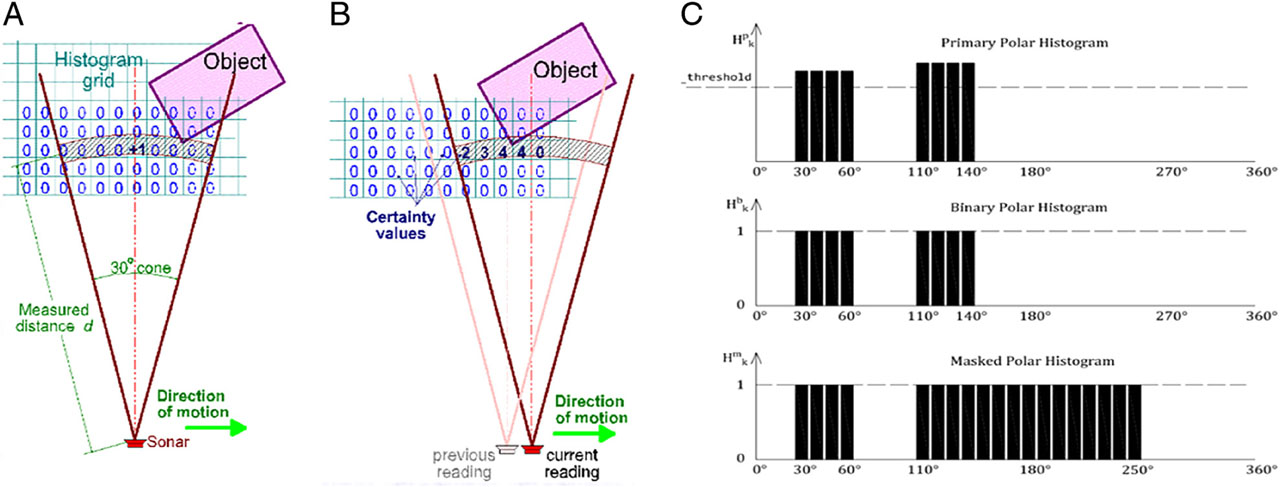
Figure 15
(a) Histogram grid. (b) enlargement angle from robot to obstacle. (c) Example of blocked directions.
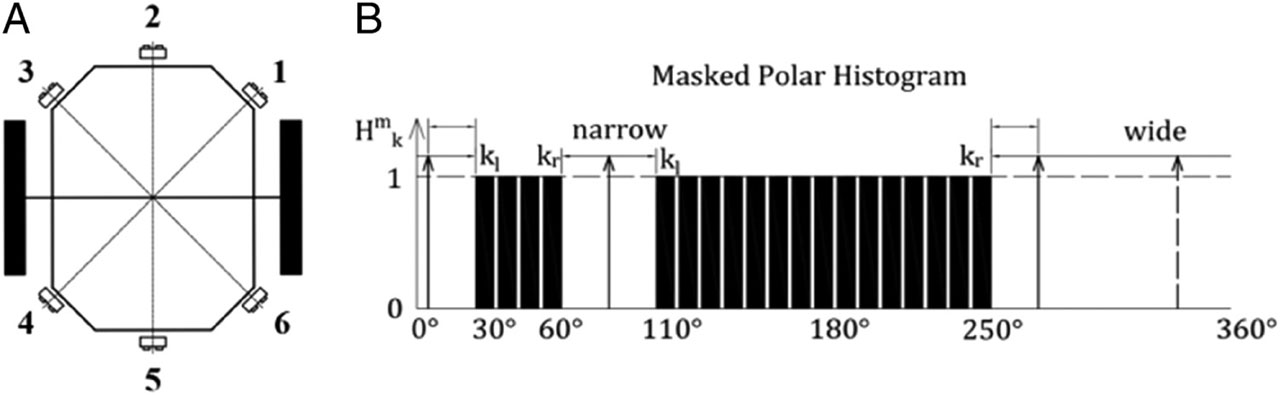
Figure 16
(a) Layout diagram of ultrasonic sensors. (b) Selecting the most optimal direction among candidate direction.

Figure 17
Testing the model on a single sentence.

Figure 18
Model's performance on the test set.
Table 2
Test result data sheet.
| Researcher | Number of correct classifications | Number of times of misclassification | Number of times unclassifiable |
|---|---|---|---|
| 1 | 26 | 2 | 2 |
| 2 | 28 | 1 | 1 |
| 3 | 27 | 2 | 1 |
| 4 | 23 | 4 | 3 |
| 5 | 29 | 0 | 1 |
Table 3
The results of the experimental measurements of the non-calibrated program.
| Number of measurements | Actual distance | Average prediction distance | Average error | Percent error average |
|---|---|---|---|---|
| 1–10 | 1.2 | 1.19 | 0.01 | 0.83% |
| 11–20 | 1.8 | 1.73 | 0.07 | 3.89% |
| 21–30 | 2.4 | 2.01 | 0.39 | 16.25% |
Table 4
Results of experimental measurements of the calibrated program.
| Number of measurements | Actual distance | Average prediction distance | Average Error | Percent error Average |
|---|---|---|---|---|
| 1–10 | 1.2 | 1.18 | 0.02 | 1.67% |
| 11–20 | 1.8 | 1.76 | 0.04 | 2.22% |
| 21–30 | 2.4 | 2.14 | 0.26 | 2.67% |
Table 5
Compare the distance measured results with the images in the laboratory environment.
| Light conditions | Outside light | Light of the light bulb |
|---|---|---|
| In the practice room | 50% | 75% |
Table 6
Compare the distance measured results with outdoor images.
| Light conditions | Harsh light | Weak outdoor light | Average outdoor light |
|---|---|---|---|
| Distance measurement ratio | 52% | 57% | 90% |
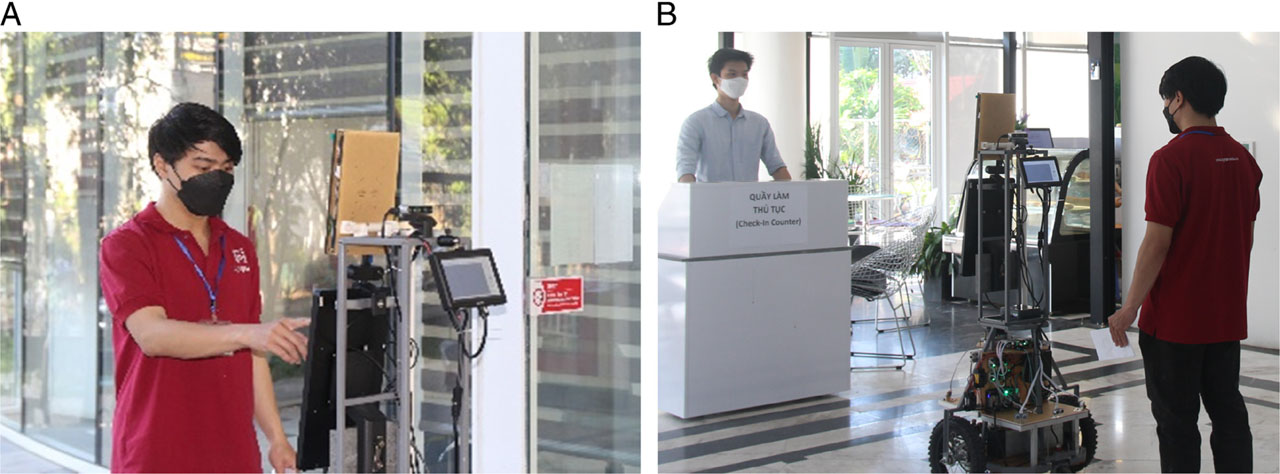
Figure 19
(a) Passengers interact with the robot. (b) The robot leads the passenger to the check-in counter.
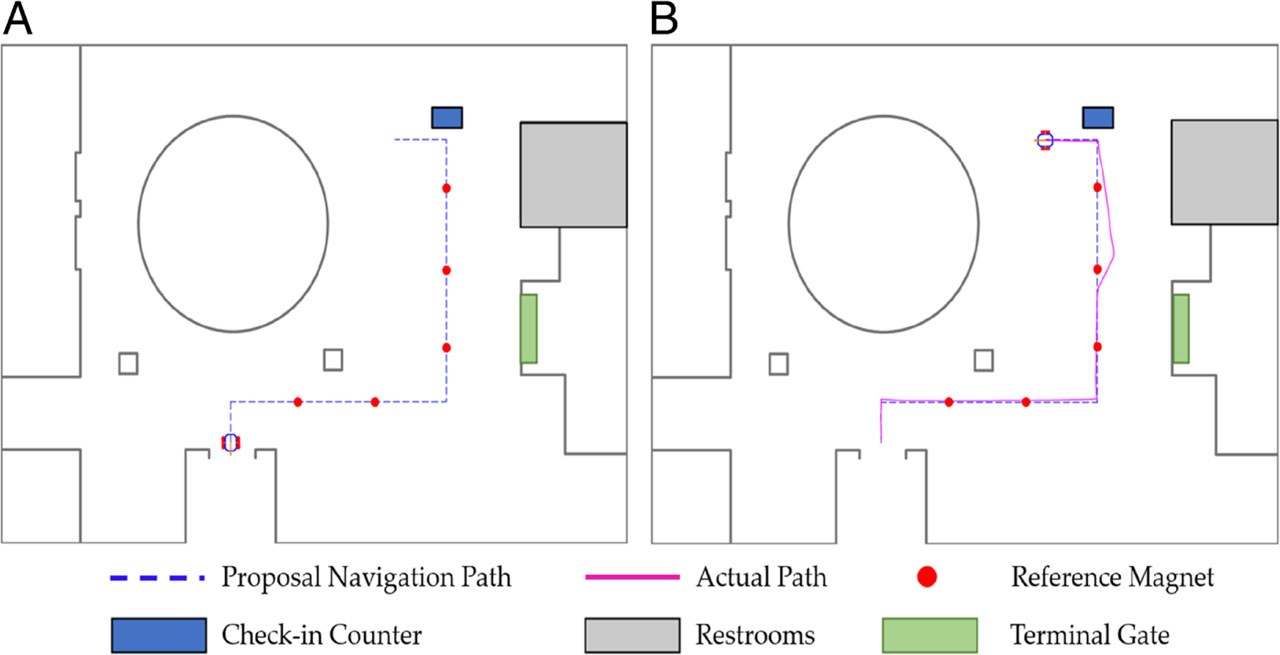
Figure 20
(a) Airport terminal map and robot path. (b) the actual path of the robot during passenger guidance.
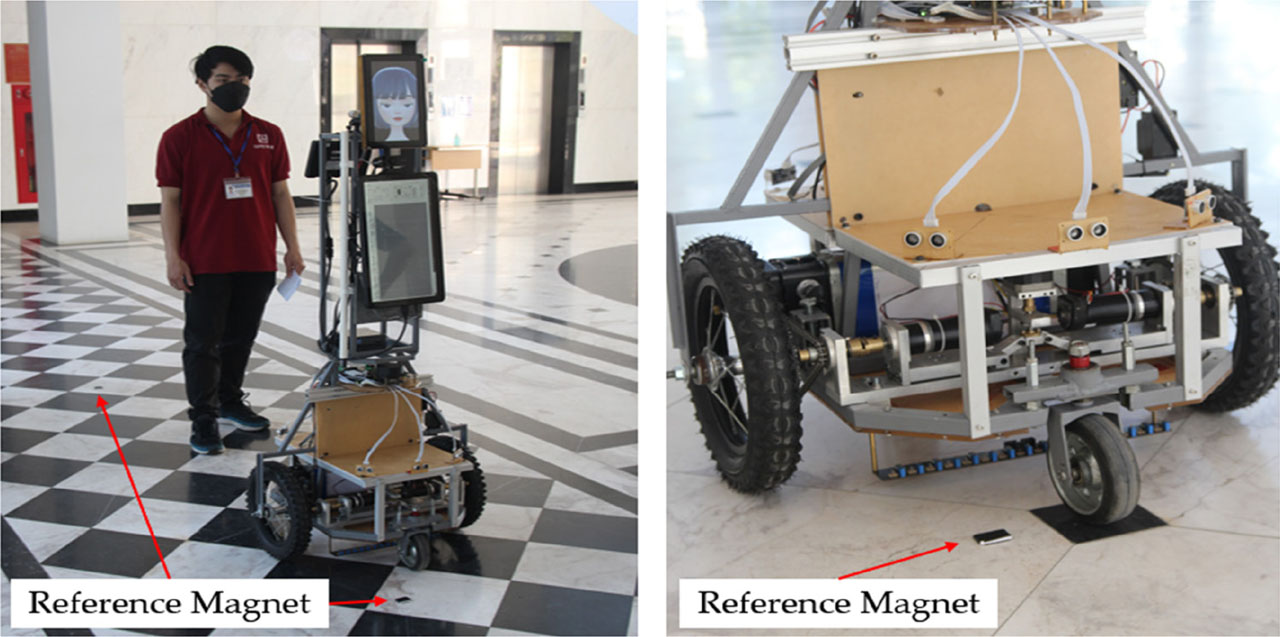
Figure 21
Position of the reference magnets on the floor.
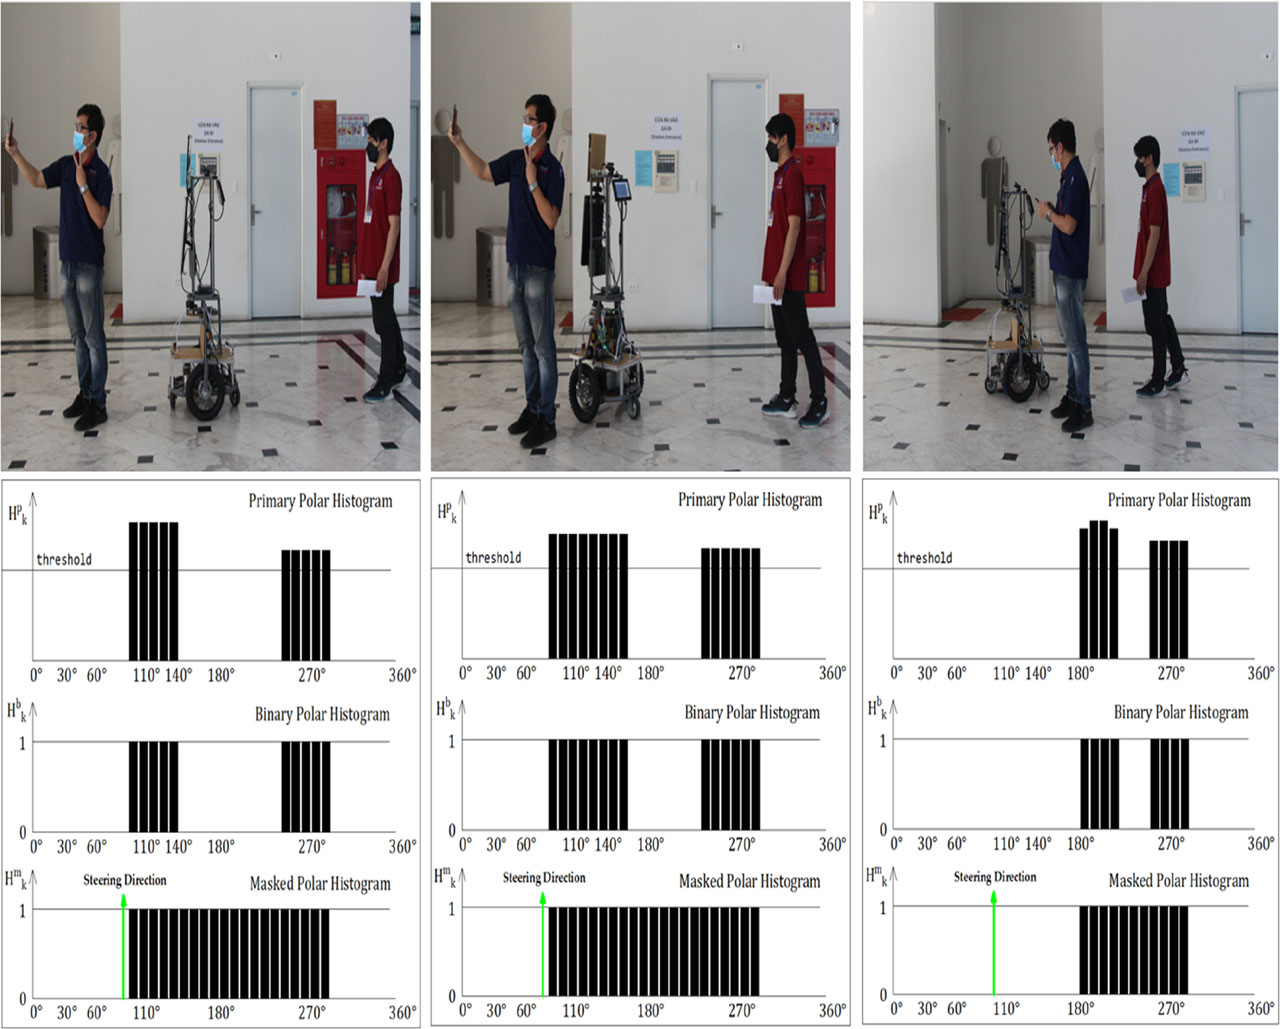
Figure 22
Human avoidance robot process and VFH + polar histograms.