
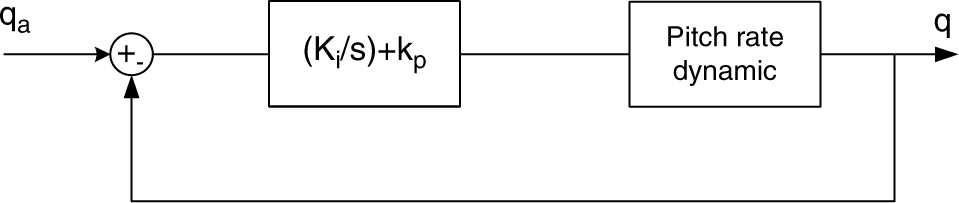
Figure 1
Single rate roll rate autopilot loop.
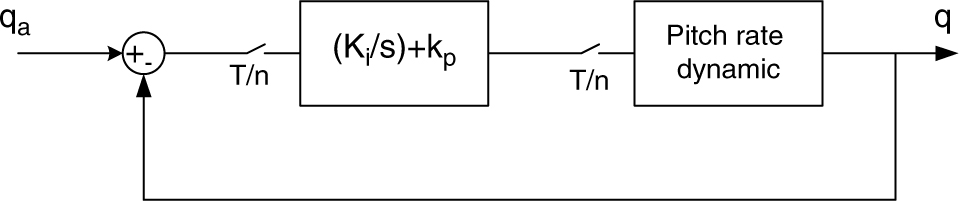
Figure 2
Multirate roll rate autopilot loop.
Table 2
Performance parameters after optimization
| Feedback gain matrix k | Performance value |
|---|---|
| k1 = 7.921 | k1 |
| k2 = 22.432 | |
| k3 = 26.29 | |
| k4 = 28.6301 | |
| 4.69 | JD1 |
| 9.501 | JD2 |
| 1.429 | ‖k‖2 |
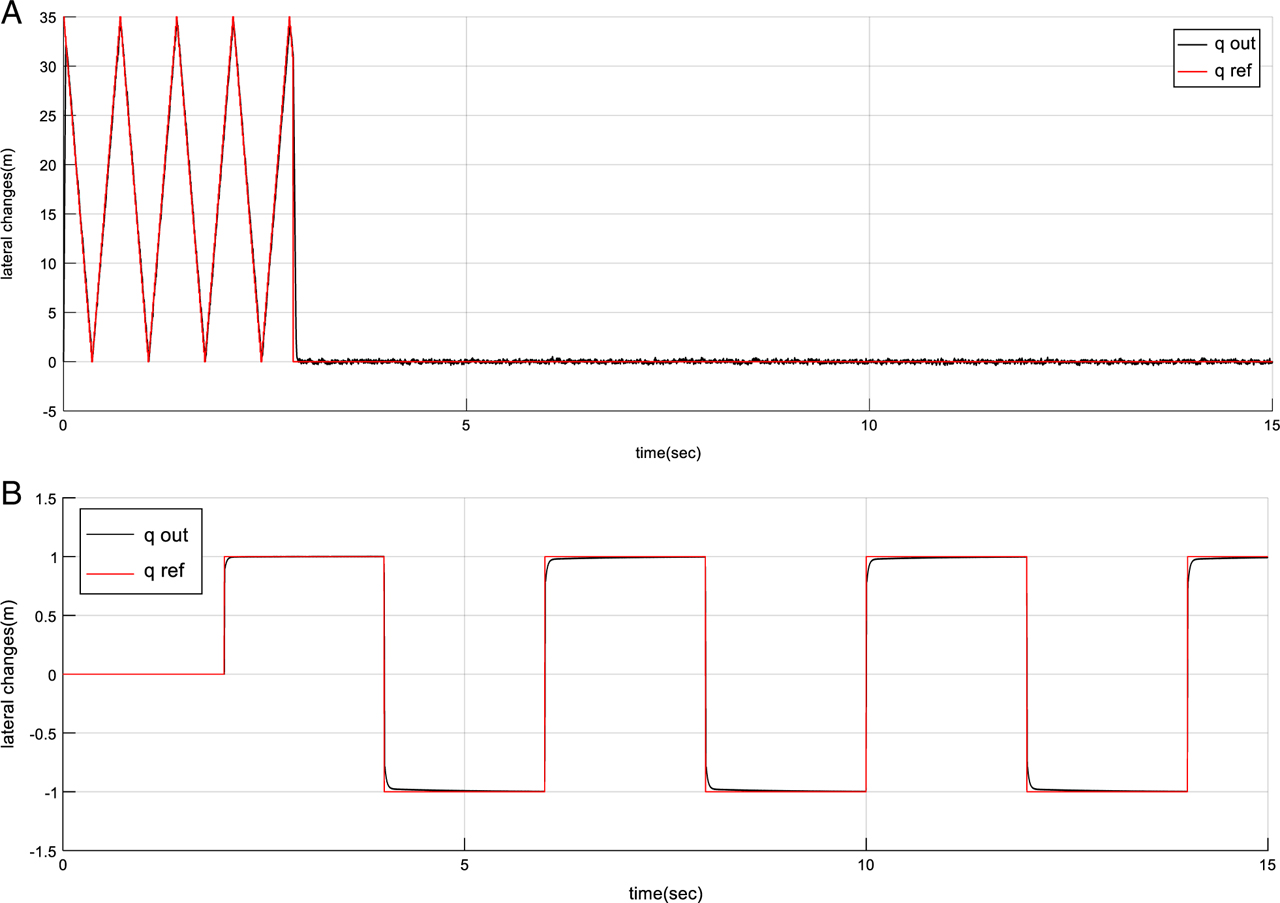
Figure 3
Input tracking by optimally designed output.
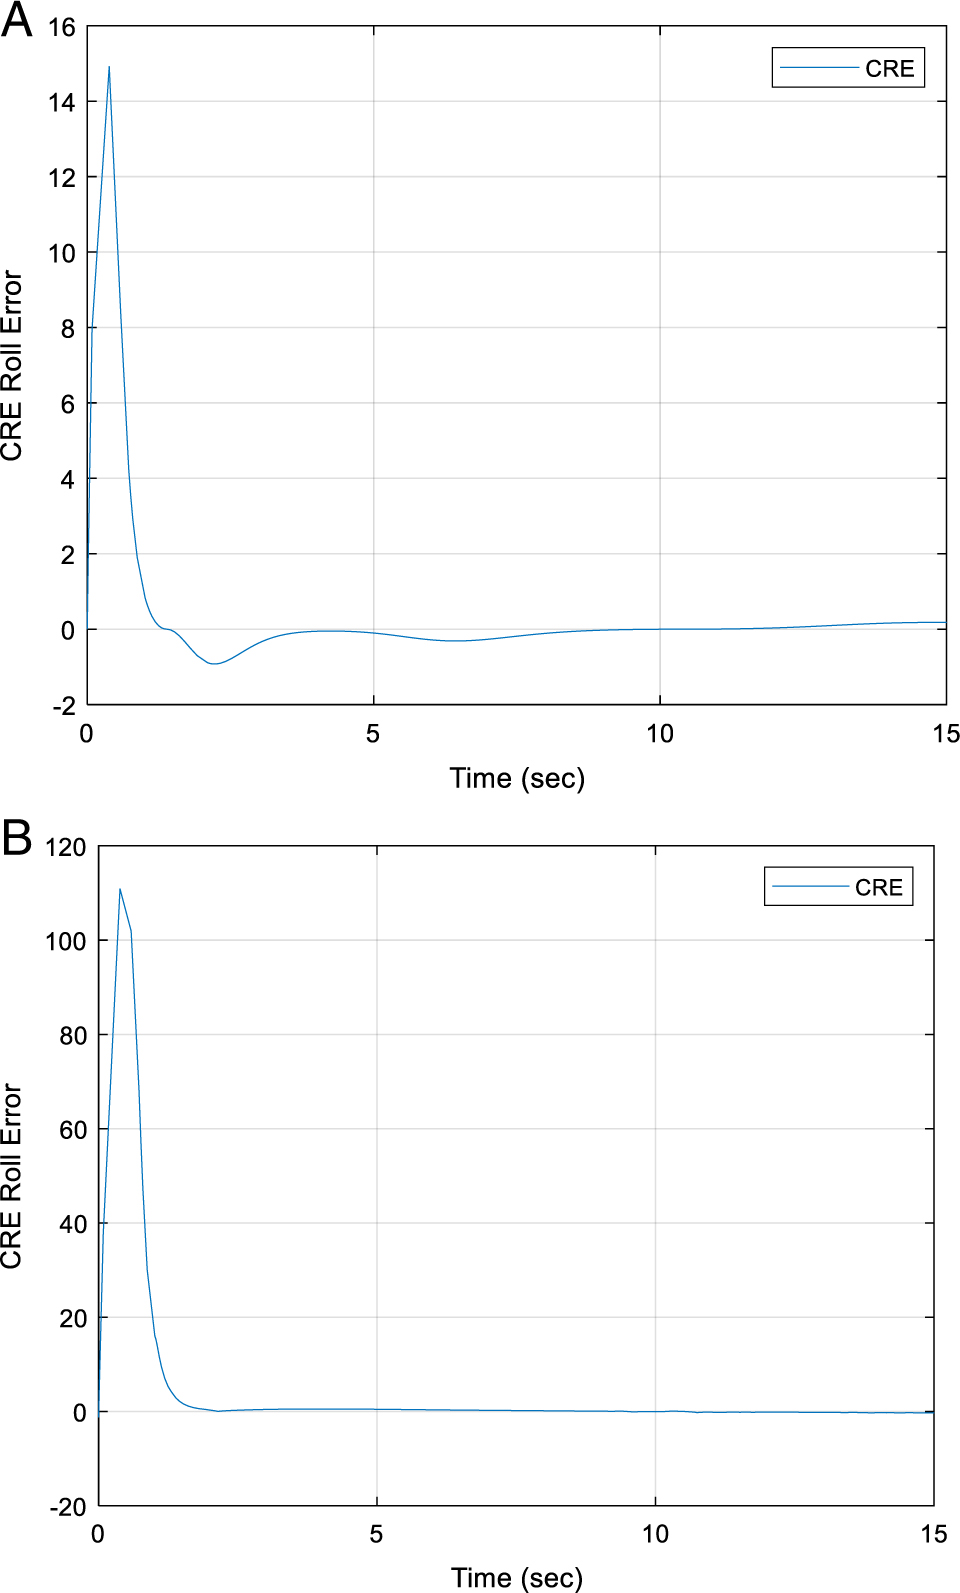
Figure 4
CRE error for inputs shown in Figure 3.