
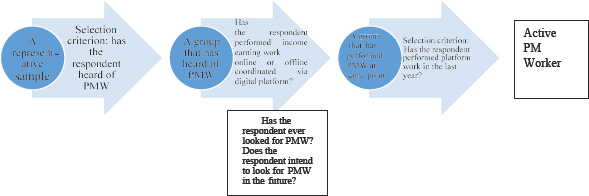
Figure 1.
Mechanism for selecting platform-mediated workers. PMW, platform-mediated work.
Table 1.
Do you sometimes look for paid work coordinated via a digital platform? (N = 2,099—respondents who have heard about the possibility of earning income from PMW)
| Response/socio-demographic characteristic | Total | Gender | Age (years) | Place of residence | ||||||
|---|---|---|---|---|---|---|---|---|---|---|
| Woman | Man | 18–24 | 25–34 | 35–54 | 55–70 | Urb. above 50,000 | Urb. up to 50,000 | Rural | ||
| N = In total (%) | 2,099 100 | 1,070 100 | 1,029 100 | 319 100 | 537 100 | 783 100 | 460 100 | 855 100 | 504 100 | 740 100 |
| Yes, very often | 130 6% | 60 6% | 70 7% | 22 7% | 56 10% | 44 6% | 8 2% | 52 6% | 33 7% | 45 6% |
| Yes, often (a few times a month) | 217 10% | 93 8% | 124 12% | 36 11% | 89 17% | 75 10% | 17 4% | 96 11% | 56 11% | 65 9% |
| Yes, but seldom (no more than once a month) | 271 13% | 129 12% | 142 14% | 55 17% | 73 14% | 109 14% | 34 7% | 113 13% | 77 15% | 81 11% |
| Yes, very seldom (sporadically, less than once a month) | 336 16% | 181 17% | 155 15% | 62 19% | 85 16% | 118 15% | 71 15% | 136 16% | 85 17% | 115 16% |
| No, never | 1,145 55% | 607 57% | 538 52% | 144 45% | 234 44% | 437 55% | 330 72% | 458 54% | 253 50% | 434 59% |
Table 2.
Do you intend to look for income-earning work via a digital platform in the future? (N = 2,099—respondents who have heard about income-earning opportunities of PMW)
| Response/socio-demographic characteristic | Total | Gender | Age (years) | Place of residence | ||||||
|---|---|---|---|---|---|---|---|---|---|---|
| Woman | Man | 18–24 | 25–34 | 35–54 | 55–70 | Urb. above 50,000 | Urb. up to 50,000 | Rural | ||
| N = In total (%) | 2,099 100 | 1,070 100 | 1,029 100 | 319 100 | 537 100 | 783 100 | 460 100 | 855 100 | 504 100 | 740 100 |
| Definitely yes | 355 17% | 174 16% | 181 18% | 55 17% | 107 20% | 157 20% | 36 8% | 140 16% | 96 19% | 119 16% |
| Rather yes | 728 35% | 371 35% | 357 35% | 135 42% | 201 37% | 262 33% | 130 28% | 307 36% | 173 34% | 248 34% |
| Difficult to say | 706 34% | 379 35% | 327 32% | 94 29% | 160 30% | 281 36% | 171 37% | 275 32% | 171 34% | 260 35% |
| Rather not | 216 10% | 105 10% | 111 11% | 29 9% | 49 9% | 55 7% | 83 18% | 95 11% | 44 9% | 77 10% |
| Definitely not | 94 3% | 41 4% | 53 5% | 6 2% | 20 4% | 28 4% | 40 9% | 38 4% | 20 4% | 36 5% |
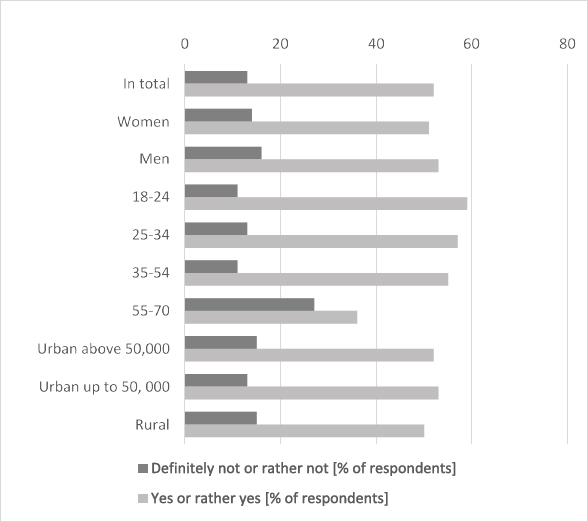
Figure 2.
Do you intend to look for paid income-earning work coordinated via a digital platform in the future? (N = 2,099—respondents who have heard about income-earning opportunities of PMW).
Source: The author’s calculations. PMW, platform-mediated work.
Table 3.
Have you performed income-earning work online or offline coordinated via digital platform? (N = 2,099—respondents who have heard about income-earning opportunities of PMW)
| Response/socio-demographic characteristic | Total | Gender | Age (years) | Place of residence | ||||||
|---|---|---|---|---|---|---|---|---|---|---|
| Woman | Man | 18–24 | 25–34 | 35–54 | 55–70 | Urban above 50,000 | Urban up to 50,000 | Rural | ||
| N = In total (%) | 2,099 100 | 1,070 100 | 1,029 100 | 319 100 | 537 100 | 783 100 | 460 100 | 855 100 | 504 100 | 740 100 |
| Yes, within the last month | 261 12% | 134 13% | 127 12% | 43 13% | 94 18% | 104 13% | 20 4% | 114 13% | 61 12% | 86 12% |
| Yes, but it was over a month ago | 262 12% | 124 12% | 138 13% | 53 17% | 81 15% | 93 12% | 35 8% | 108 13% | 68 13% | 86 12% |
| Yes, but it was over a year ago | 218 10% | 109 10% | 109 11% | 33 10% | 67 12% | 69 9% | 49 11% | 83 10% | 69 14% | 66 9% |
| No | 1,358 65% | 703 66% | 655 64% | 190 60% | 295 55% | 517 66% | 356 77% | 550 64% | 306 61% | 502 68% |
Table 4.
What type of PMW do you perform? (N = 523—respondents who have performed PMW at the latest within the last year)
| Response/socio-demographic characteristic | Total | Gender | Age (years) | Place of residence | ||||||
|---|---|---|---|---|---|---|---|---|---|---|
| Woman | Man | 18–24 | 25–34 | 35–54 | 55–70 | Urban above 50,000 | Urban up to 50,000 | Rural | ||
| N = | 523 | 258 | 265 | 96 | 175 | 197 | 55 | 222 | 129 | 172 |
| Online (microtasks, crowdworking) | 242 46% | 121 47% | 121 46% | 51 53% | 92 53% | 78 40% | 21 38% | 99 45% | 51 40% | 92 53% |
| Online – projects | 147 28% | 75 29% | 72 27% | 25 26% | 58 33% | 50 25% | 14 25% | 69 31% | 37 29% | 41 24% |
| Offline – driving | 102 20% | 29 11% | 73 28% | 19 20% | 38 22% | 40 20% | 5 9% | 47 21% | 35 27% | 20 12% |
| Offline – other than driving | 53 10% | 16 6% | 37 14% | 9 9% | 18 10% | 22 11% | 4 7% | 25 11% | 15 12% | 13 8% |
| Online and offline | 68 13% | 36 14% | 32 12% | 11 11% | 26 15% | 20 10% | 11 20% | 32 14% | 14 11% | 22 13% |
| Other | 49 9% | 29 11% | 20 8% | 8 8% | 8 5% | 27 14% | 6 11% | 18 8% | 14 11% | 17 10% |