
| Assets | Liabilities |
|---|---|
| Credit (Household 1) 1,000 | Demand Deposit (Household 1) 900 |
| Minimum reserves 9 | RCK 109 |
| Assets | Liabilities |
|---|---|
| Credit (Household 2) 1,000 | Demand Deposit (Household 2) 900 |
| Minimum Reserves 9 | RCK 109 |
Table 1
Deposits with Bank A or Bank B (figures in €)
| Bank B | |||
|---|---|---|---|
| Active | Passive | ||
| Bank A | Active | 1,000/1,000 | 0/2,000 |
| Passive | 2,000/0 | 1,000/1,000 | |
Table 2
Pay-off matrix for Bank A or Bank B (figures in €)
| Bank B | |||
|---|---|---|---|
| Active | Passive | ||
| Bank A | Active | 0/0 | 0/−10 |
| Passive | −10/0 | −5/−5 | |
Table 3
Deposits with Bank A or Bank B (figures in €)
| Bank B | |||
|---|---|---|---|
| Active | Passive | ||
| Bank A | Active | 1,000/1,000 | 1,000/1,000 |
| Passive | 1,000/1,000 | 1,000/1,000 | |
Table 4
Pay-off matrix for Bank A or Bank B (figures in €)
| Bank B | |||
|---|---|---|---|
| Active | Passive | ||
| Bank A | Active | 0/0 | 0/−5 |
| Passive | −5/0 | −5/−5 | |
Table 5
Asymmetry scenario (figures in €)
| Bank B | |||
|---|---|---|---|
| Active | Passive | ||
| Bank A | Active | 1,500/500 | 0/2,000 |
| (0/0) | (0/−10) | ||
| Passive | 2,000/0 | 1,500/500 | |
| (−10/0) | (−7.5/−2.5) | ||
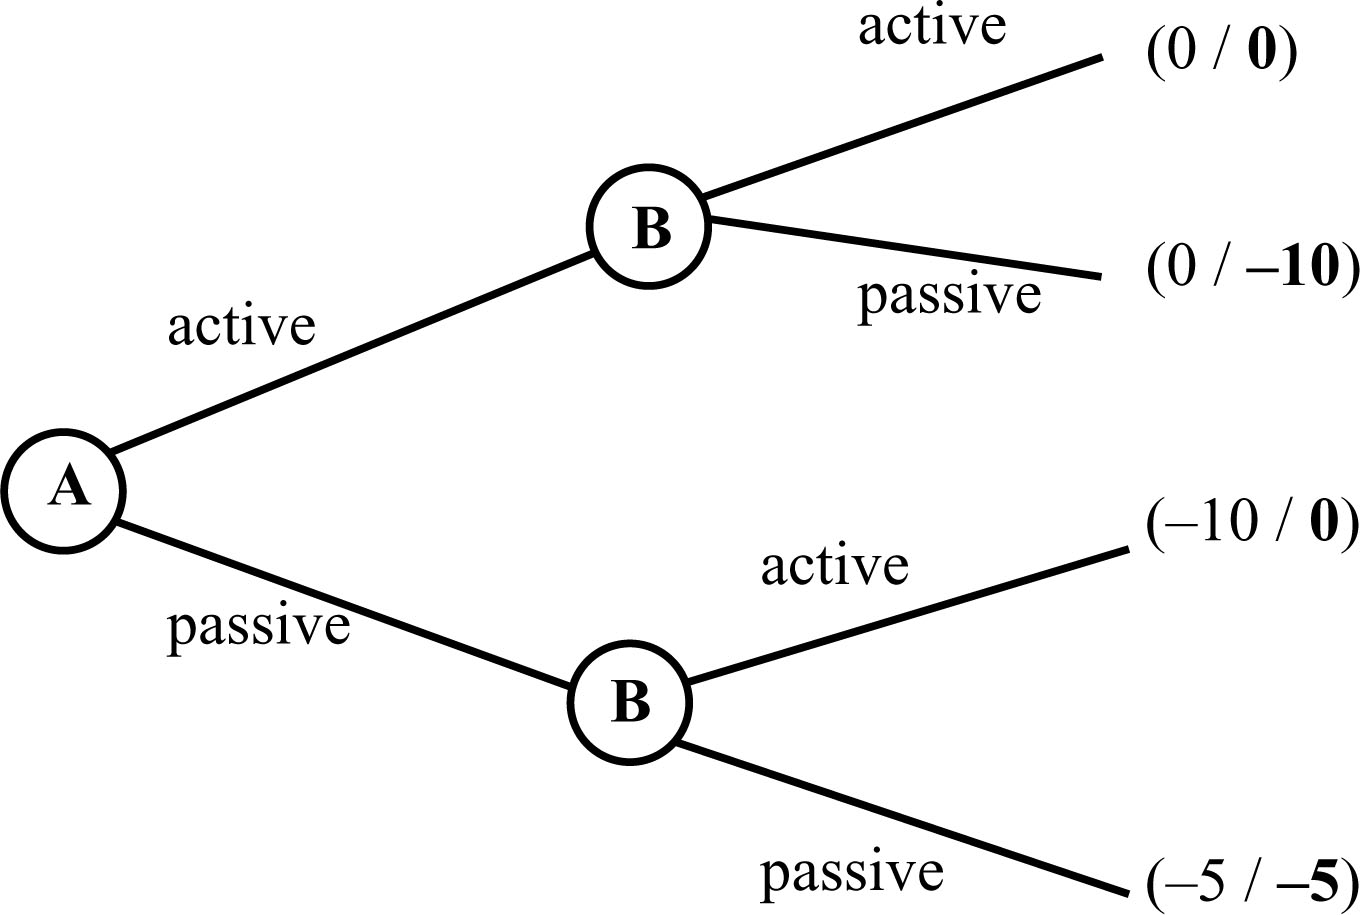
Figure 1
Game tree of a sequential game.