
Table 1
Coefficients of similarity – labor market and industrial relations system (20051)
| Country | Reference country | |||
|---|---|---|---|---|
| Germany | Spain | Sweden | Great Britain | |
| Bulgaria | 72 | 65.2 | 28.3 | 66.5 |
| Croatia | 87.6 | 56.7 | 41.4 | 69.3 |
| Czech Republic | 87.6 | 60.1 | 48.1 | 81.7 |
| Estonia | 76.4 | 50.4 | 38.6 | 81.6 |
| Hungary | 71.7 | 61.4 | 24.9 | 69.1 |
| Latvia | 78.2 | 45.1 | 37.9 | 73.4 |
| Lithuania | 74.0 | 46.2 | 37.1 | 76.5 |
| Poland | 60.2 | 63.5 | 22.5 | 50.9 |
| Romania | 59.2 | 54.2 | 39.7 | 51.1 |
| Slovakia | 74.6 | 66.3 | 30.1 | 70.9 |
| Slovenia | 65.1 | 60 | 45.9 | 52.7 |
Table 2
Coefficients of similarity – industrial relations system (2014)
| Country | Reference country | |||
|---|---|---|---|---|
| Germany | Spain | Sweden | Great Britain | |
| Bulgaria | 63.6 | 57.8 | 22.8 | 70 |
| Croatia | 64.8 | 67.4 | 36.6 | 51.7 |
| Czech Republic | 85.9 | 47.2 | 46 | 78.4 |
| Estonia | 77.5 | 29.6 | 36.1 | 81.6 |
| Hungary | 64.9 | 57.5 | 27.7 | 63.4 |
| Latvia | 63.7 | 39.2 | 23.2 | 67.9 |
| Lithuania | 62.9 | 36.3 | 23.6 | 67.1 |
| Poland | 65.6 | 49.5 | 29.8 | 60.5 |
| Romania | 64.1 | 48.3 | 20.8 | 66.9 |
| Slovakia | 65.3 | 56.4 | 24.3 | 67.4 |
| Slovenia | 71.8 | 70.0 | 41.3 | 58.3 |
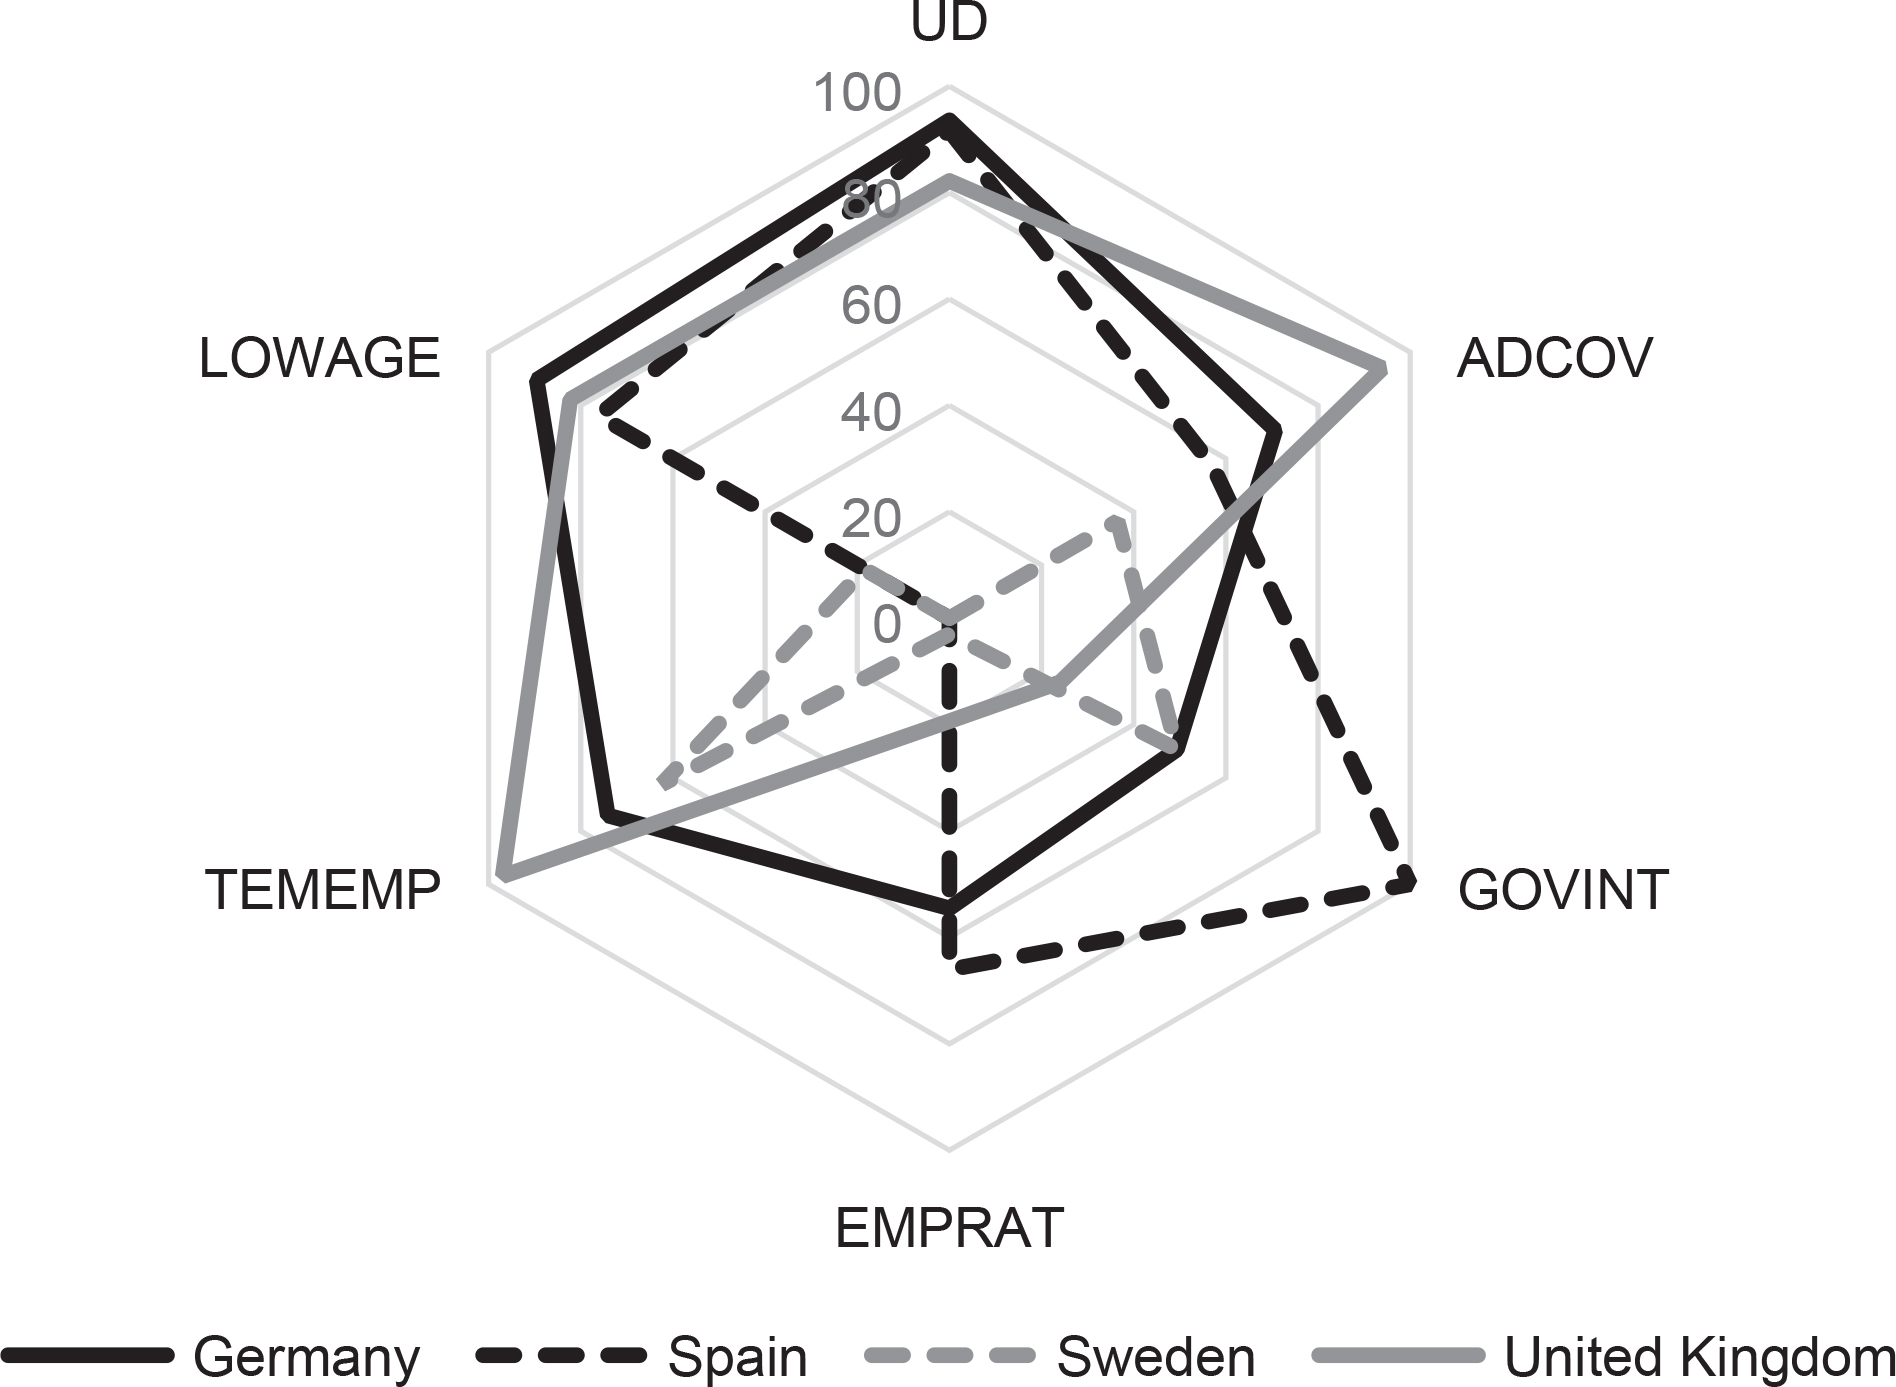
Figure A1
The hexagon of similarities for Bulgaria (2005).
Source: own elaboration.
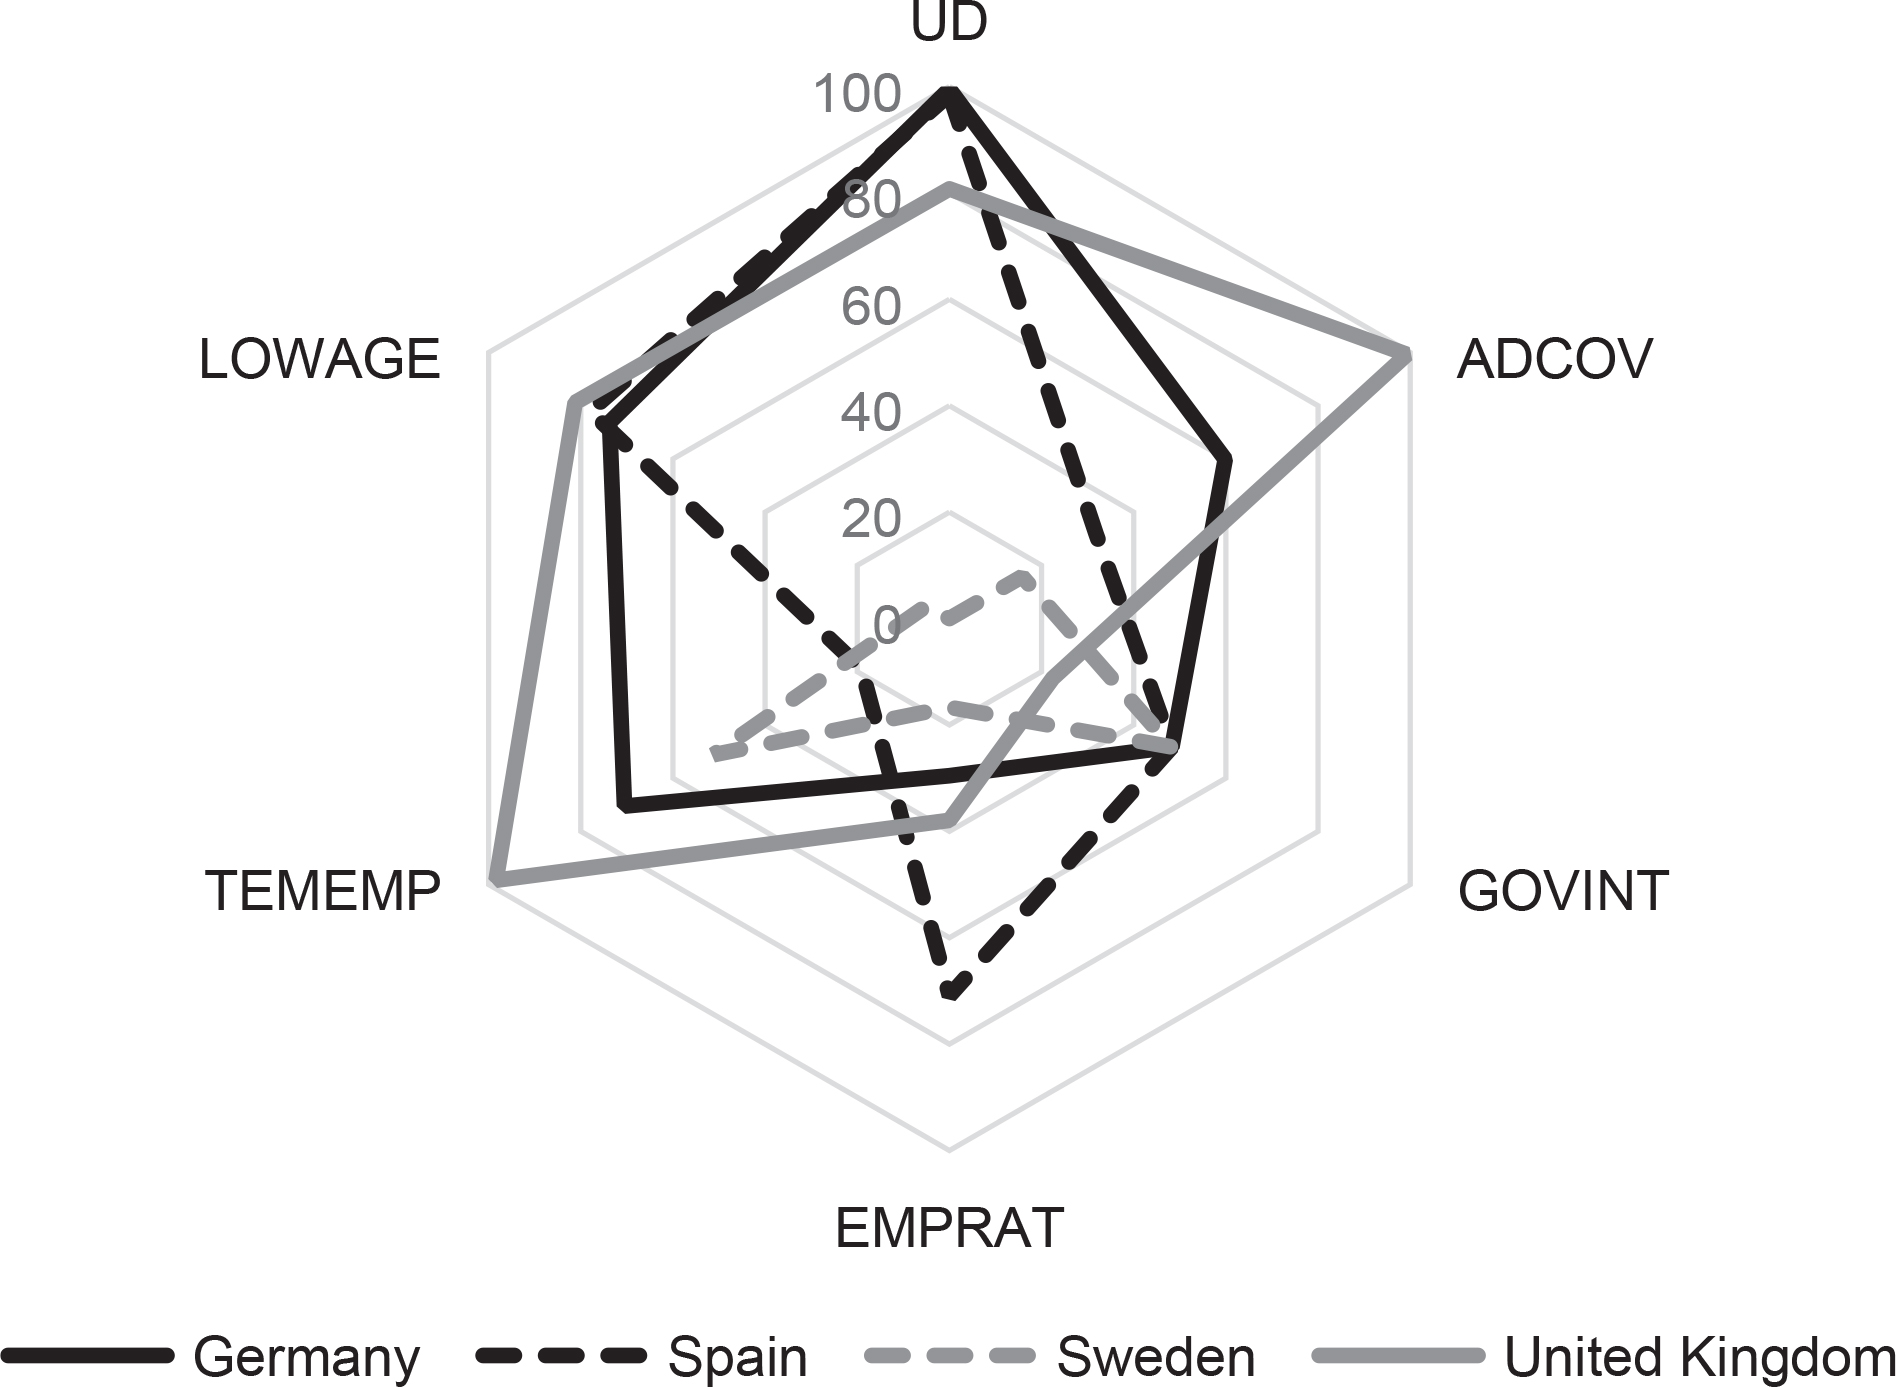
Figure A2
The hexagon of similarities for Bulgaria (2014).
Source: own elaboration.
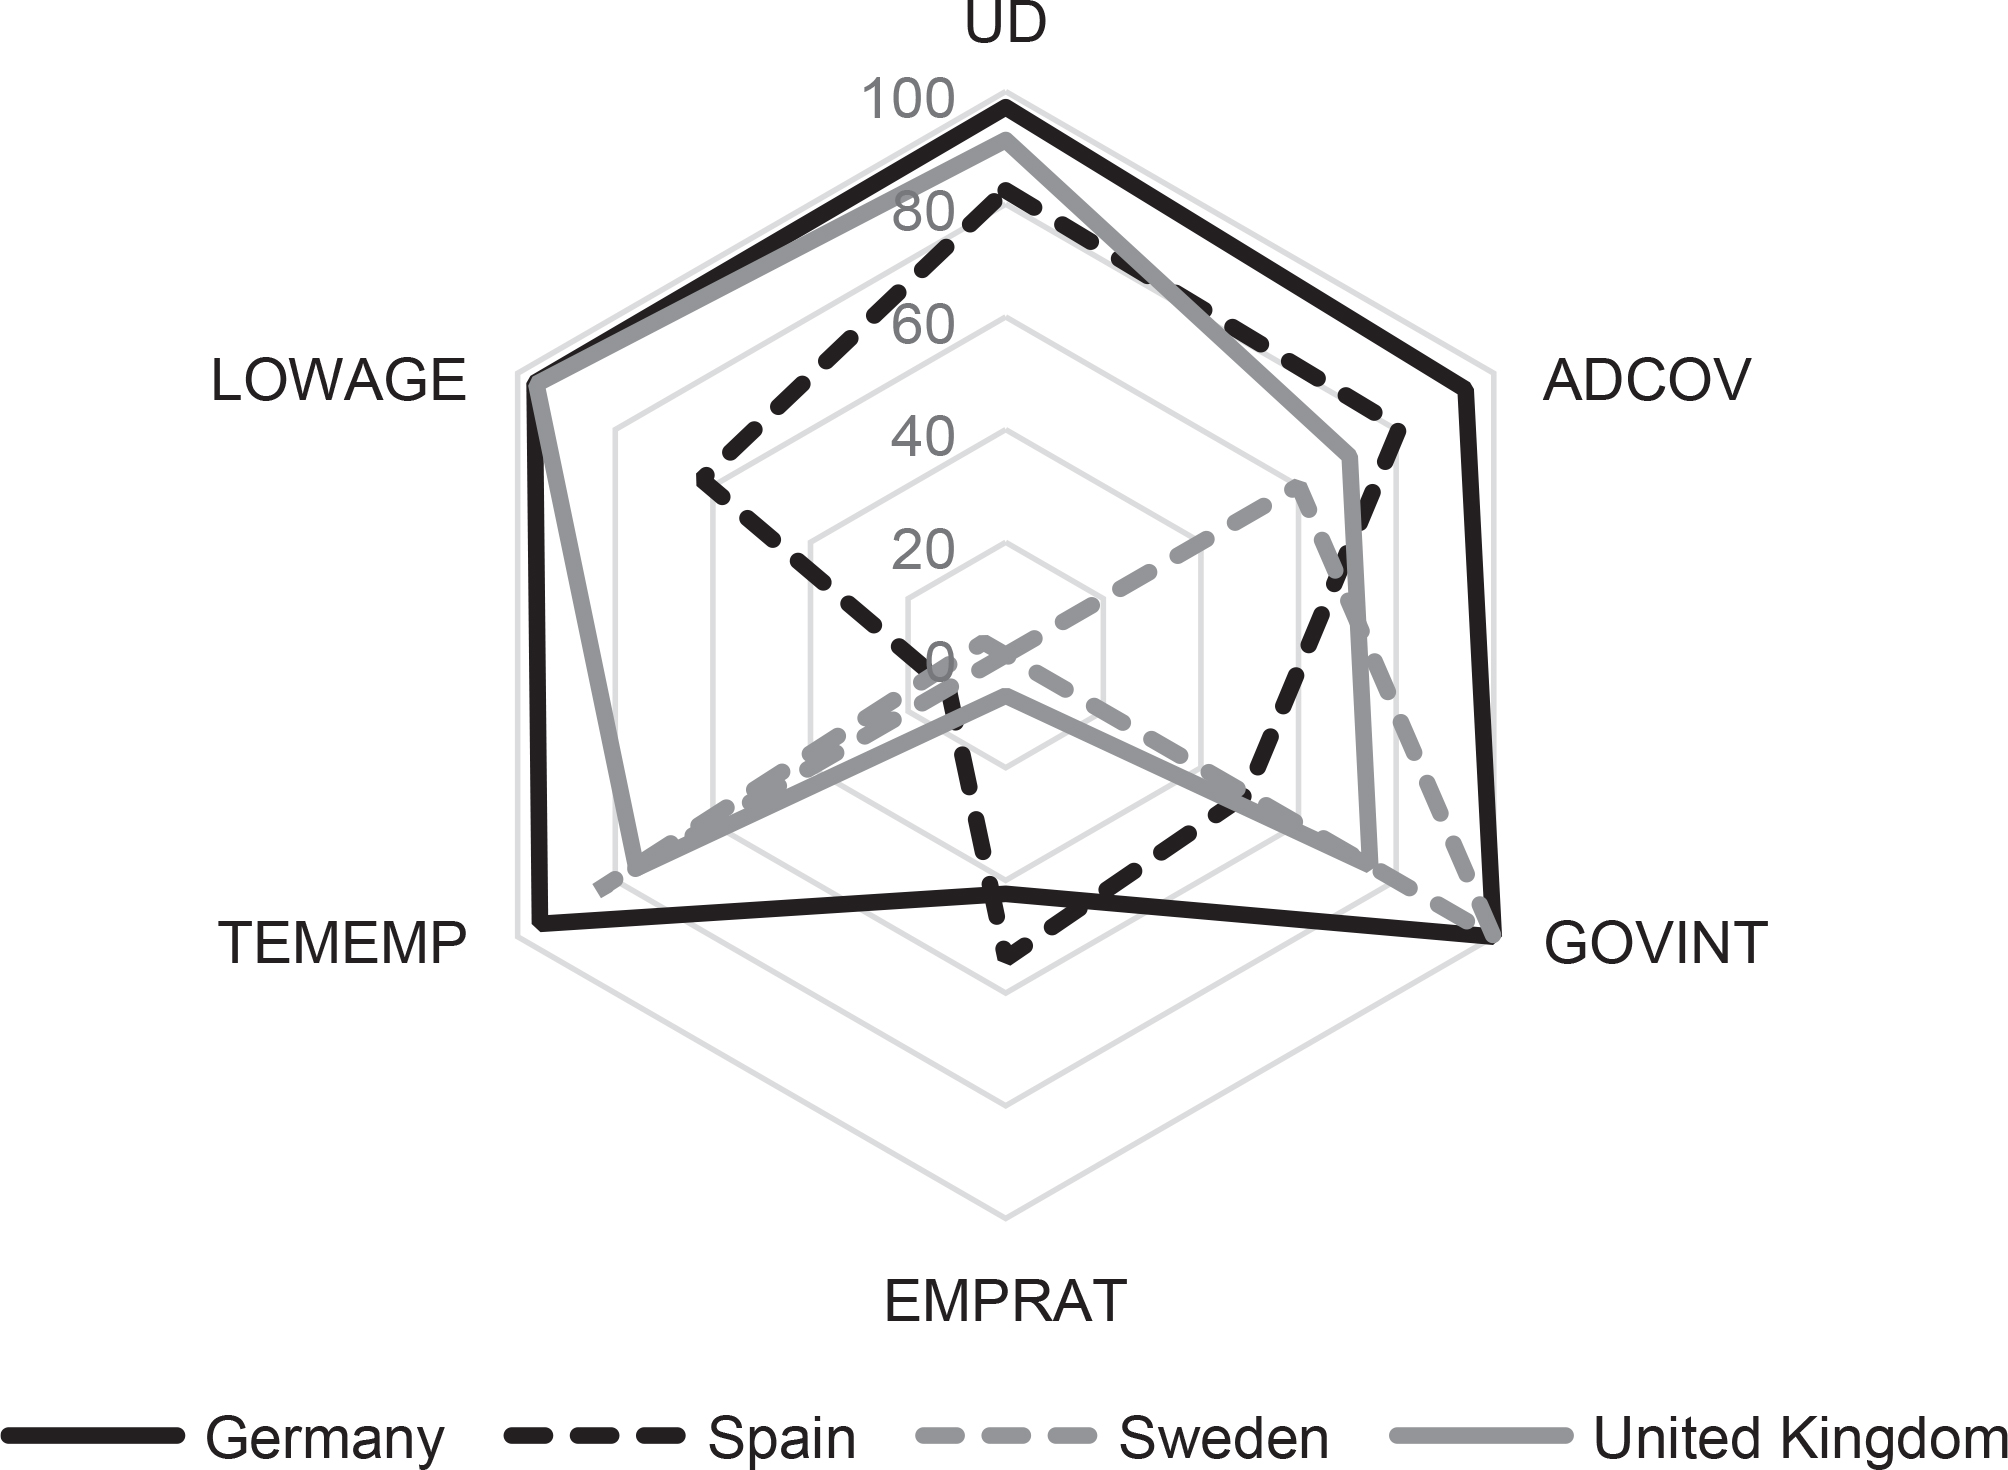
Figure A3
The hexagon of similarities for Croatia (2005).
Source: own elaboration.
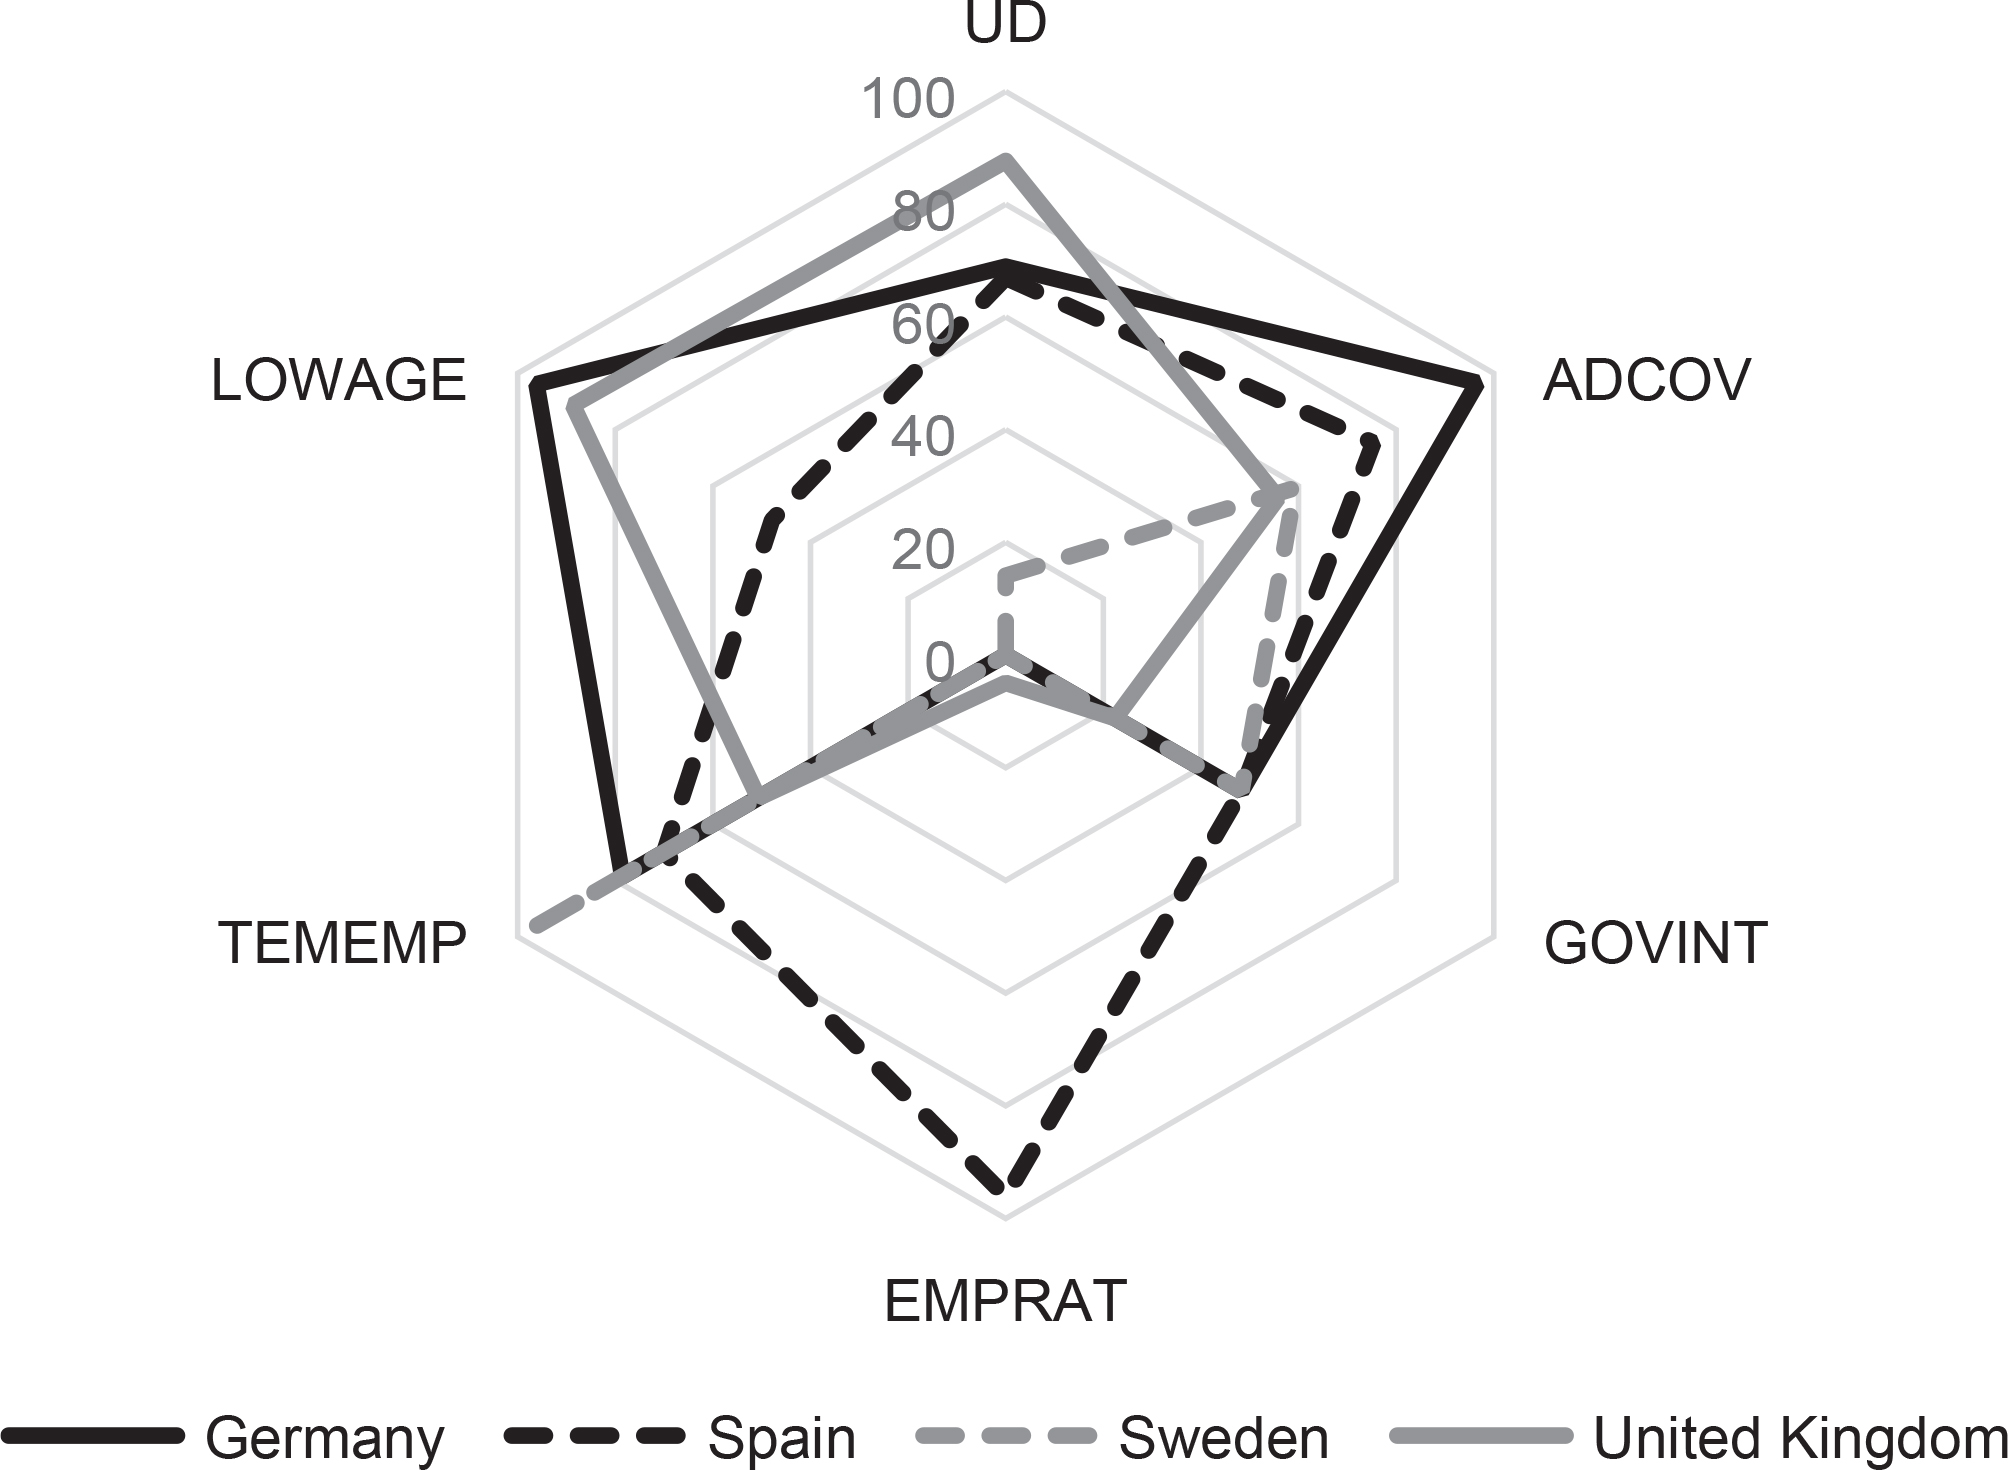
Figure A4
The hexagon of similarities for Croatia (2014).
Source: own elaboration.
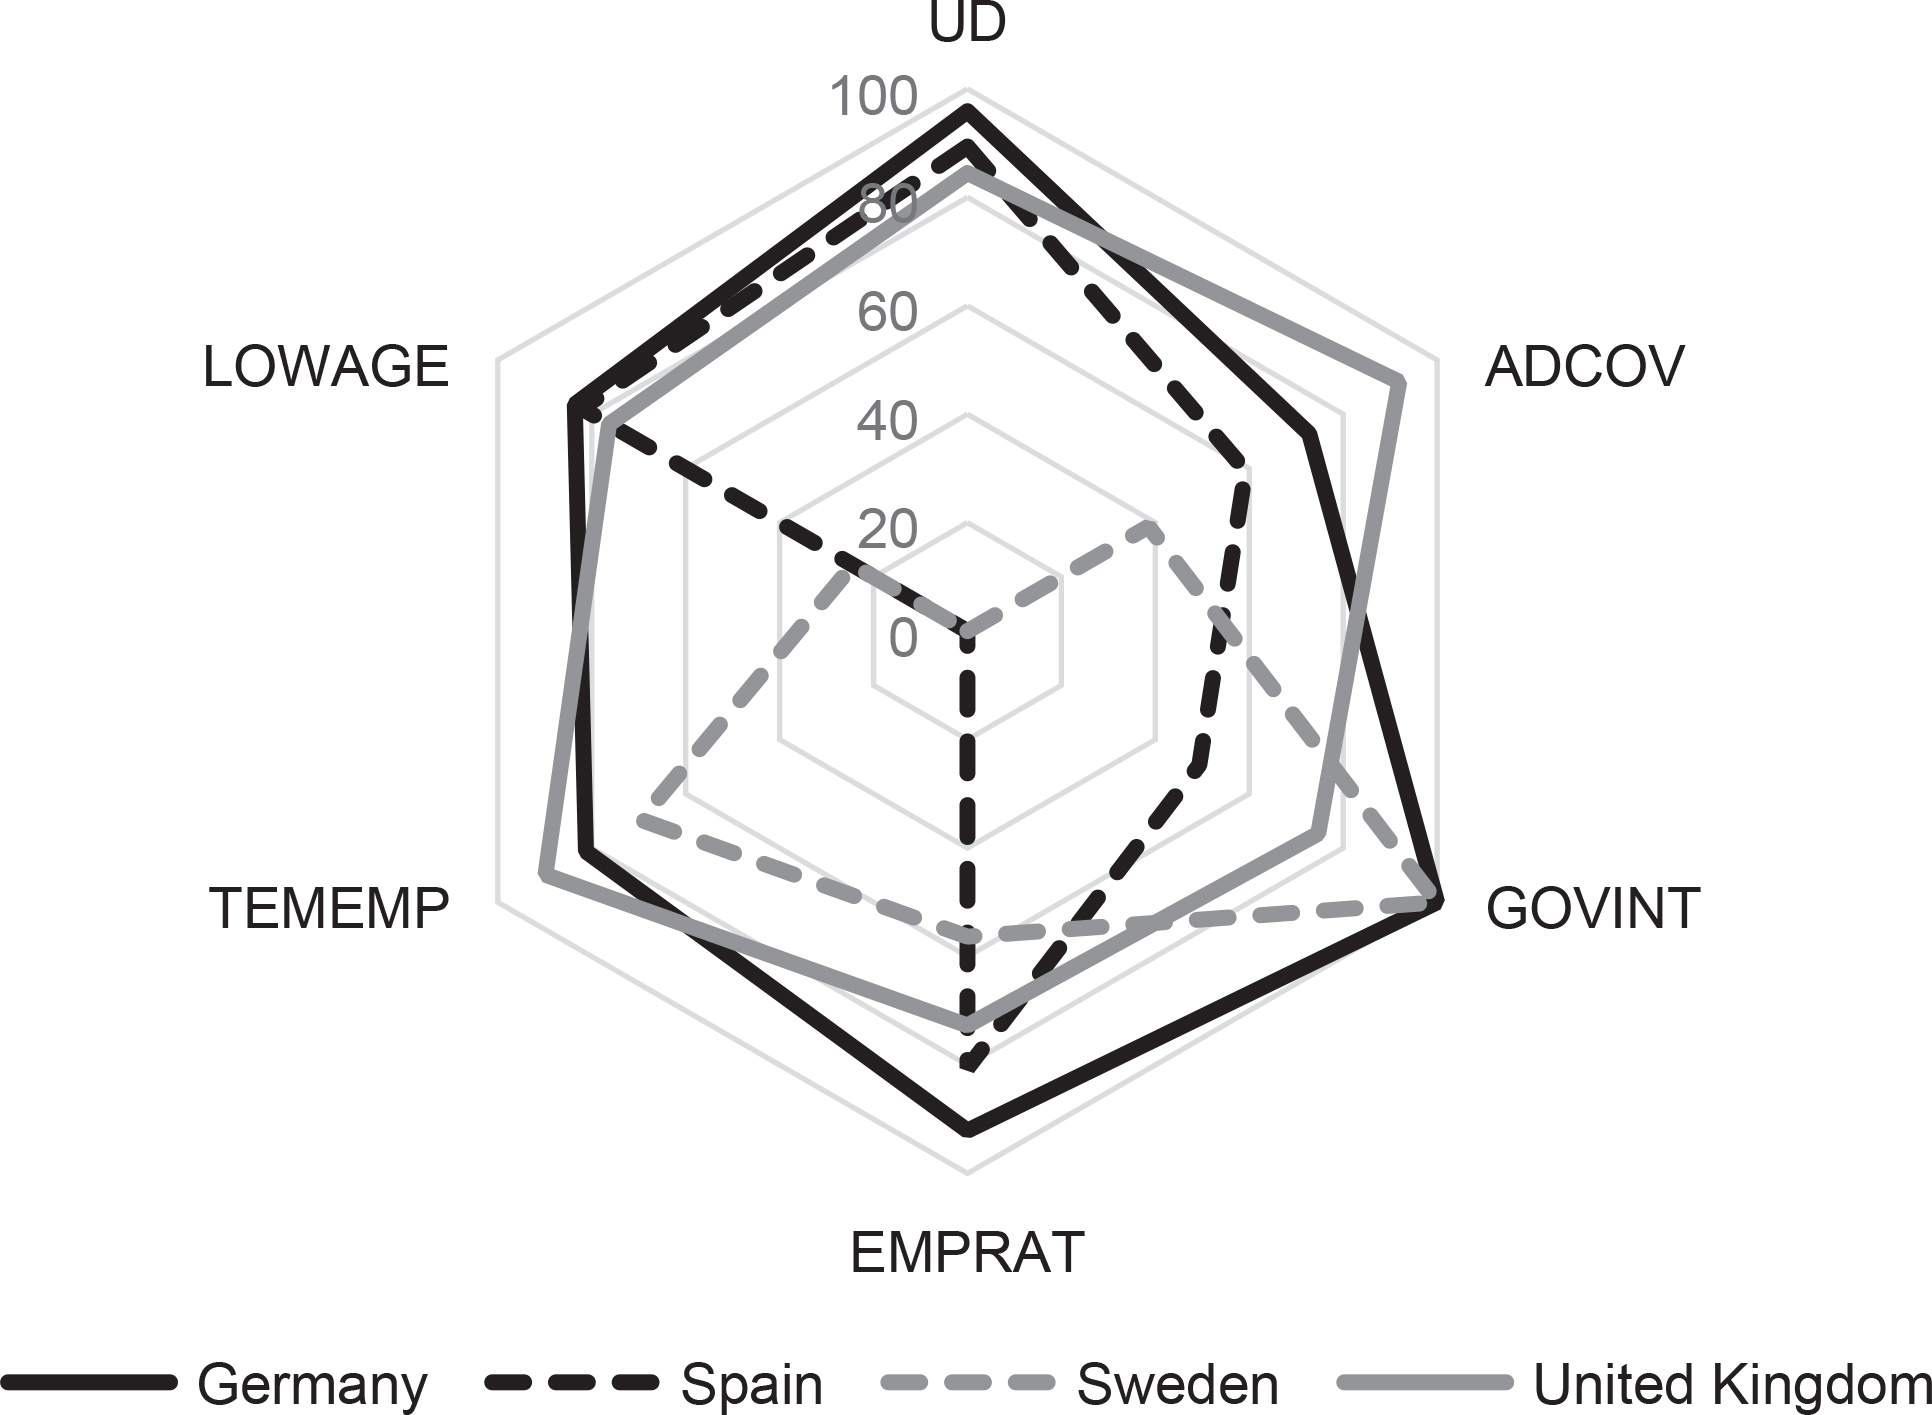
Figure A5
The hexagon of similarities for Czech Republic (2005).
Source: own elaboration.
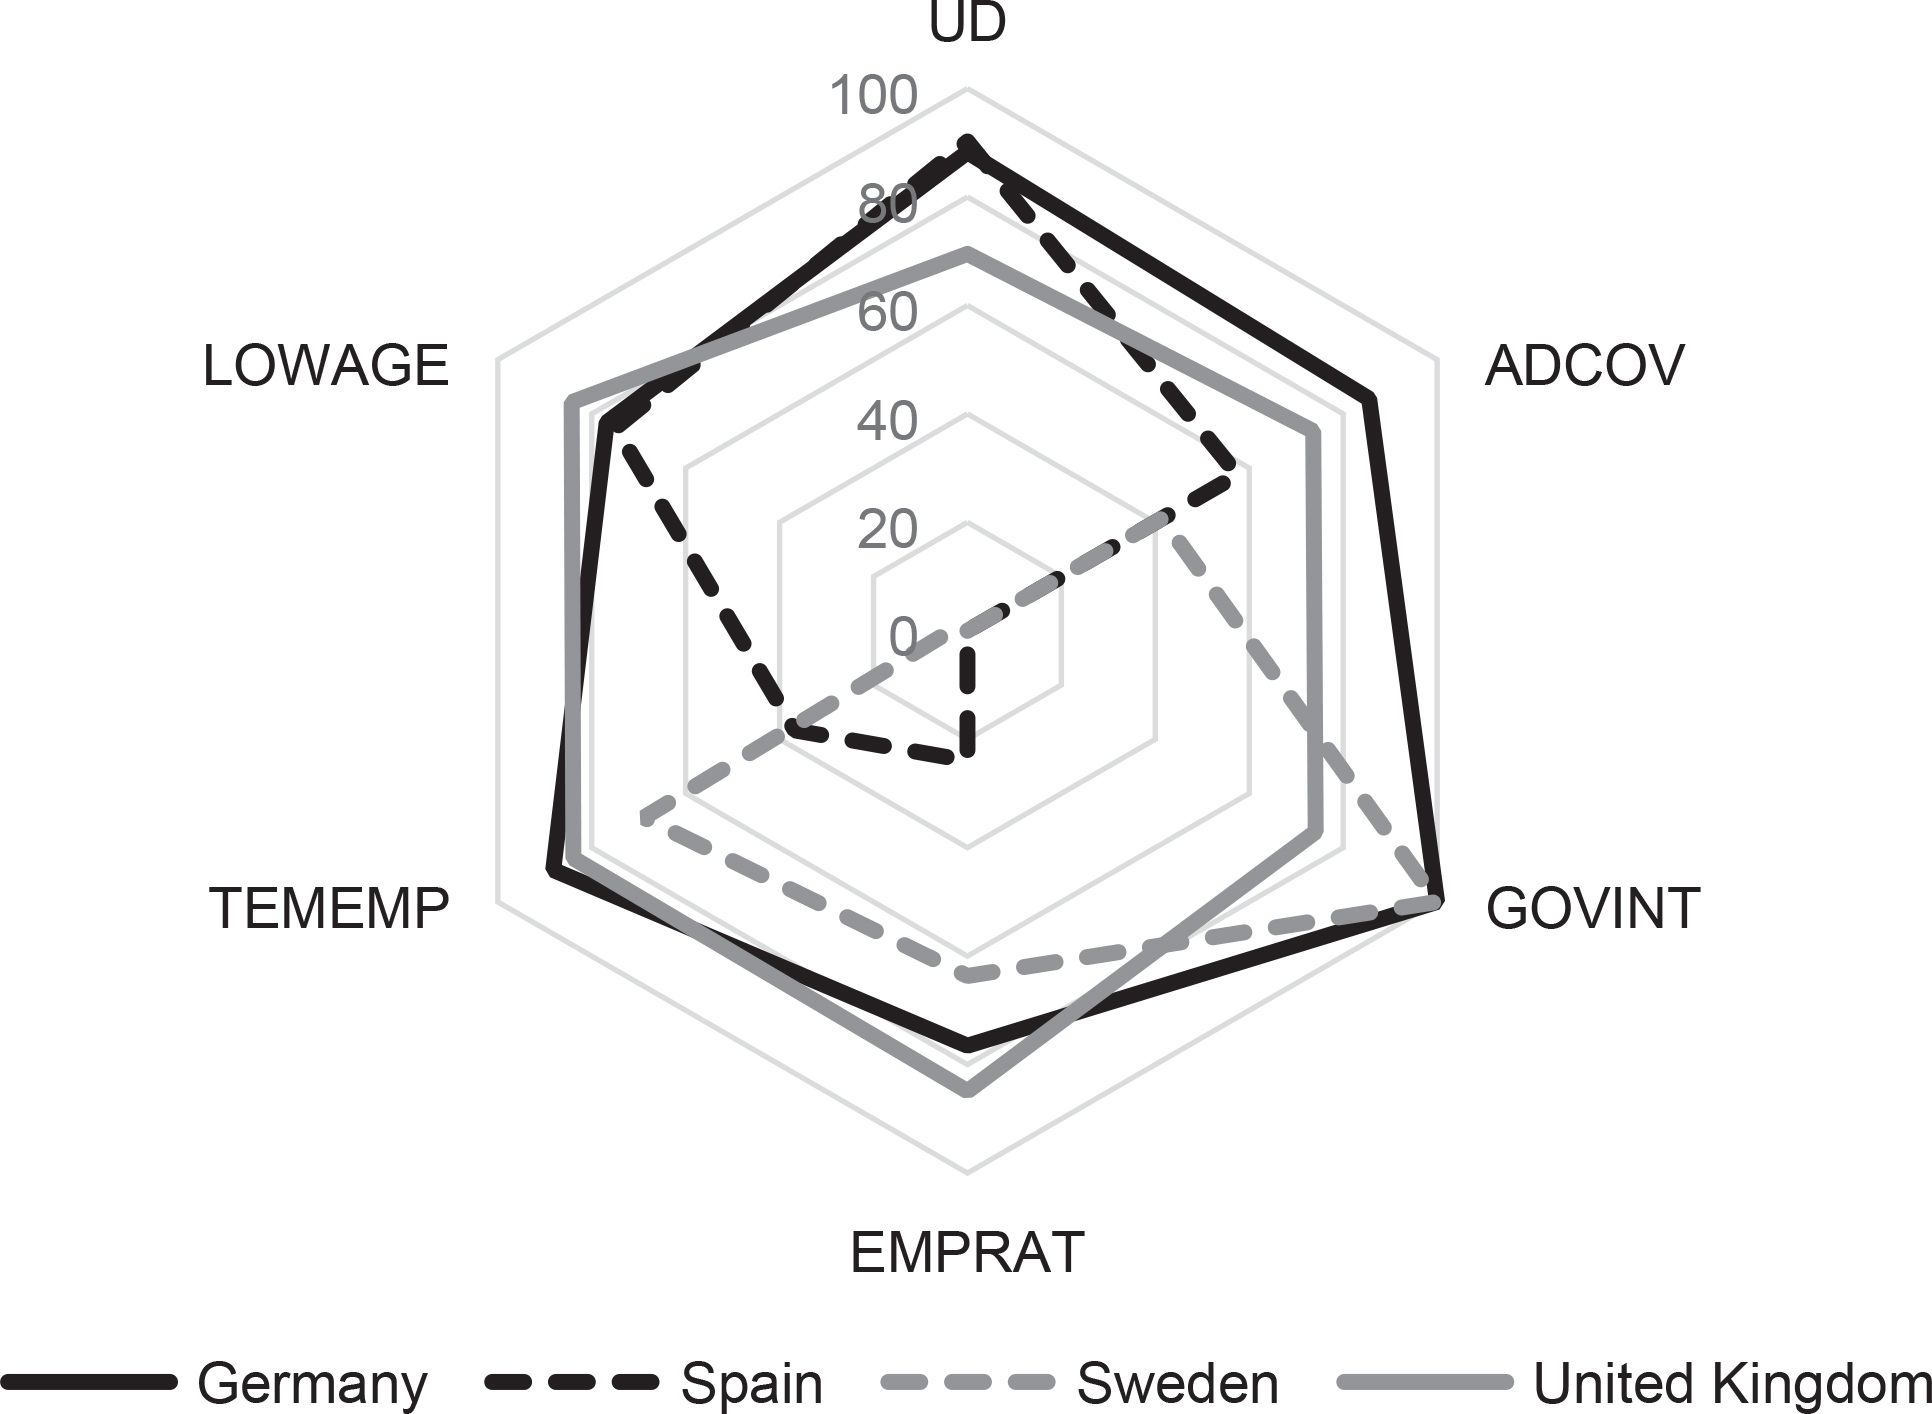
Figure A6
The hexagon of similarities for Czech Republic (2014).
Source: own elaboration.
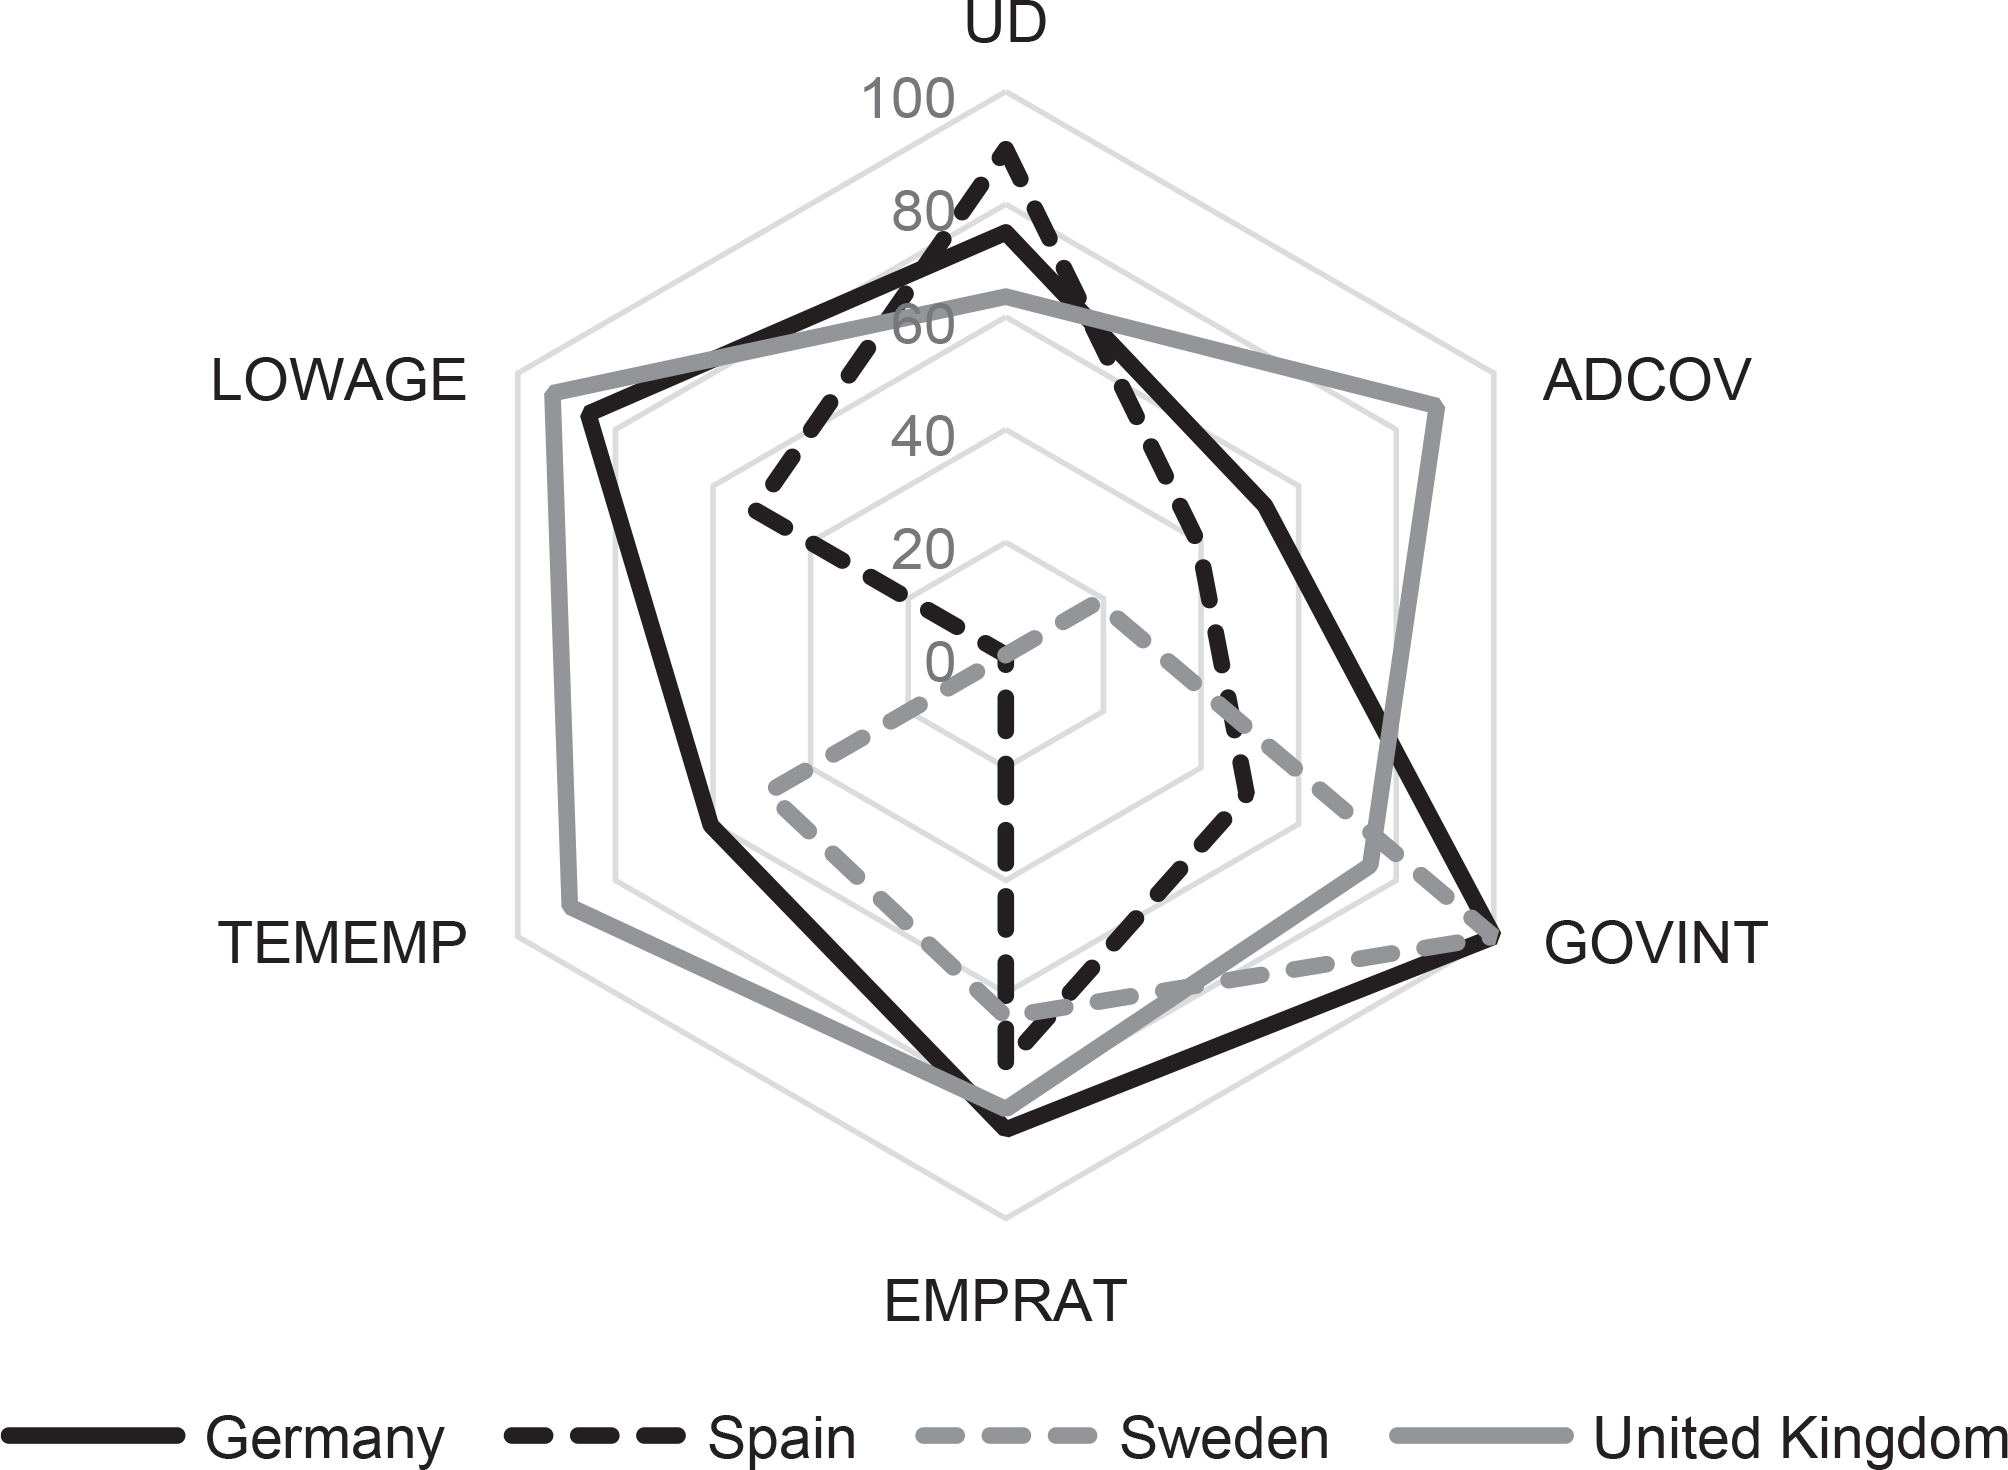
Figure A7
The hexagon of similarities for Estonia (2005).
Source: own elaboration.
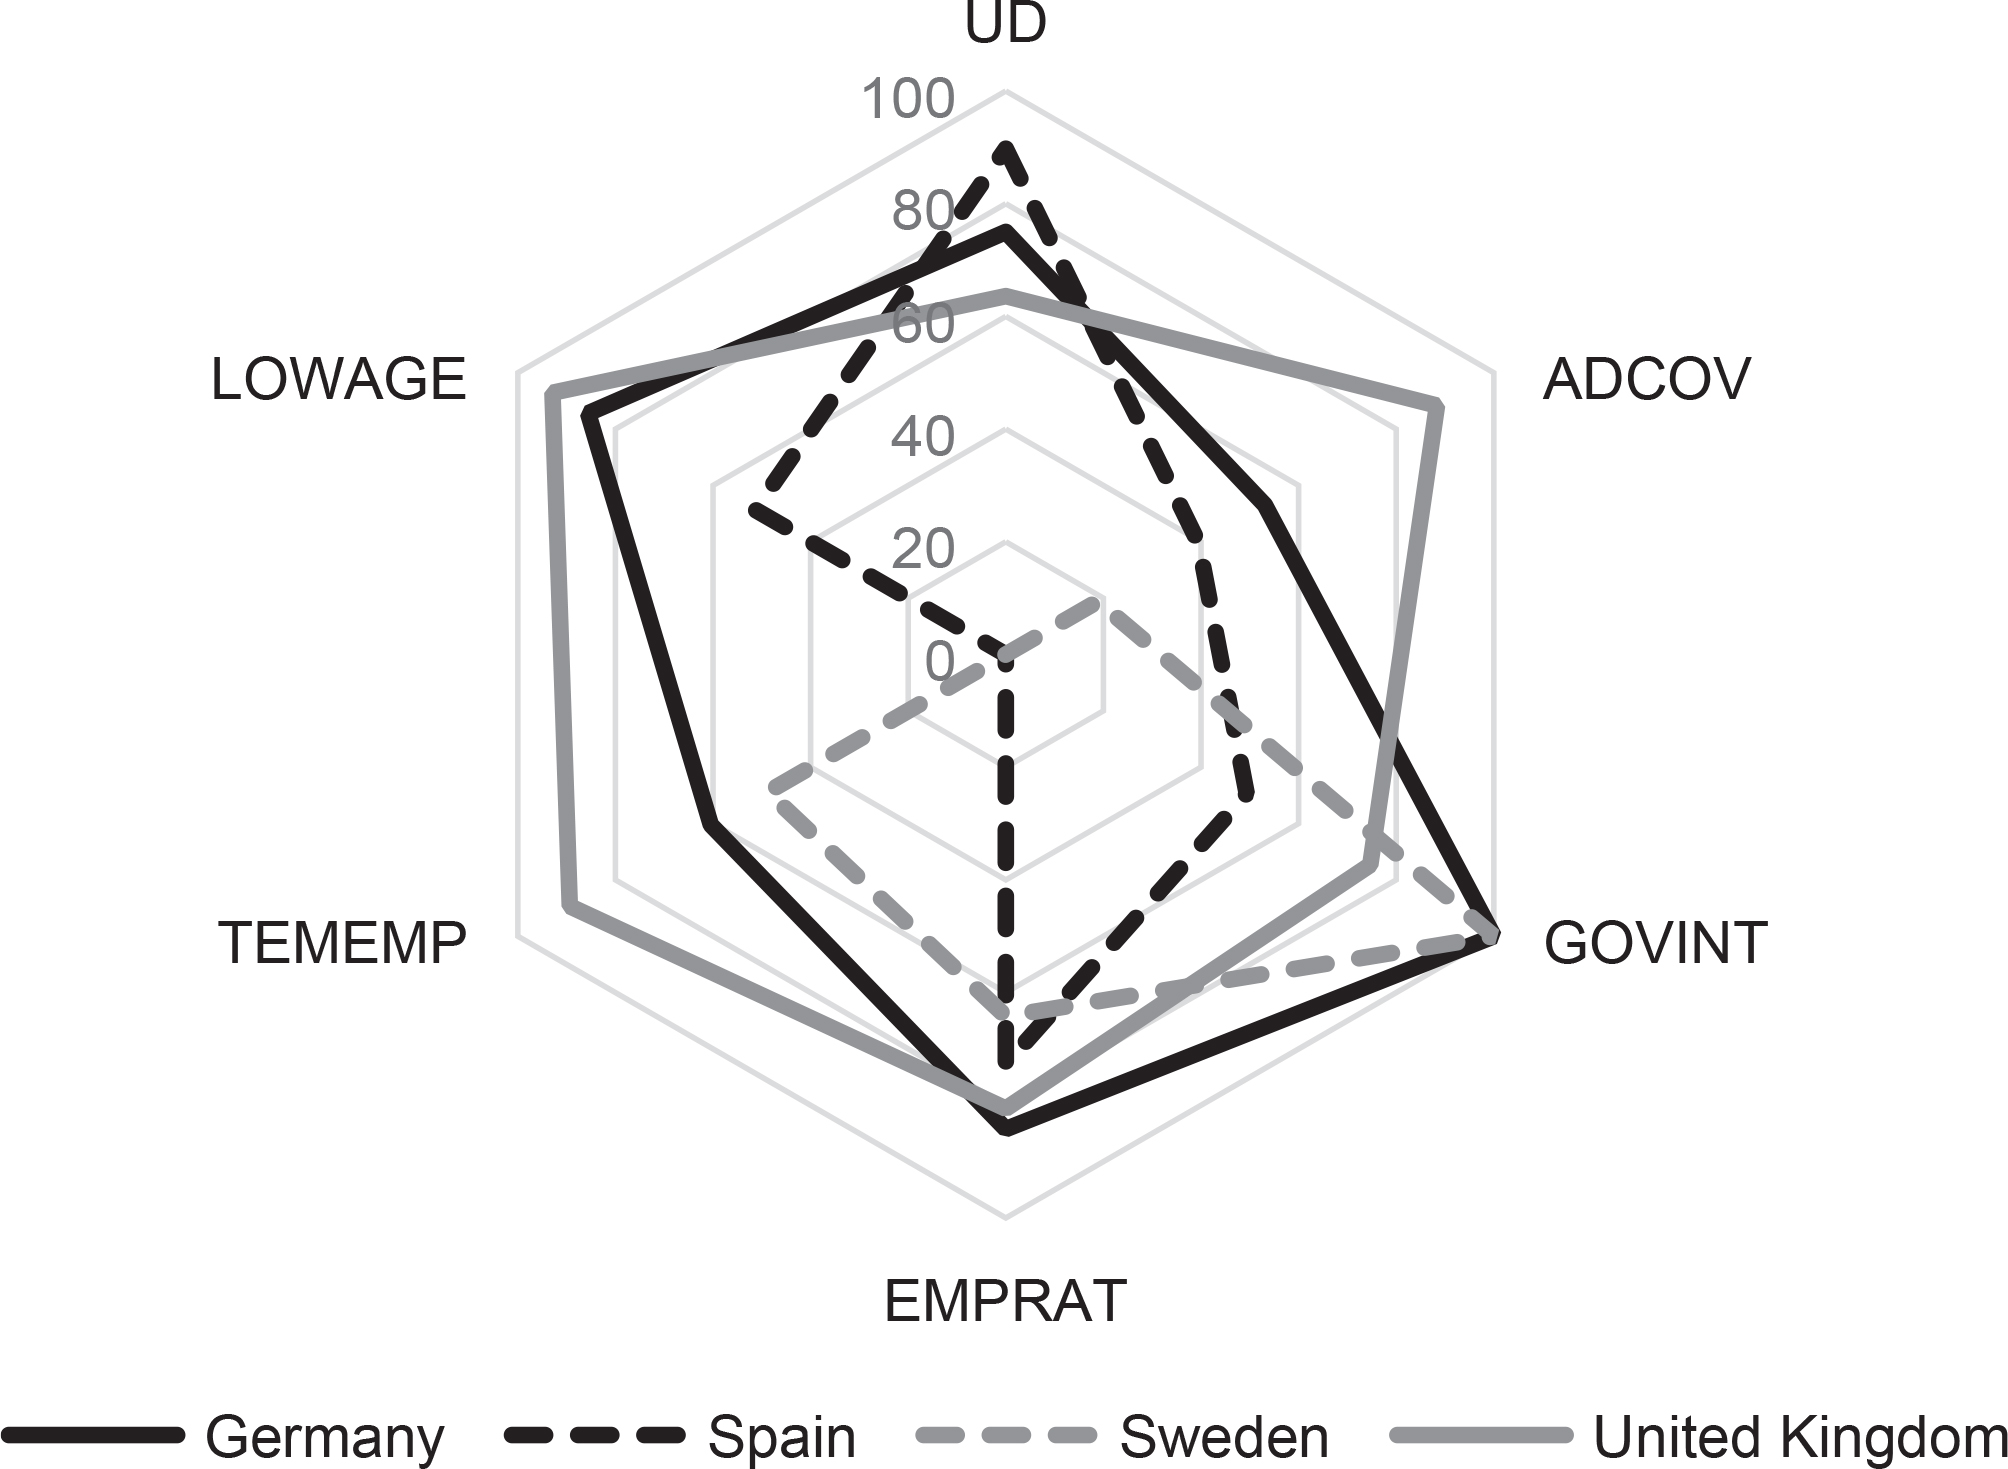
Figure A8
The hexagon of similarities for Estonia (2014).
Source: own elaboration.
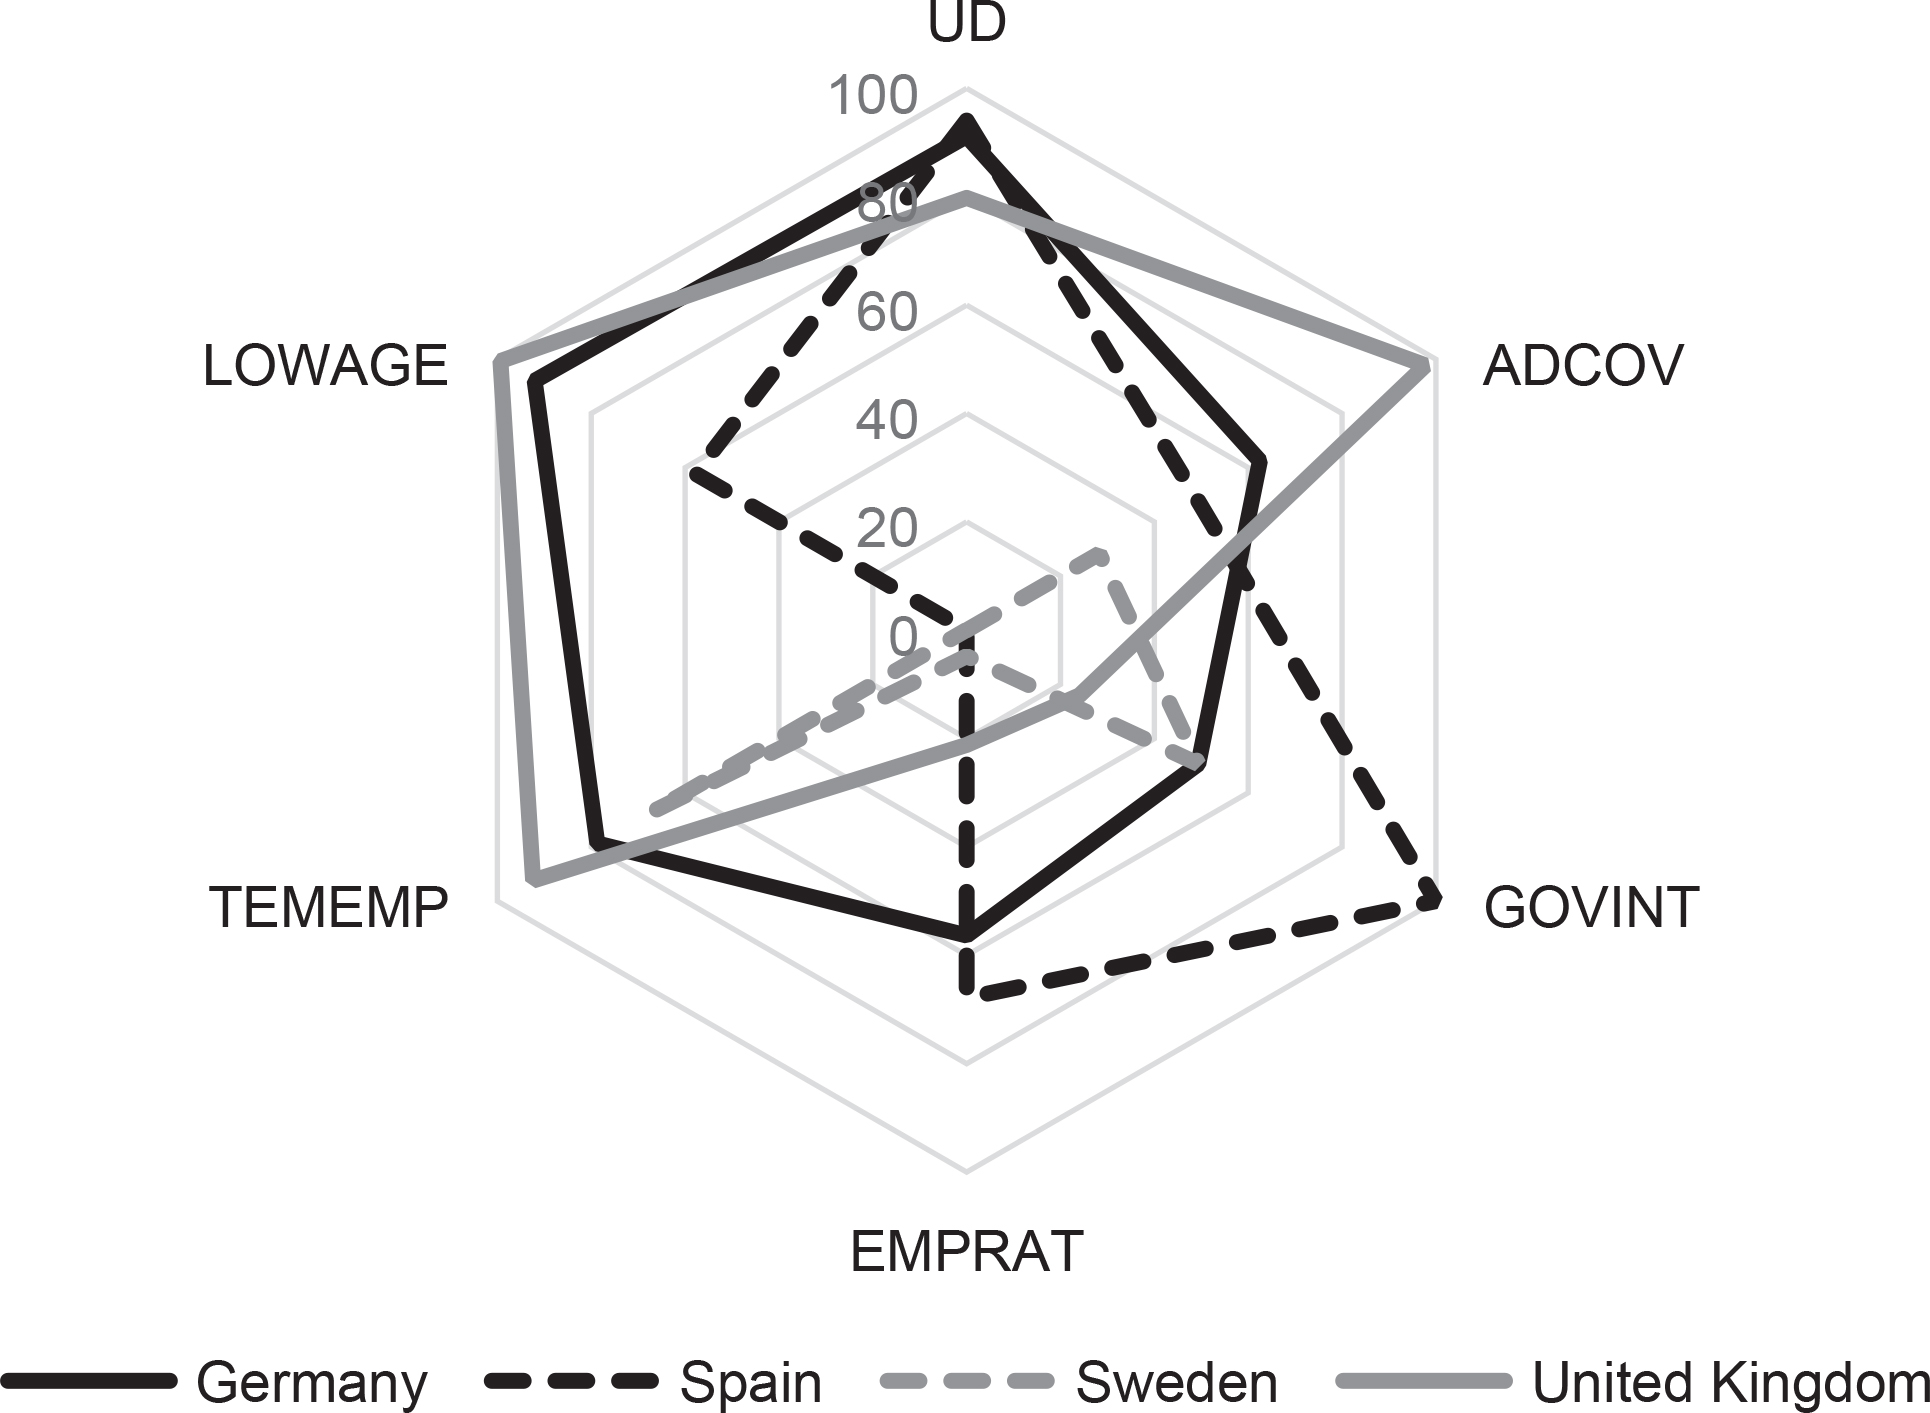
Figure A9
The hexagon of similarities for Hungary (2005).
Source: own elaboration.
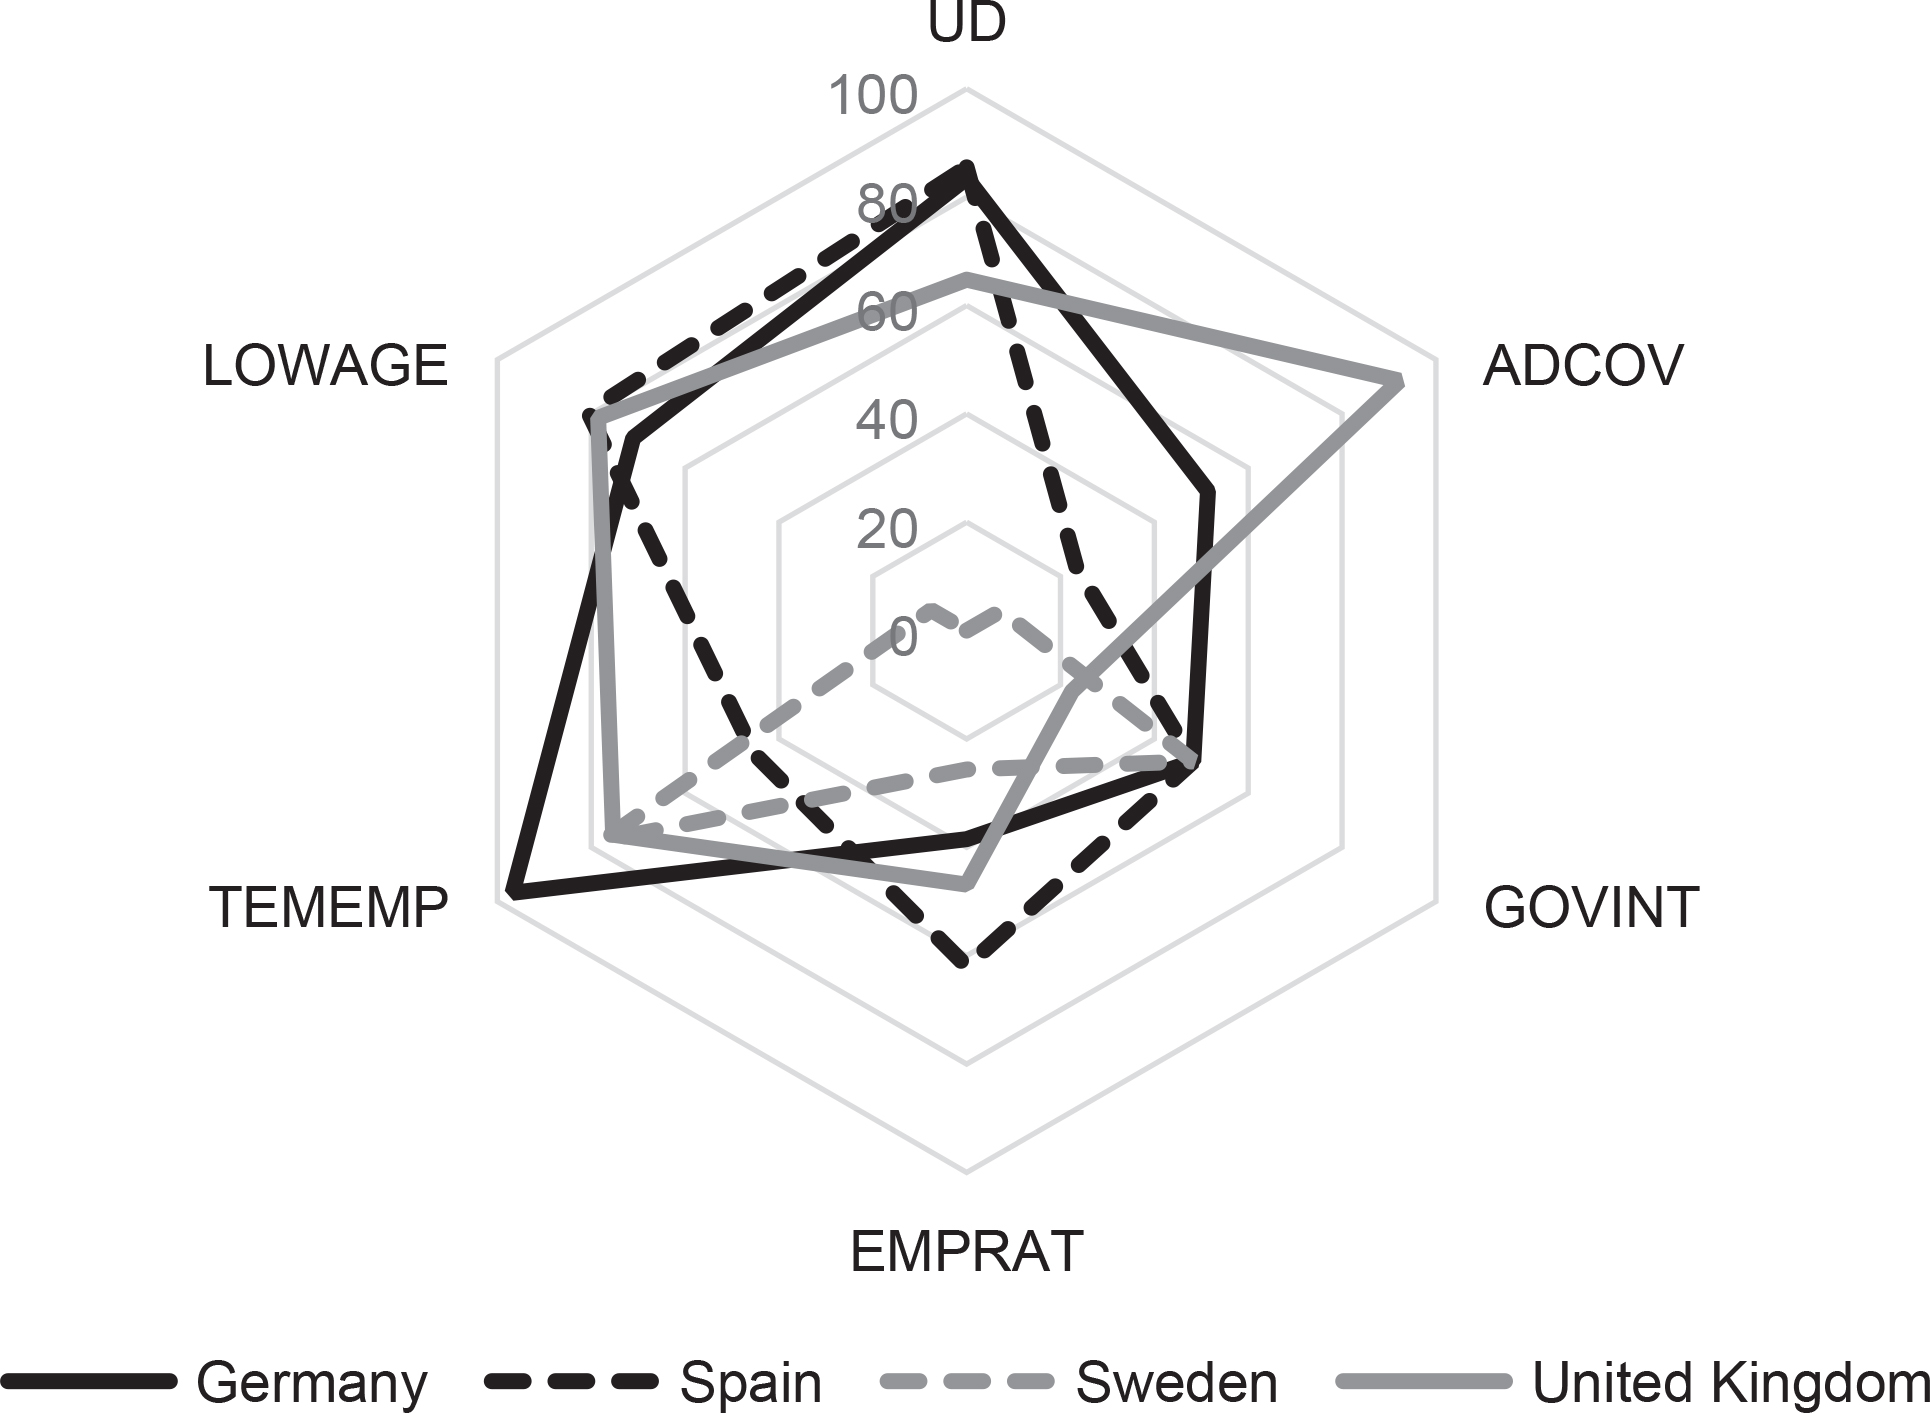
Figure A10
The hexagon of similarities for Hungary (2014).
Source: own elaboration.
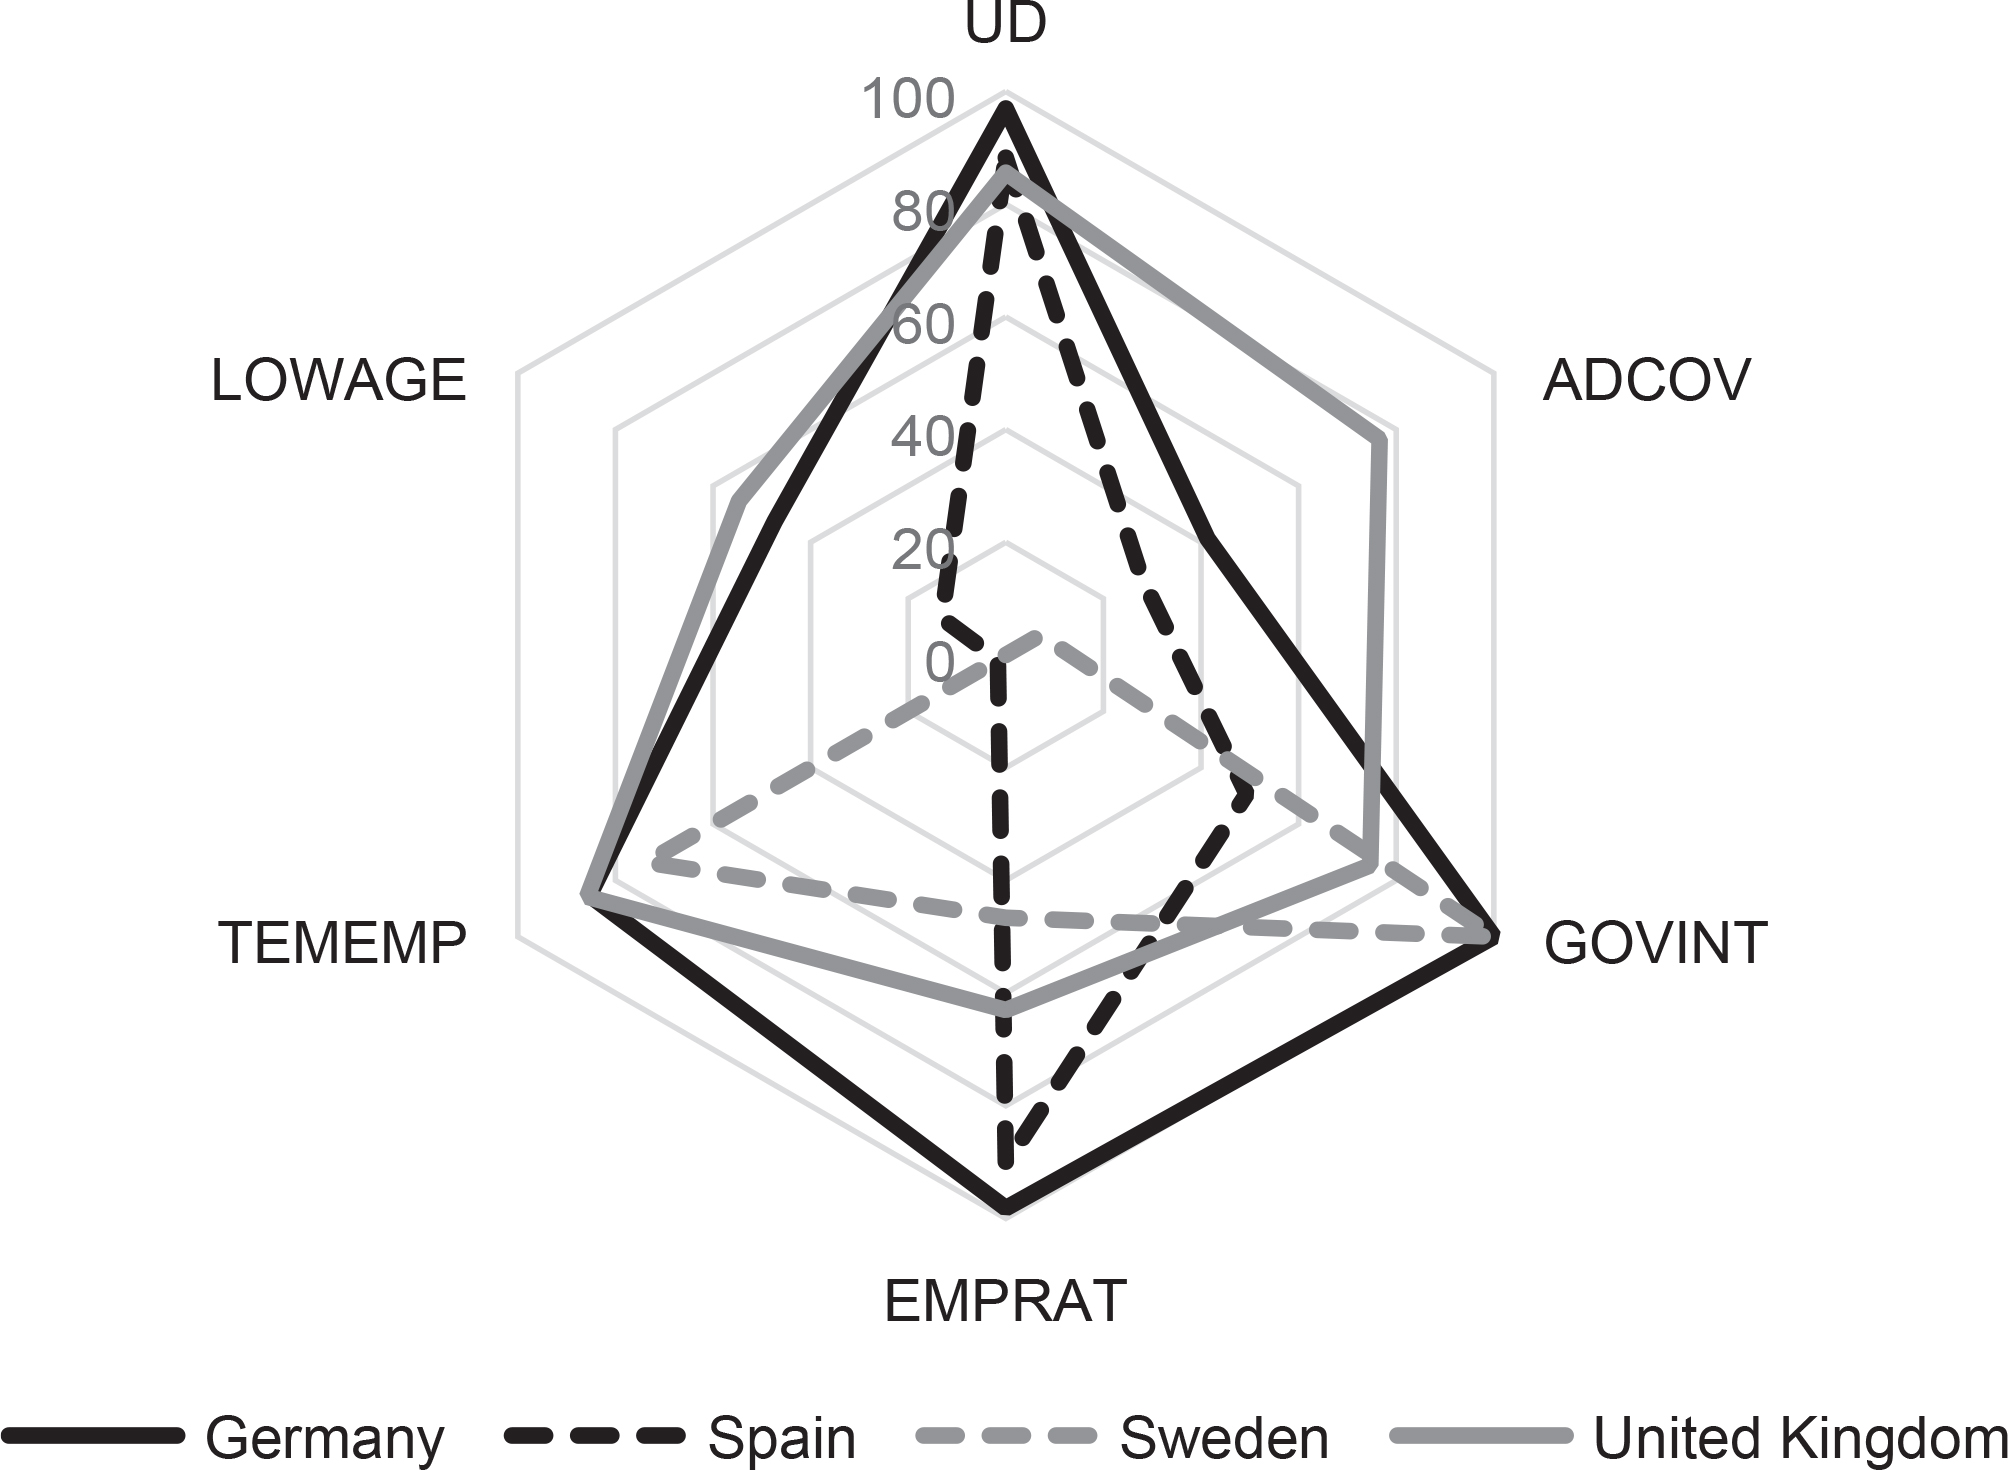
Figure A11
The hexagon of similarities for Latvia (2005).
Source: own elaboration.
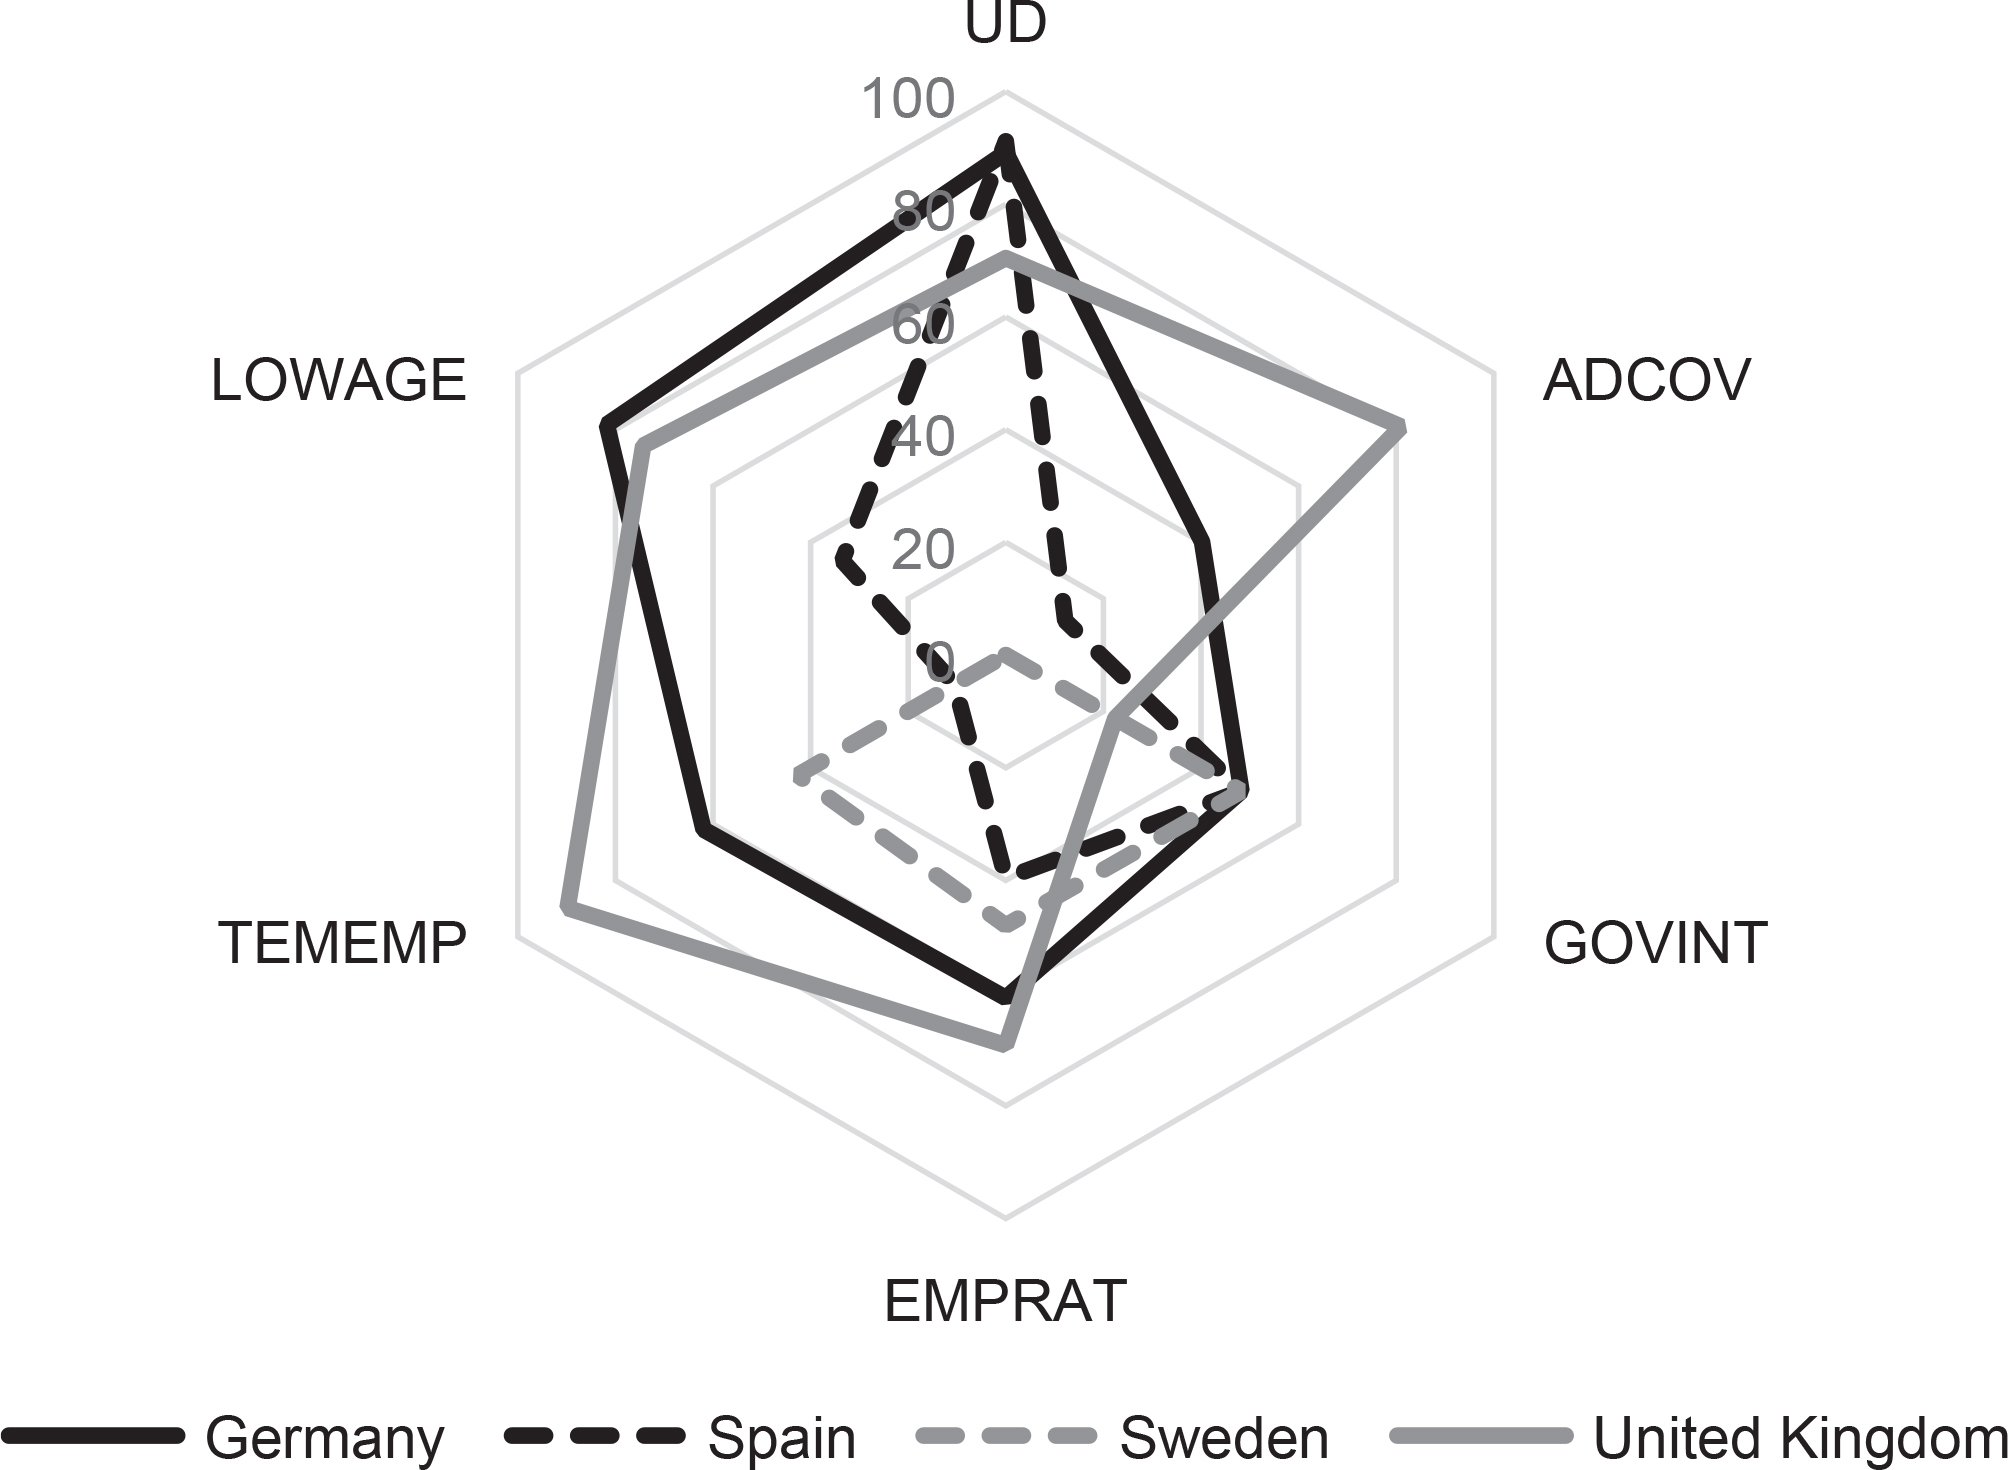
Figure A12
The hexagon of similarities for Latvia (2014).
Source: own elaboration.
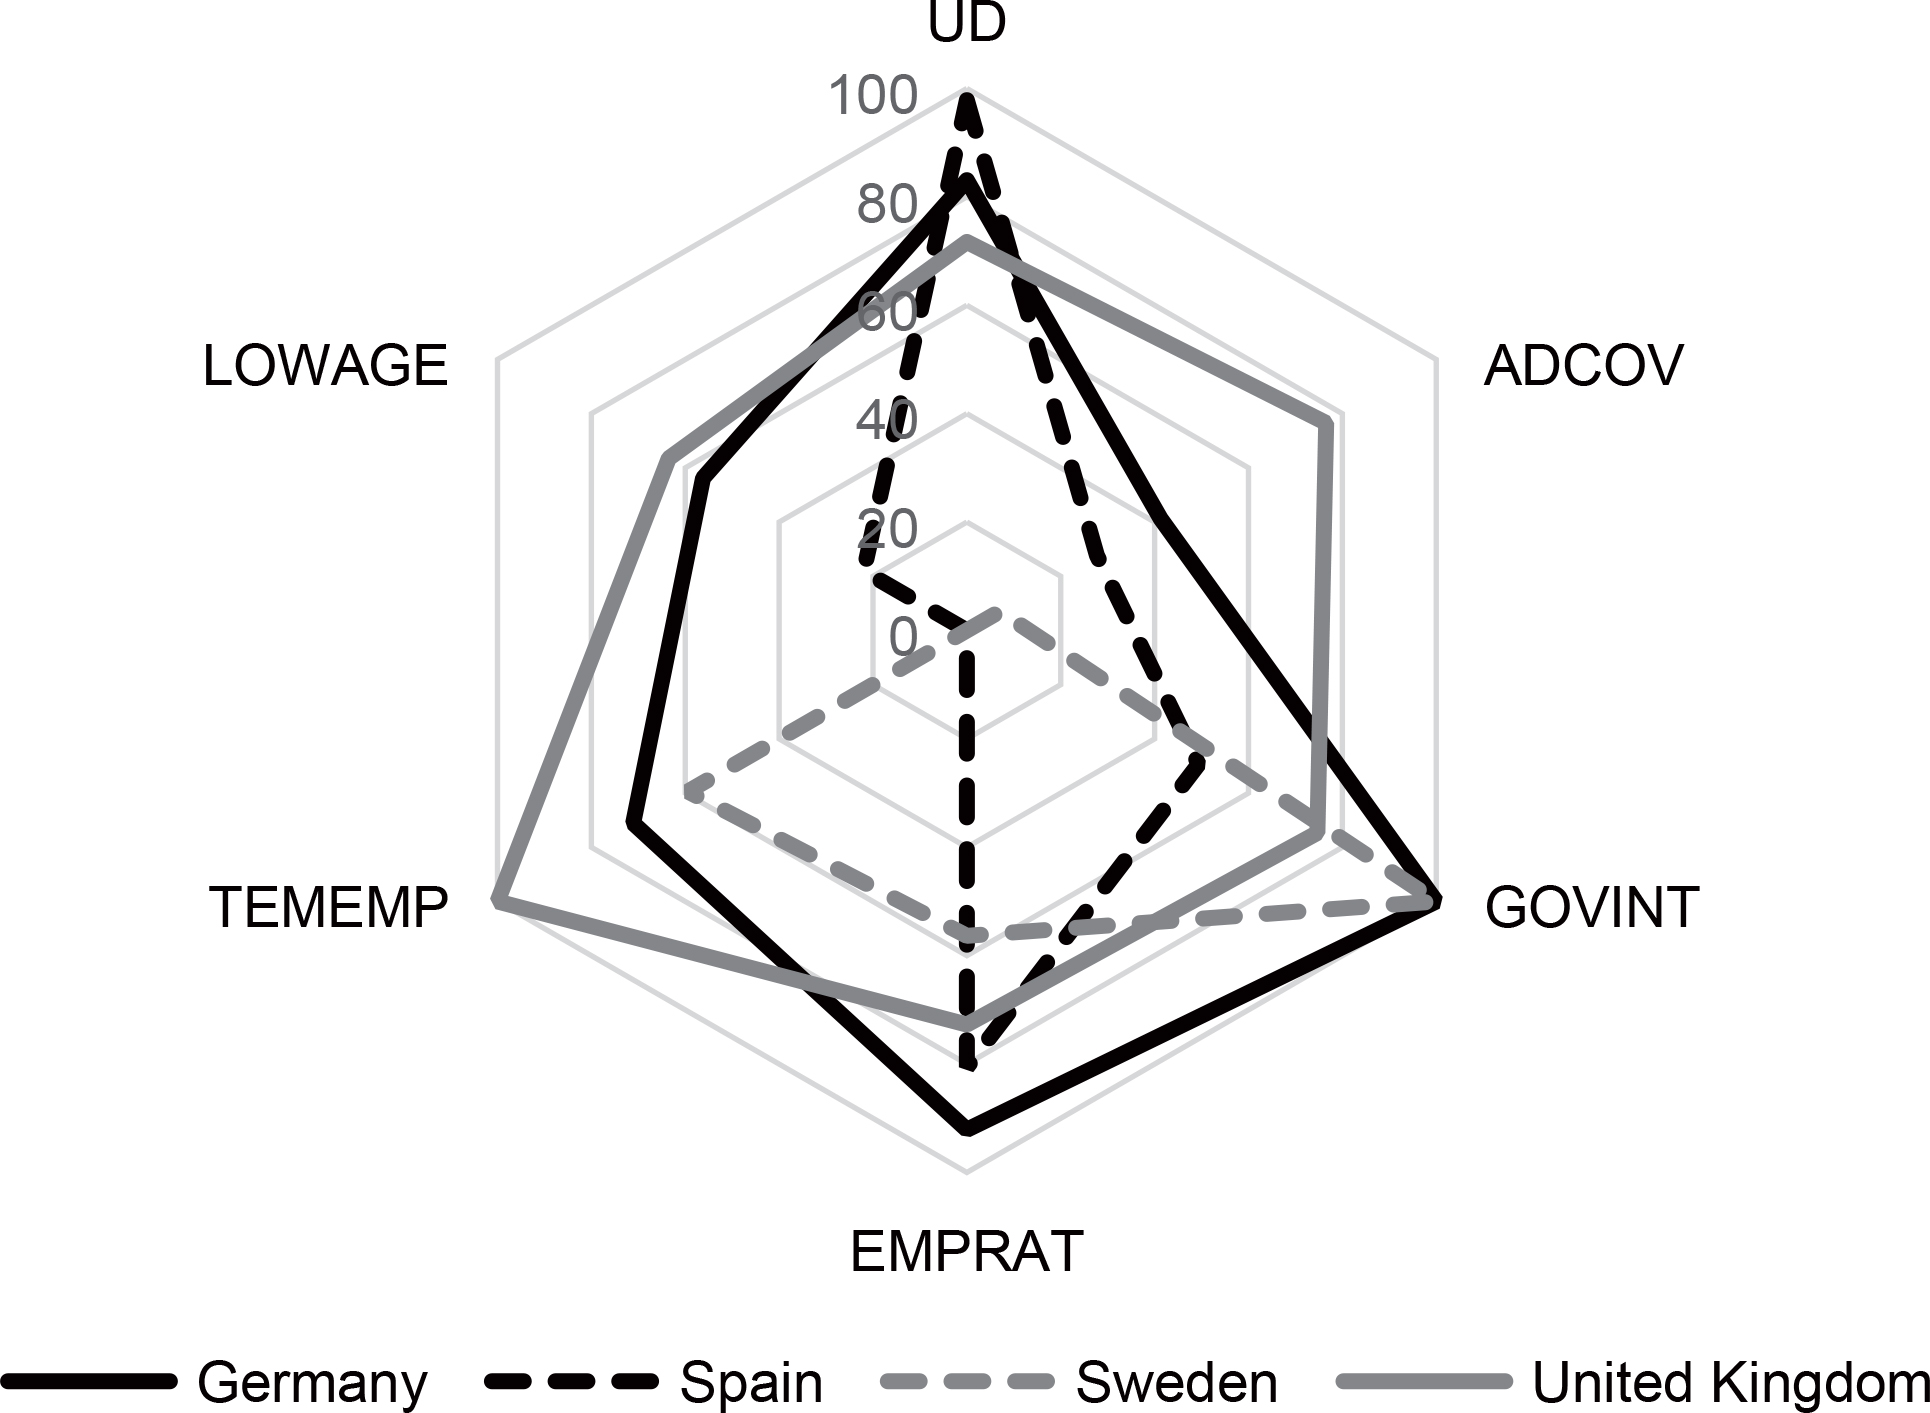
Figure A13
The hexagon of similarities for Lithuania (2005).
Source: own elaboration.
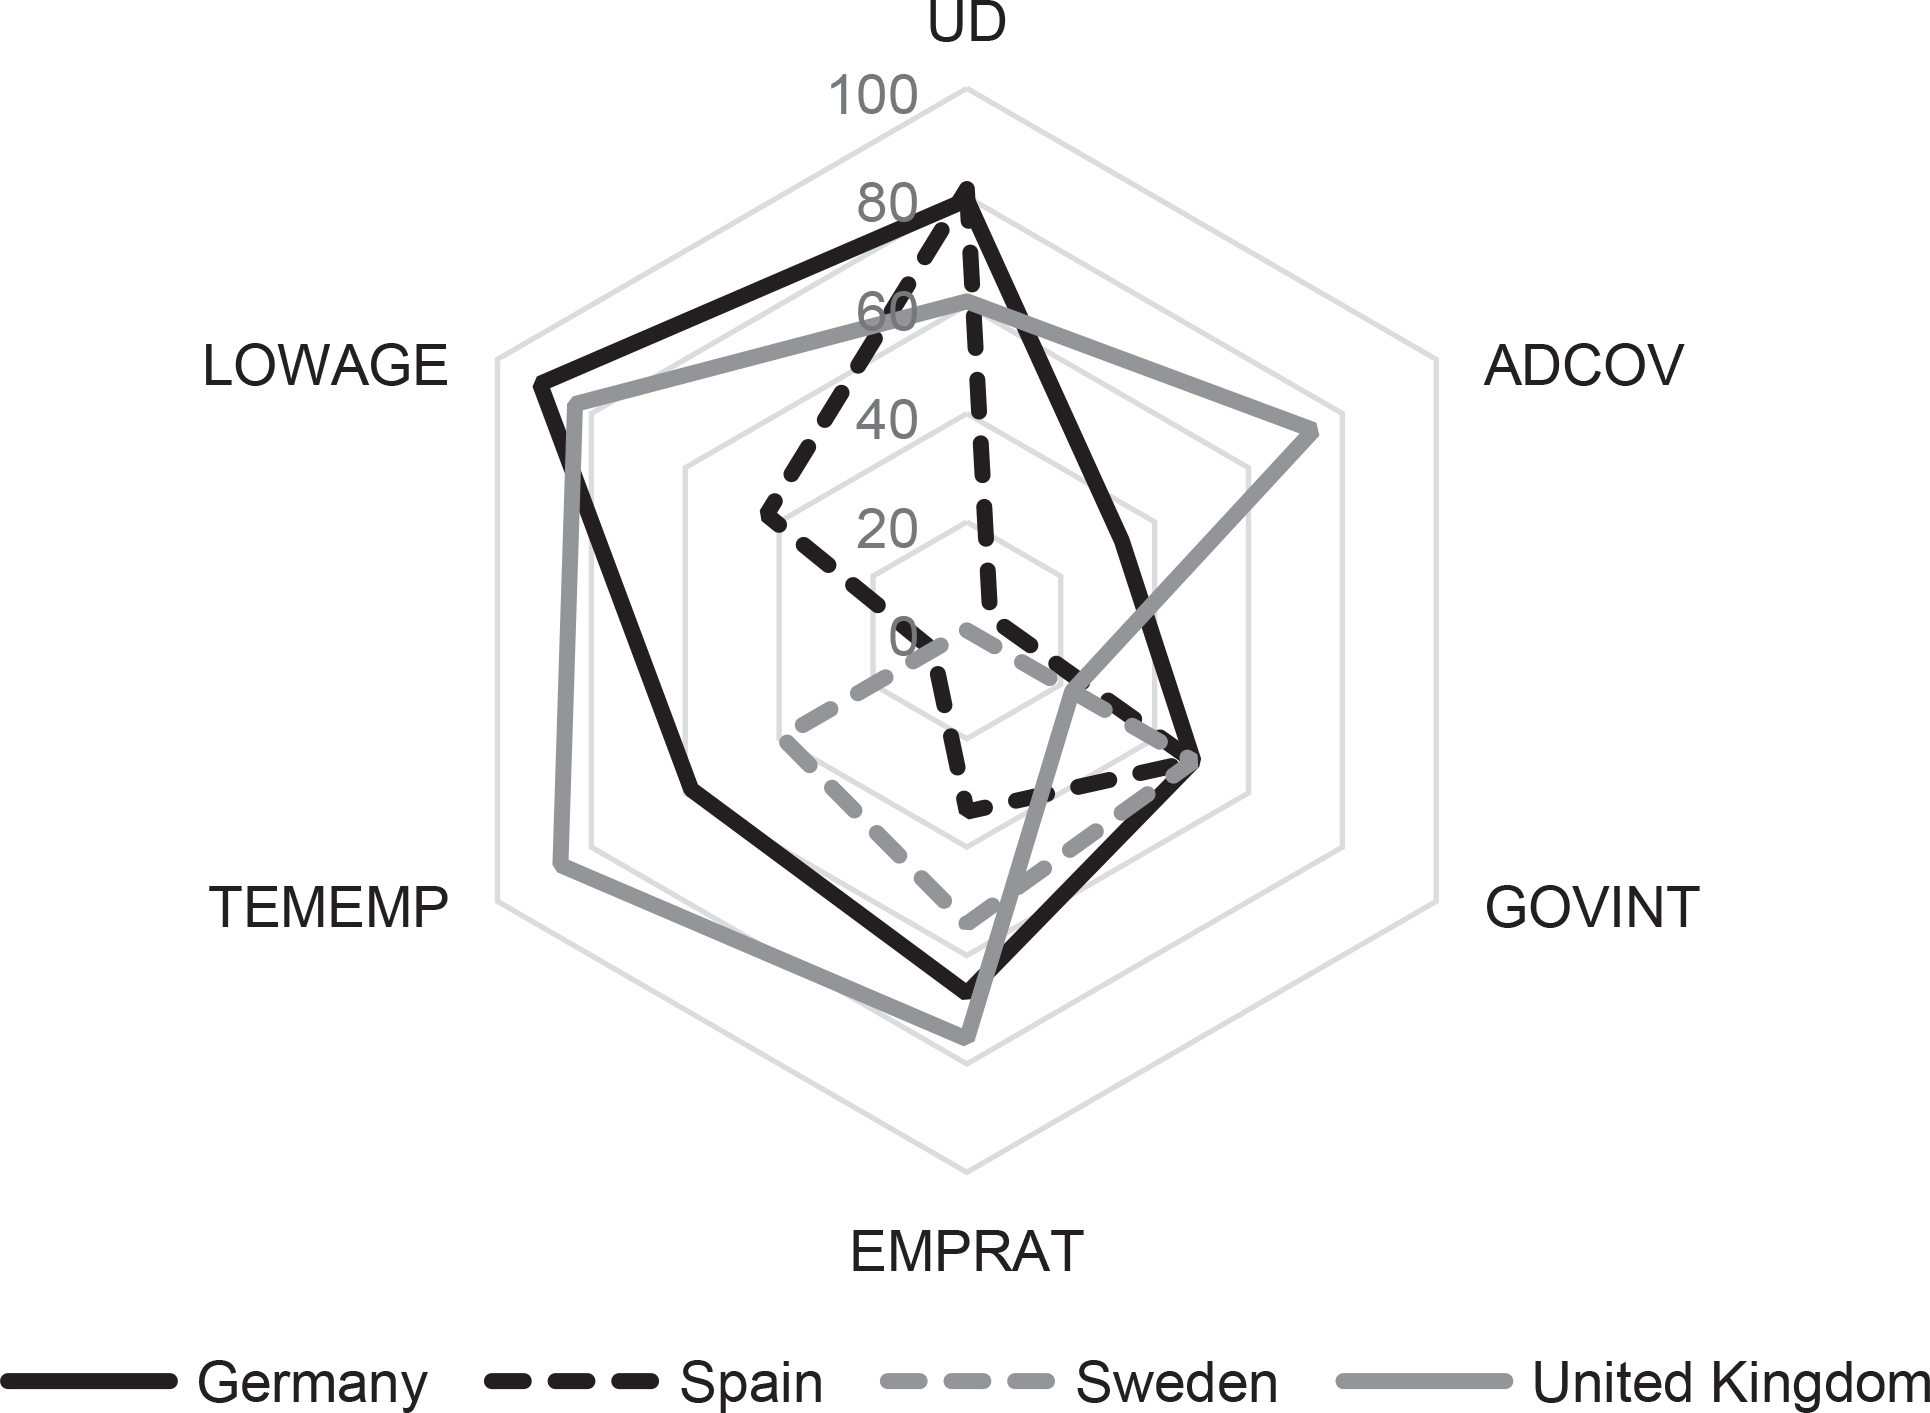
Figure A14
The hexagon of similarities for Lithuania (2014).
Source: own elaboration.
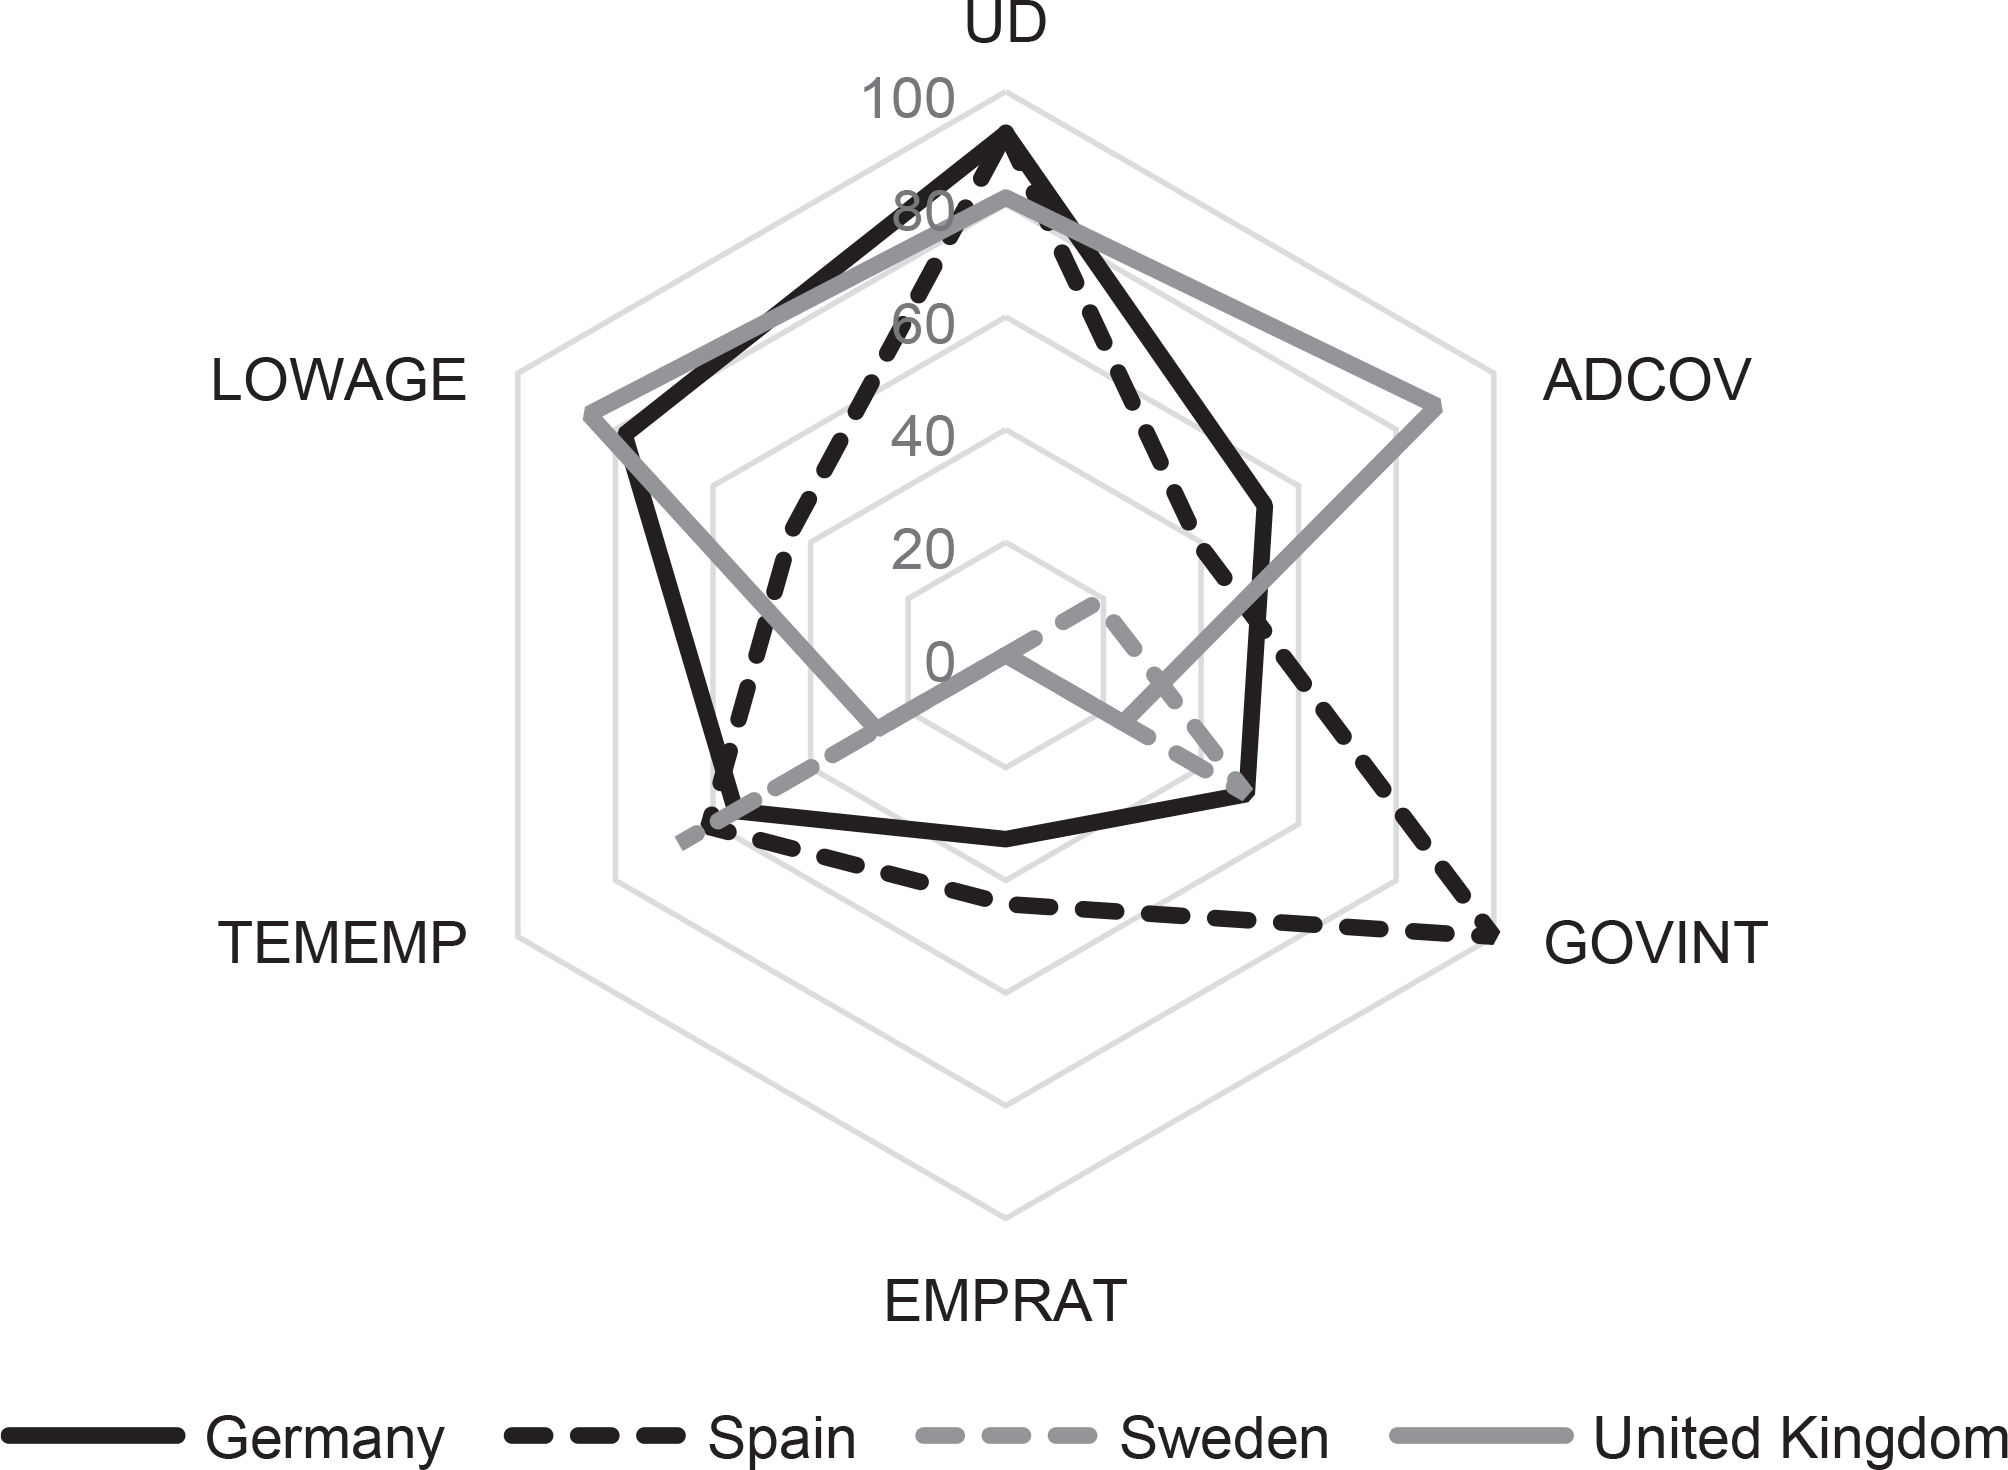
Figure A15
The hexagon of similarities for Poland (2005).
Source: own elaboration.
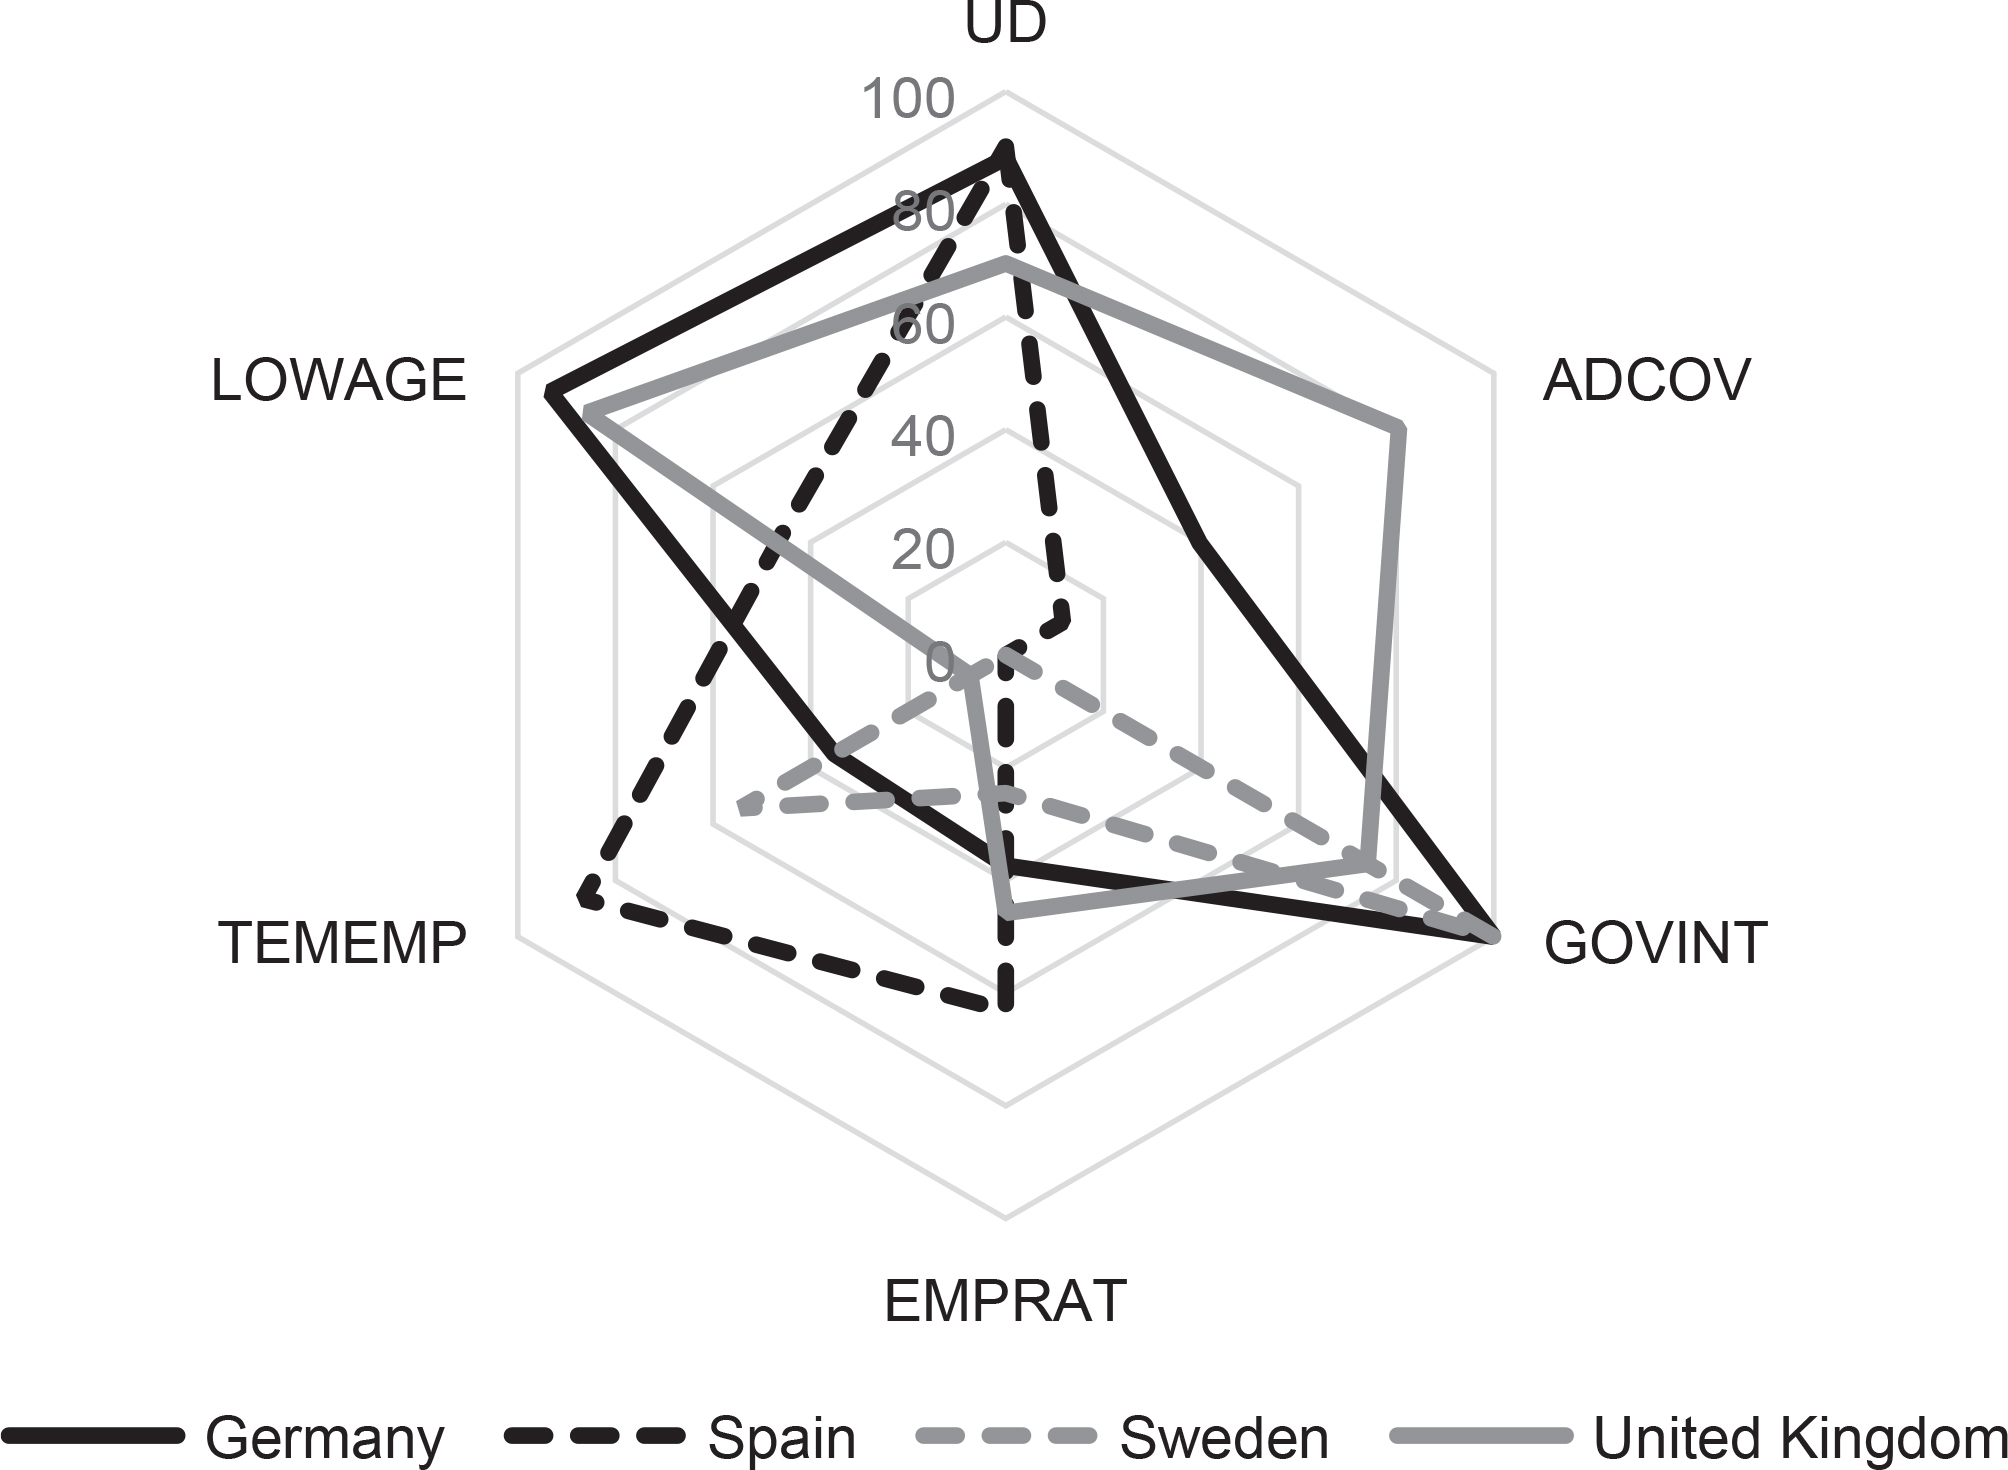
Figure A16
The hexagon of similarities for Poland (2014).
Source: own elaboration.
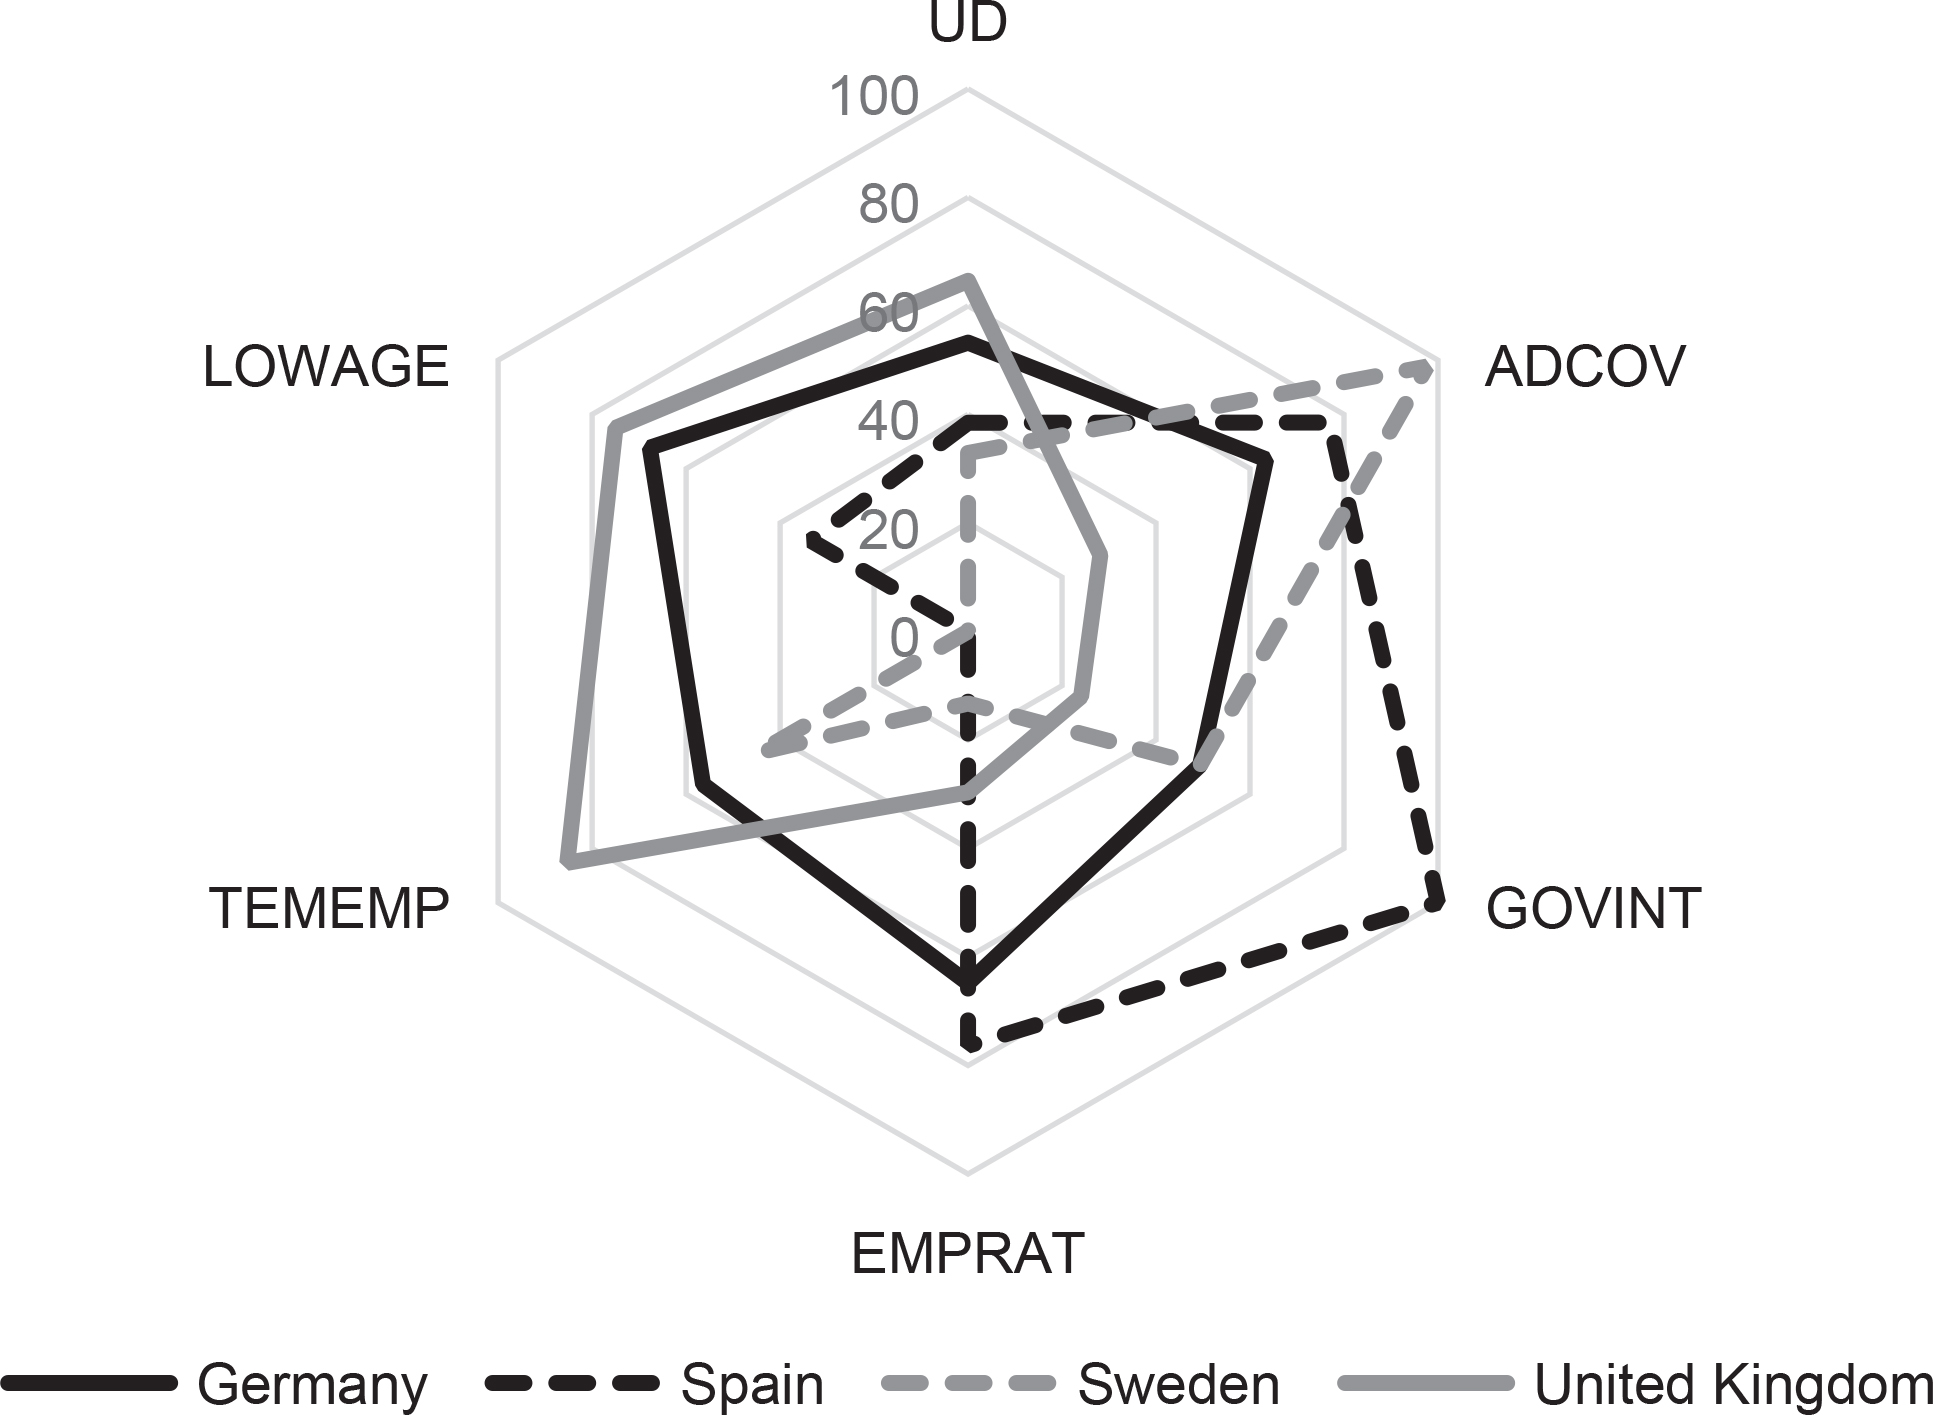
Figure A17
The hexagon of similarities for Romania (2005).
Source: own elaboration.
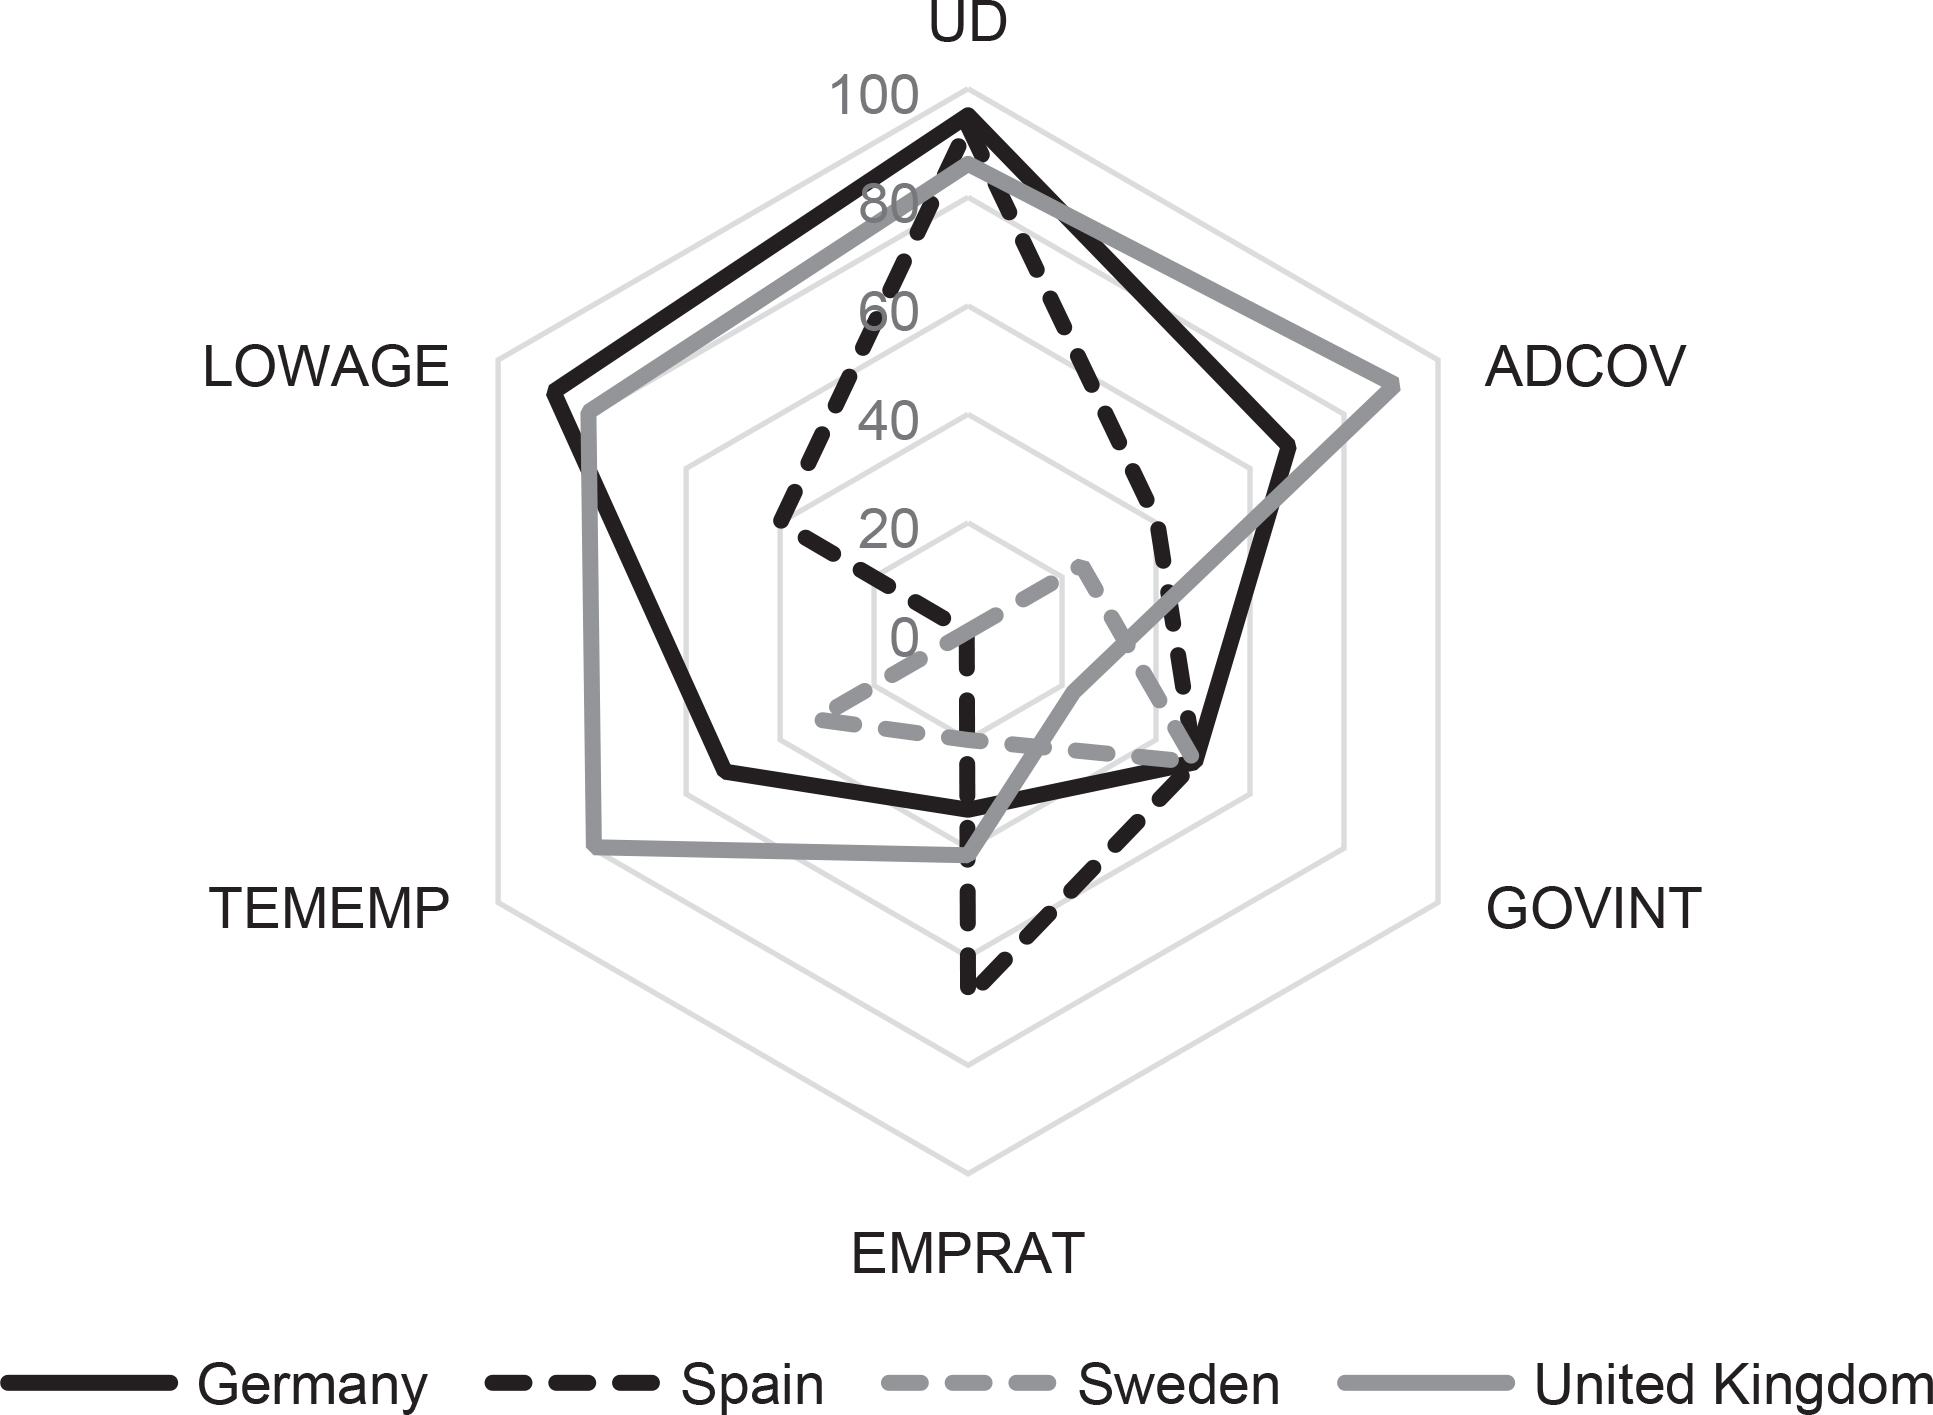
Figure A18
The hexagon of similarities for Romania (2014).
Source: own elaboration.
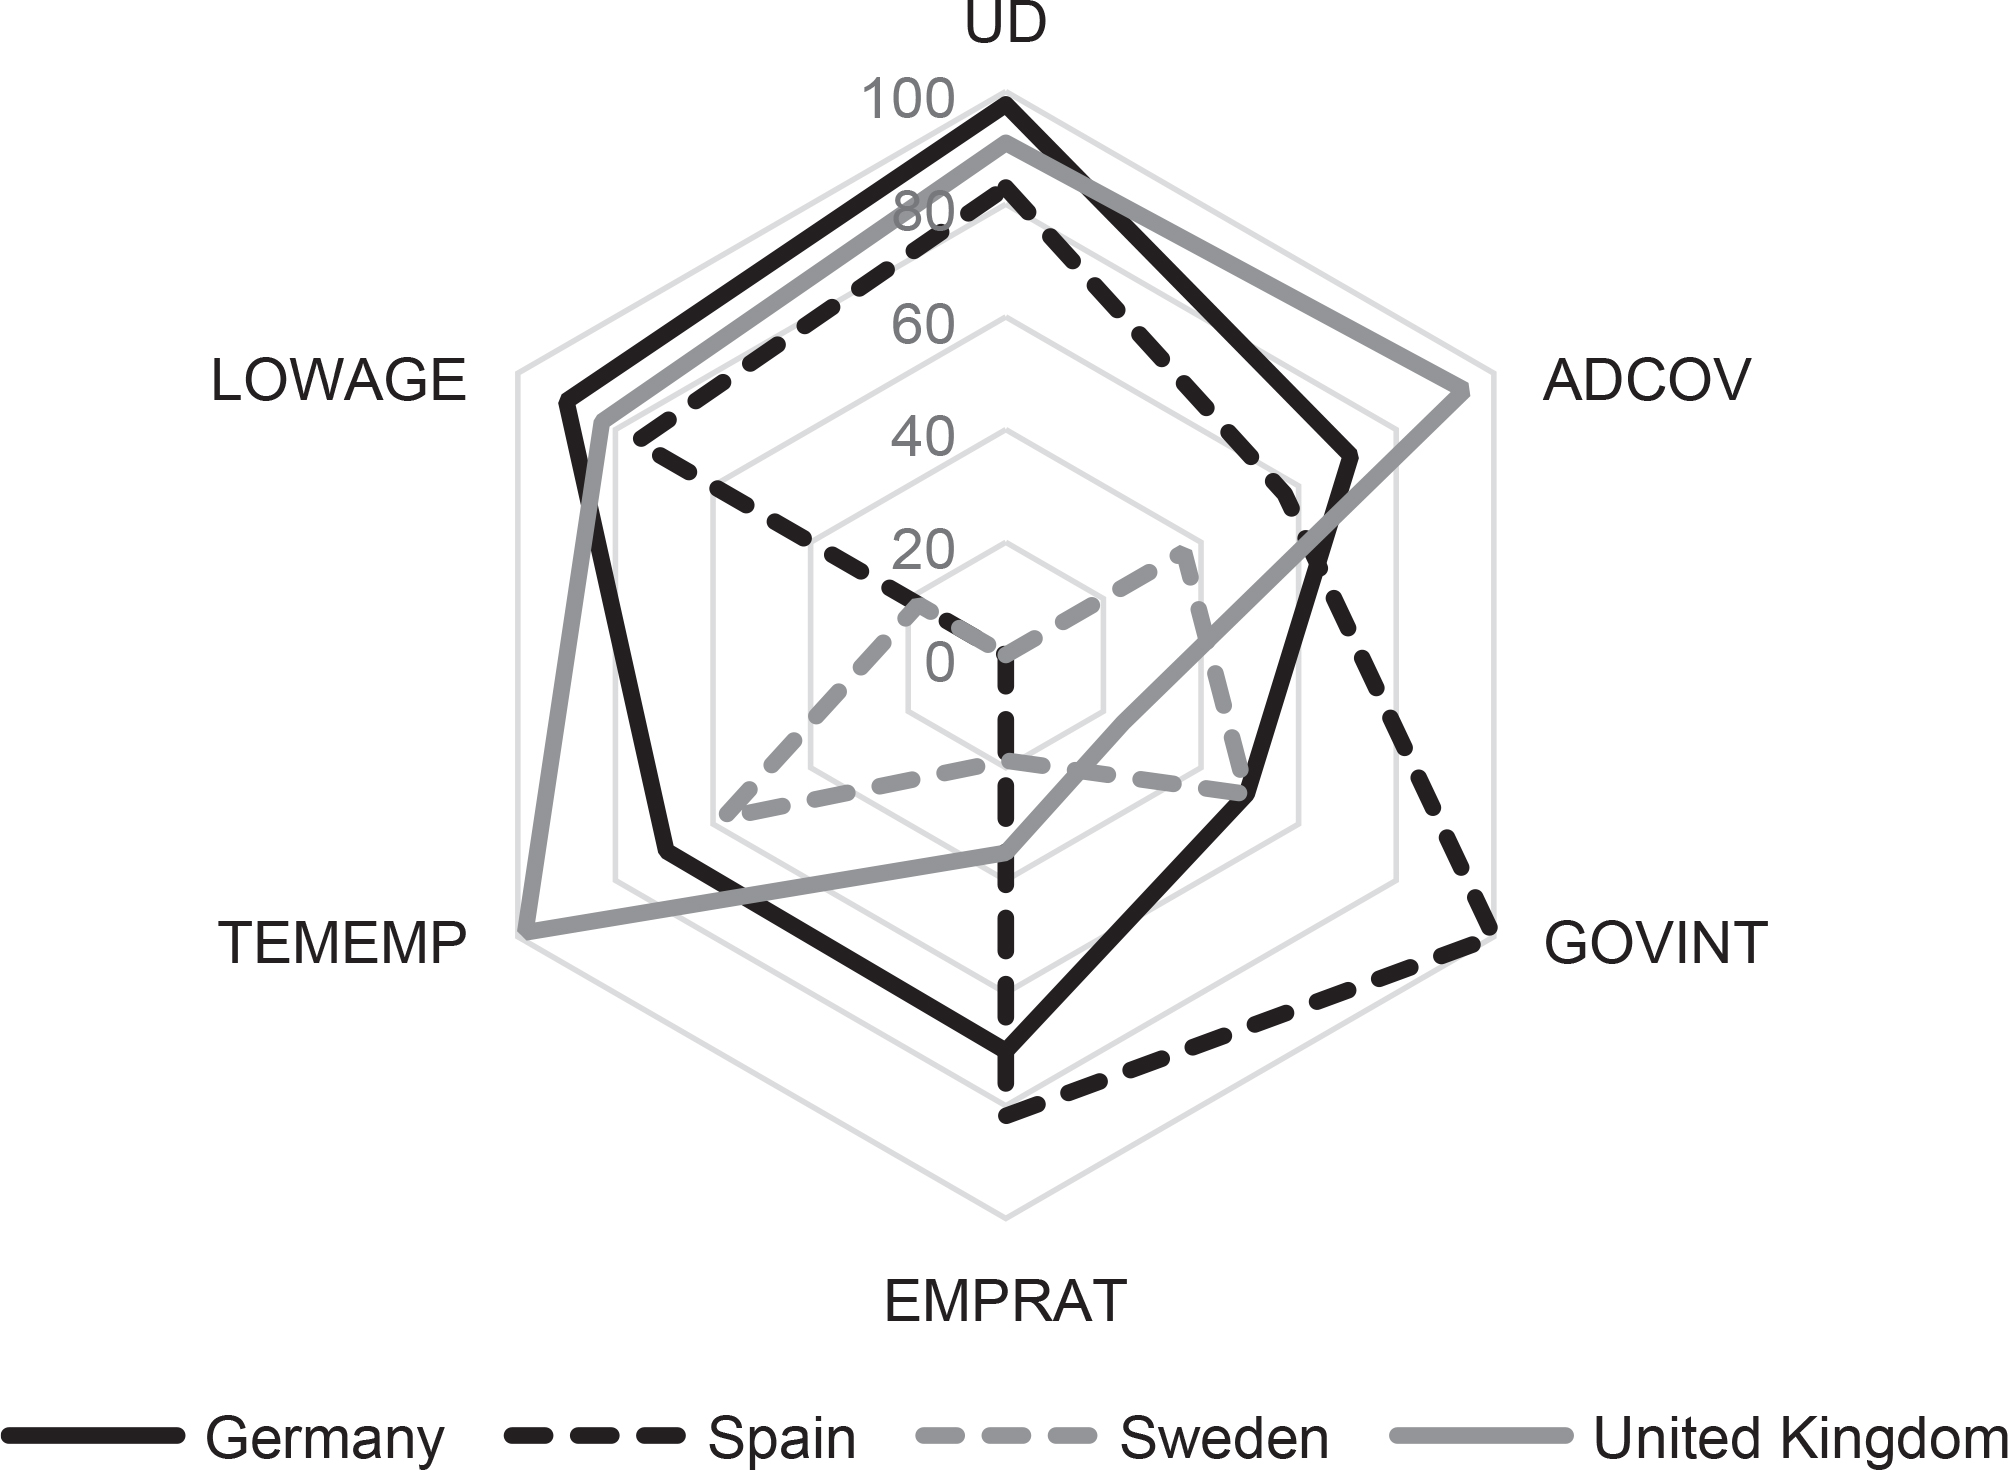
Figure A19
The hexagon of similarities for Slovakia (2005).
Source: own elaboration.
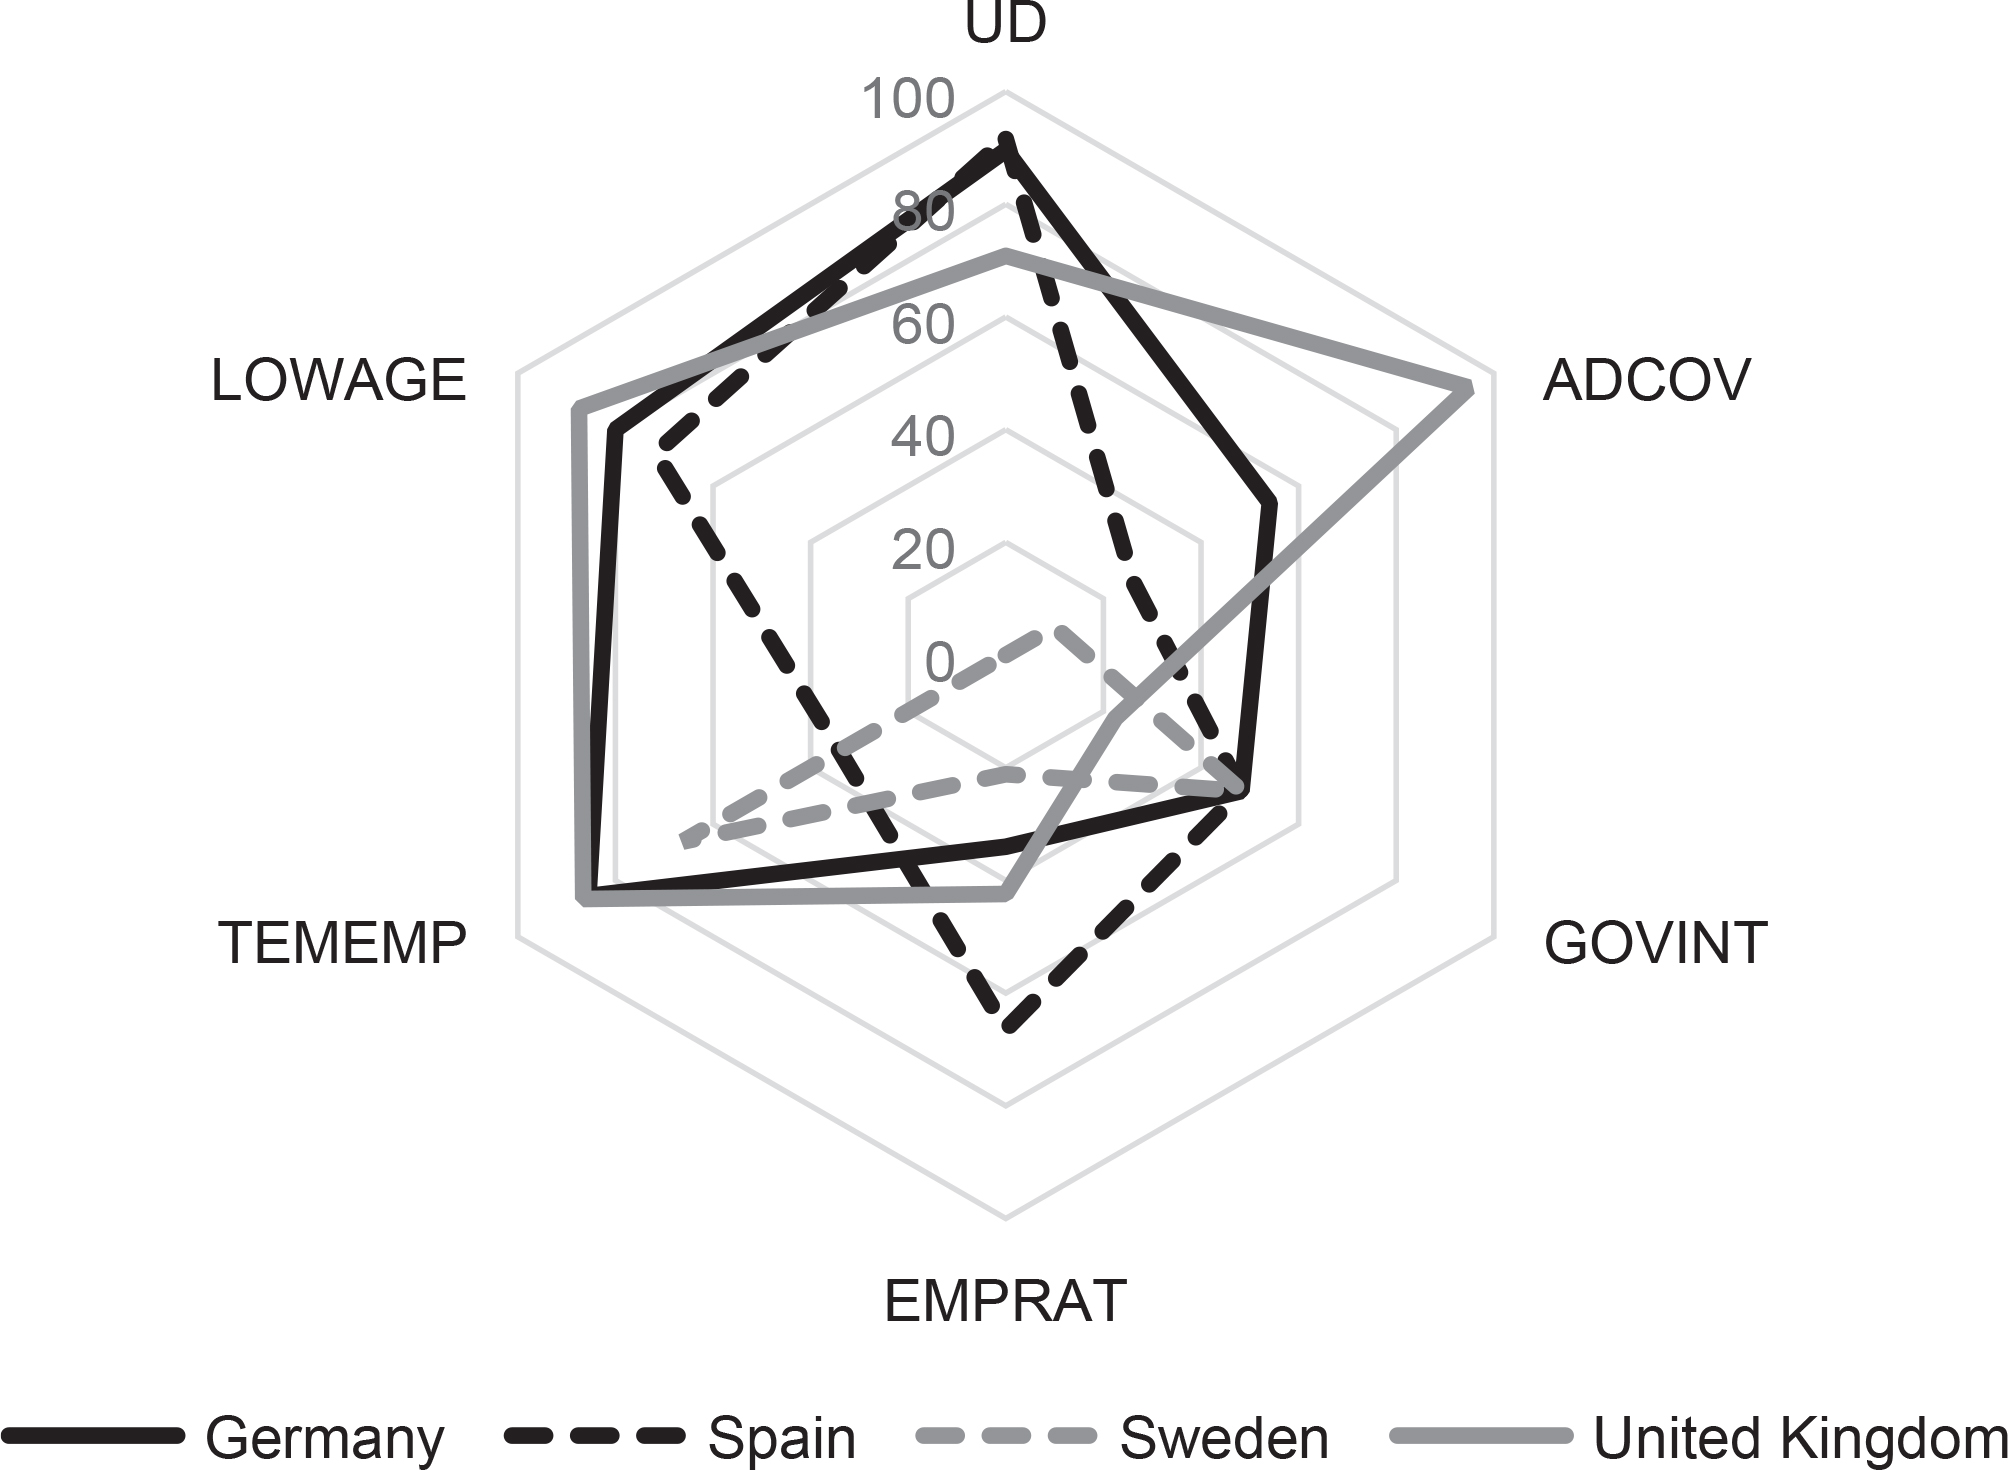
Figure A20
The hexagon of similarities for Slovakia (2014).
Source: own elaboration.
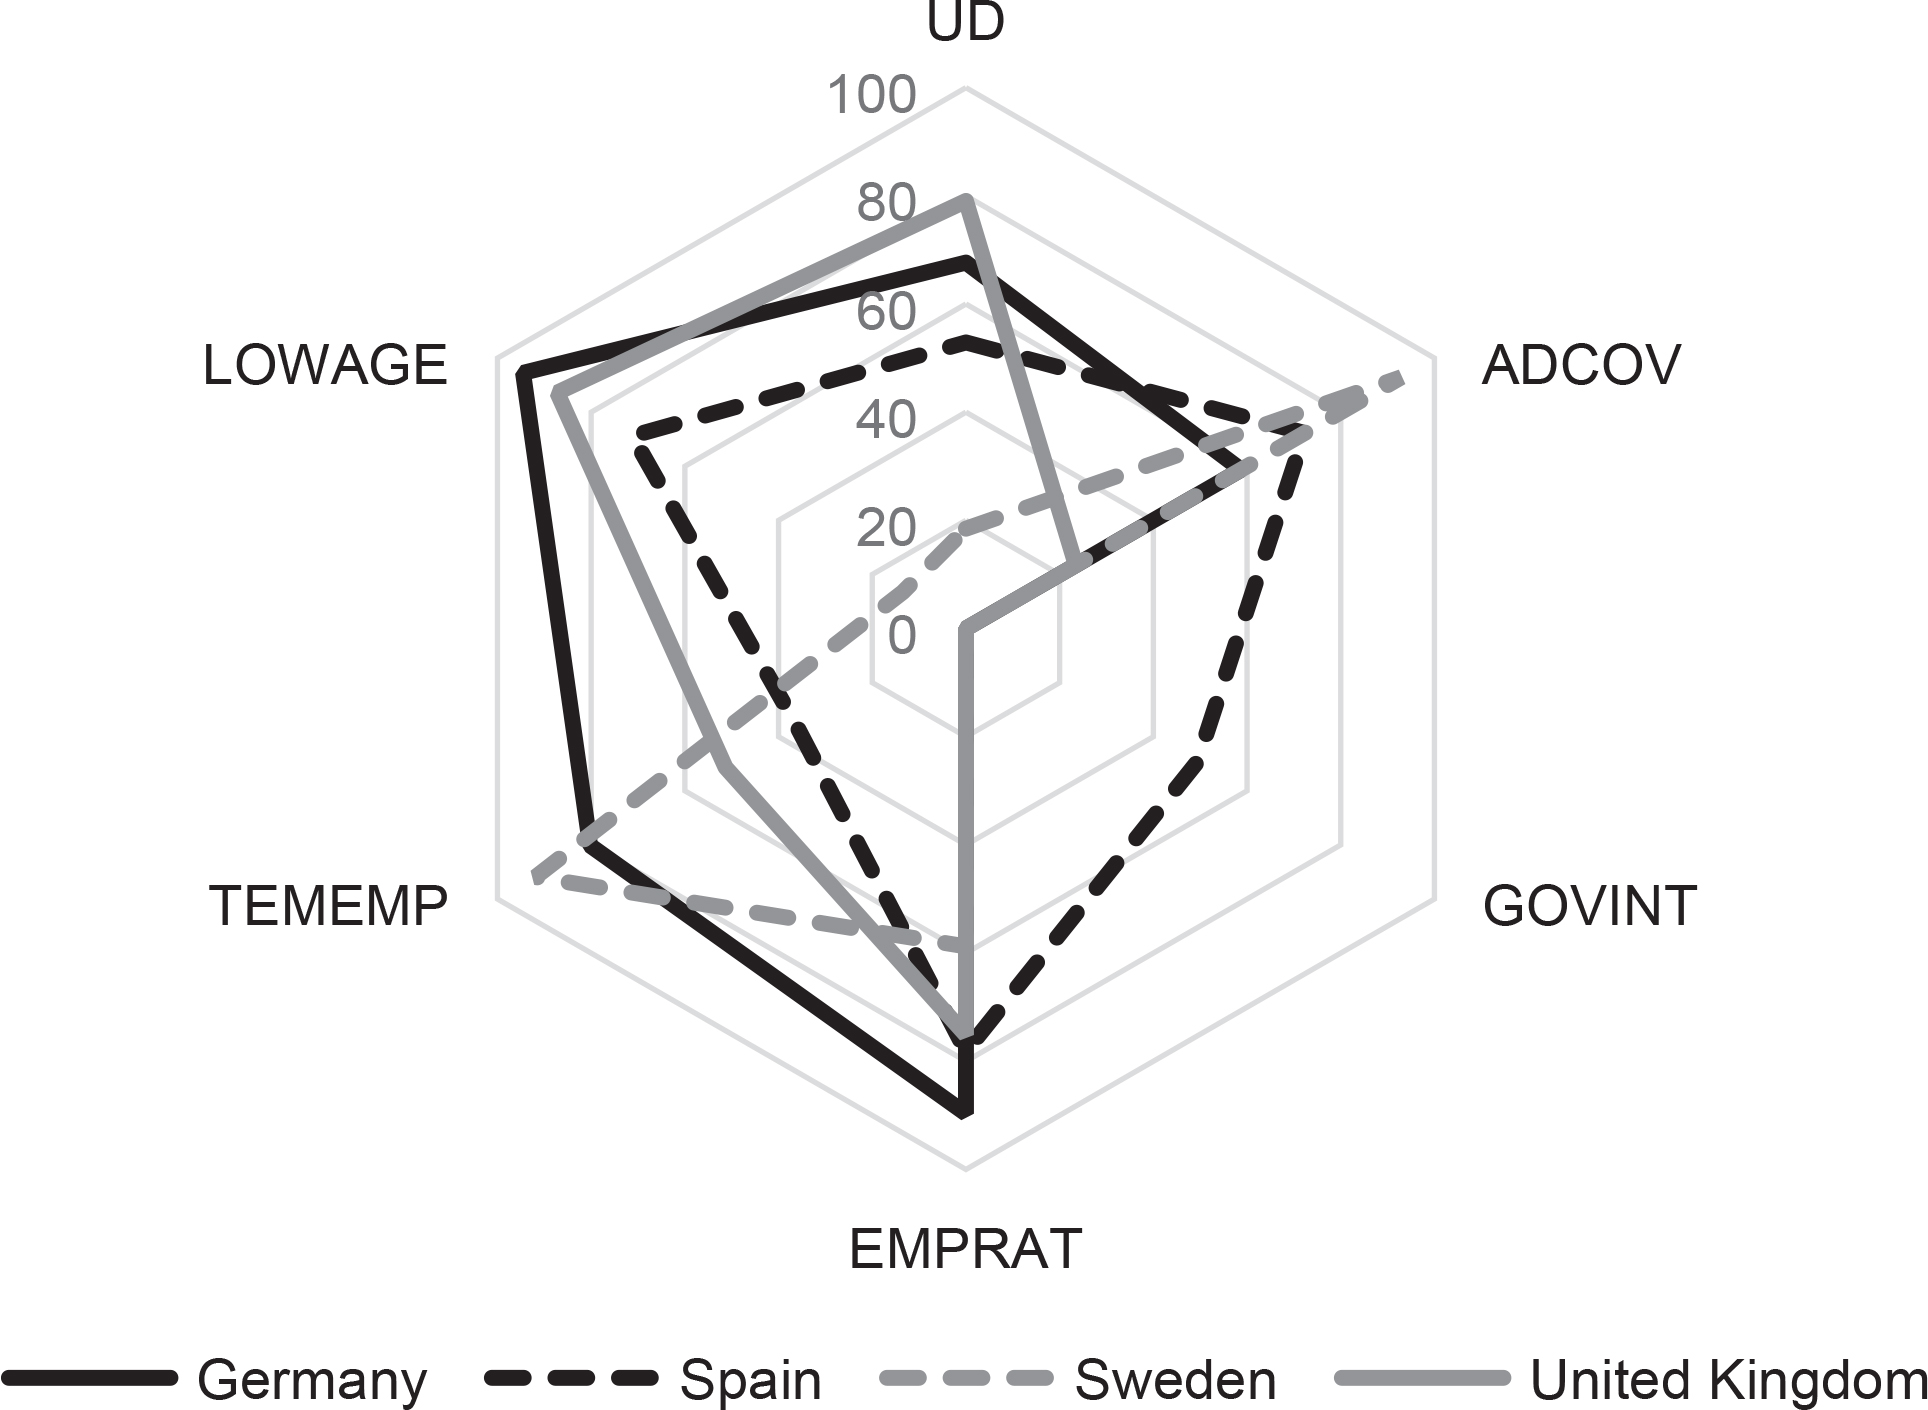
Figure A21
The hexagon of similarities for Slovenia (2005).
Source: own elaboration.
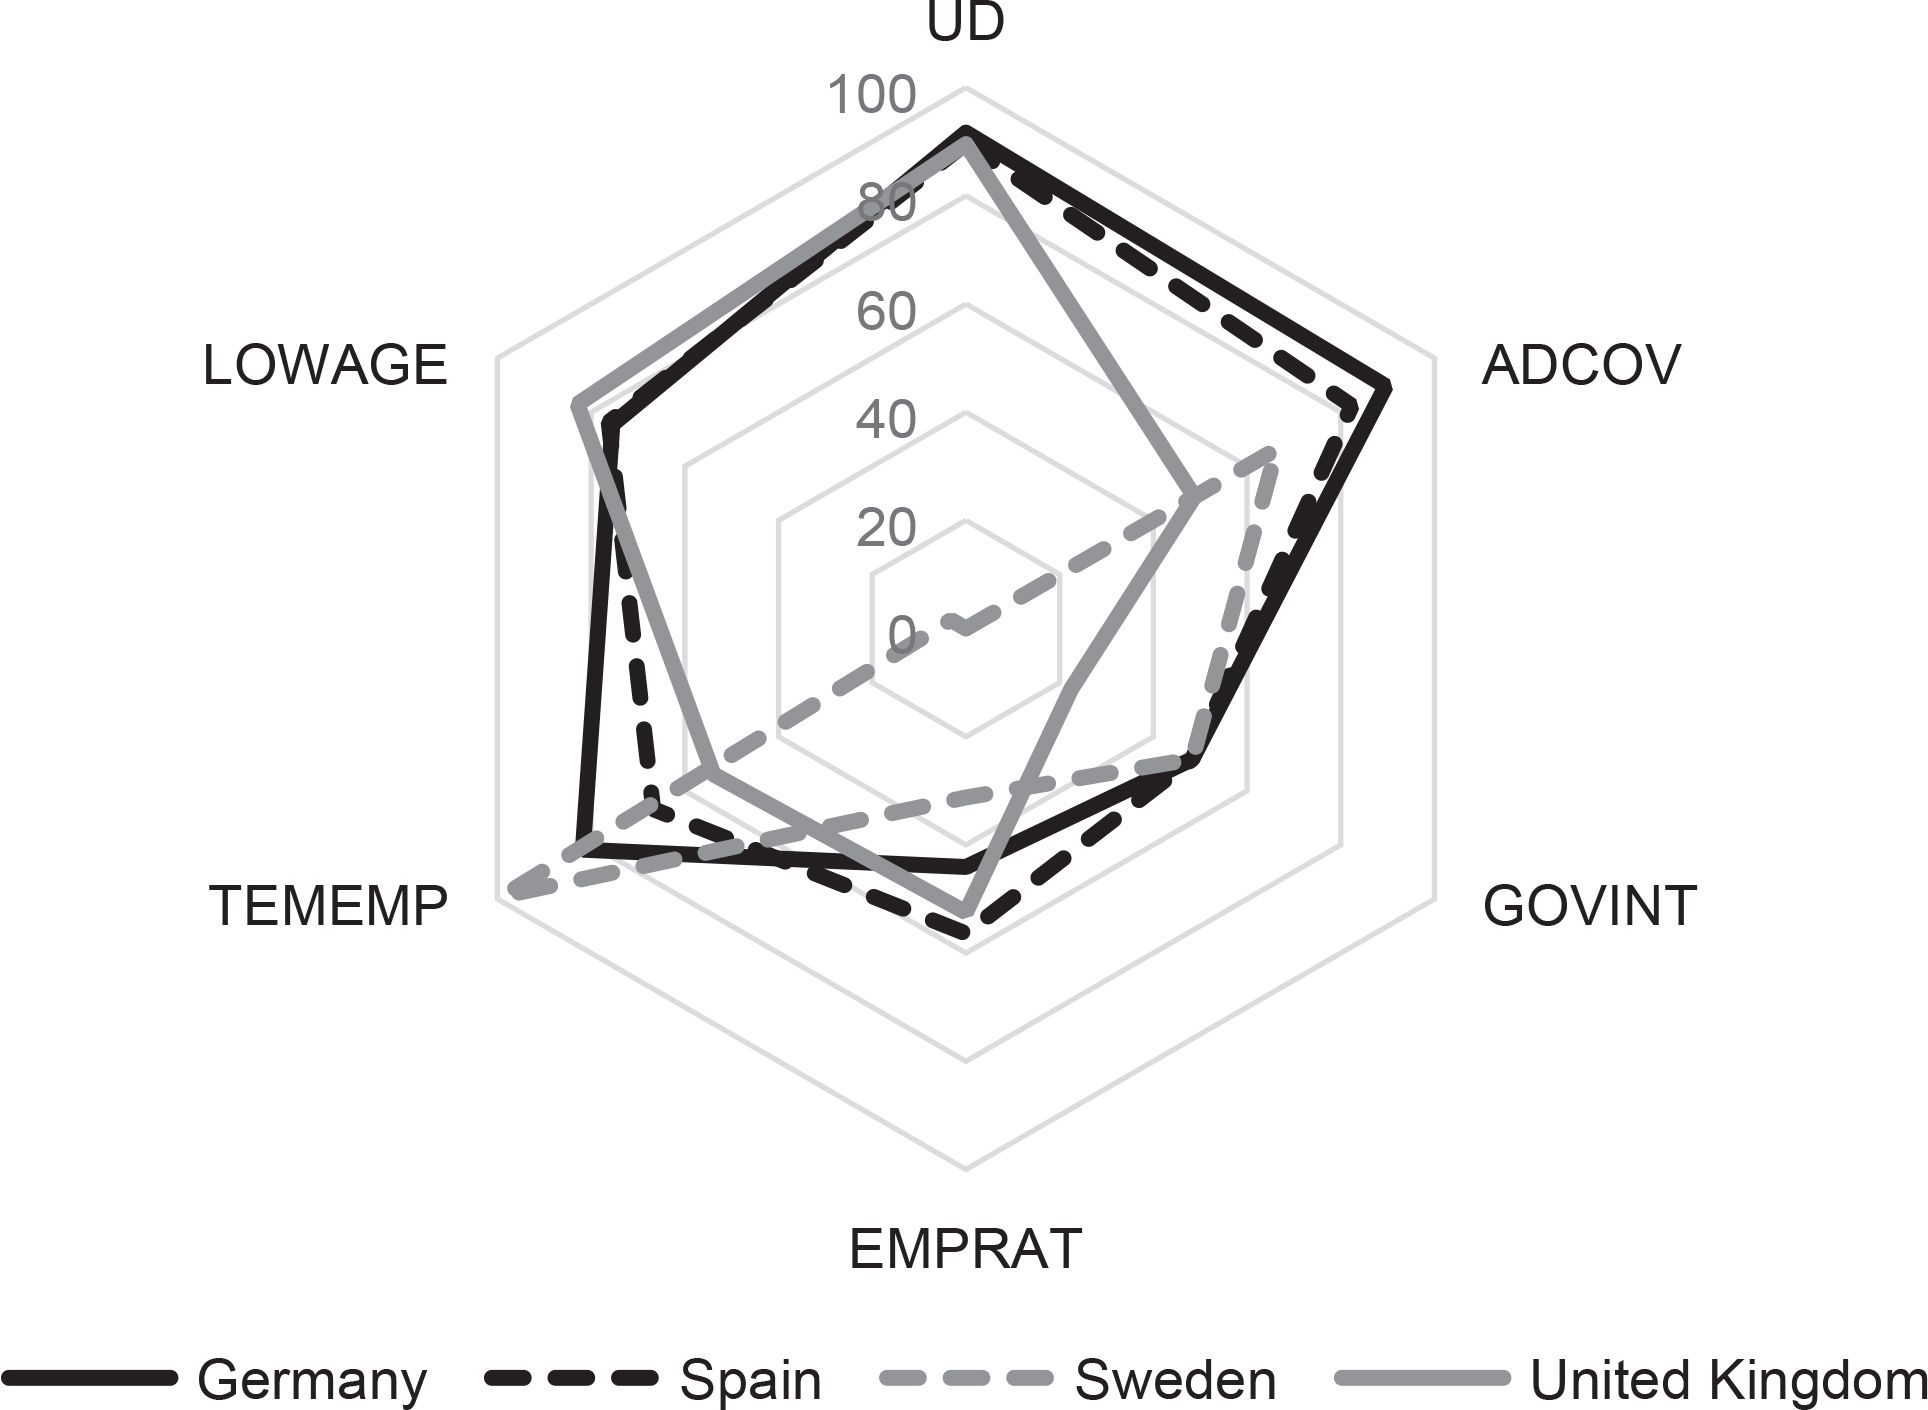
Figure A22
The hexagon of similarities for Slovenia (2014). Source: own materials.
Source: own elaboration.