
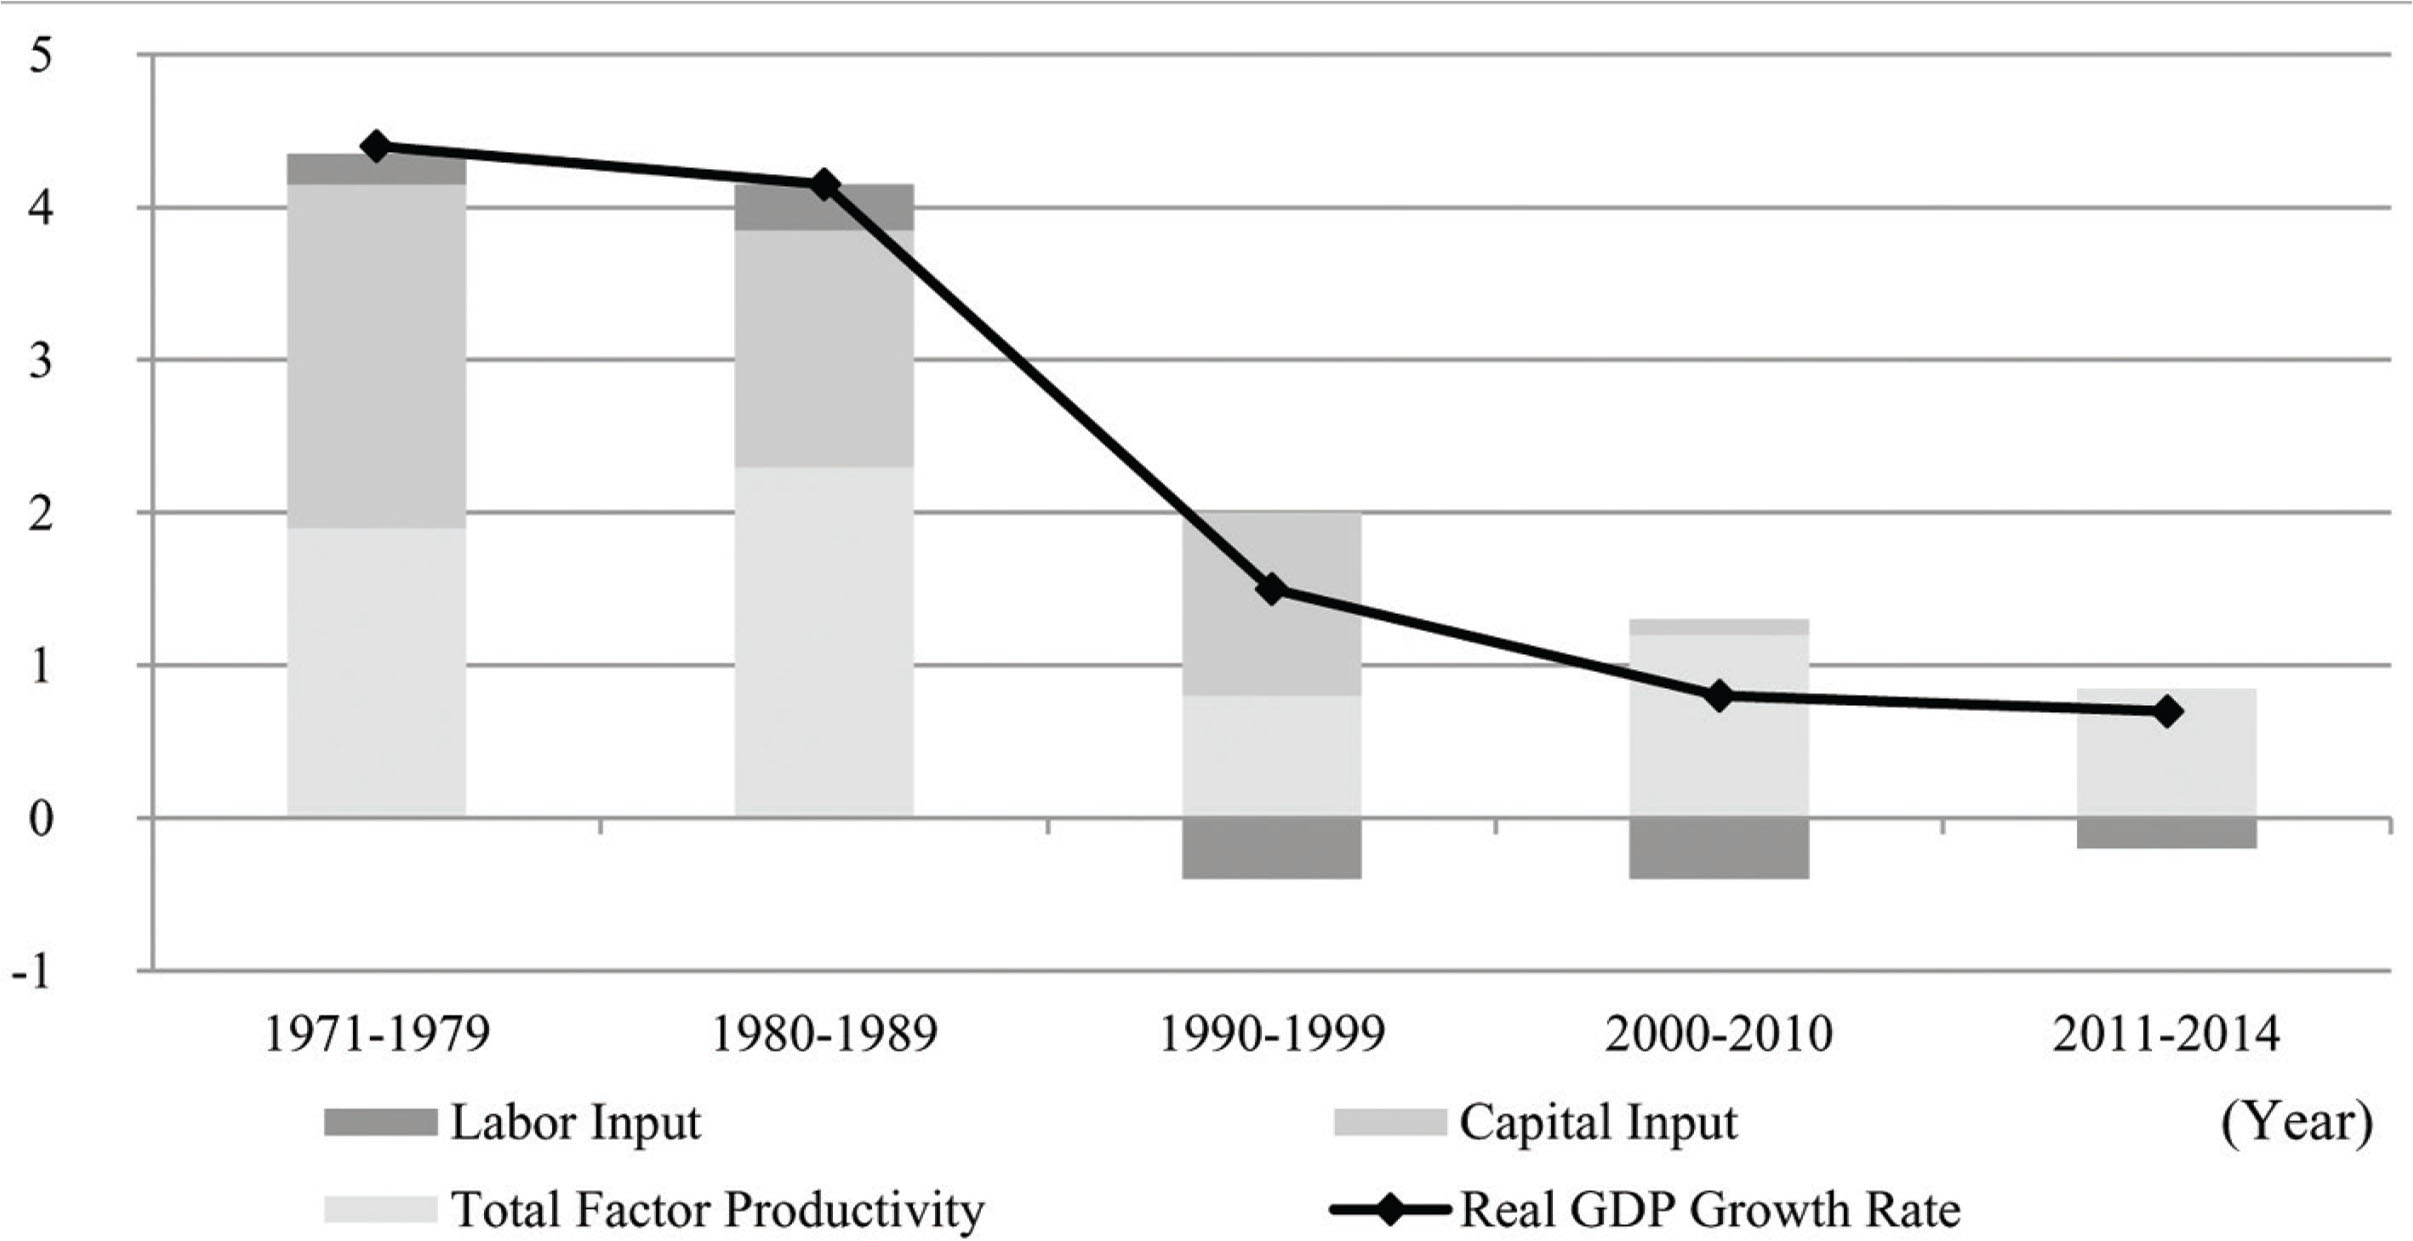
Figure 1
Trends in the real GDP growth rate in Japan (%).
Source:Fukao et al. [2015, p. 15].
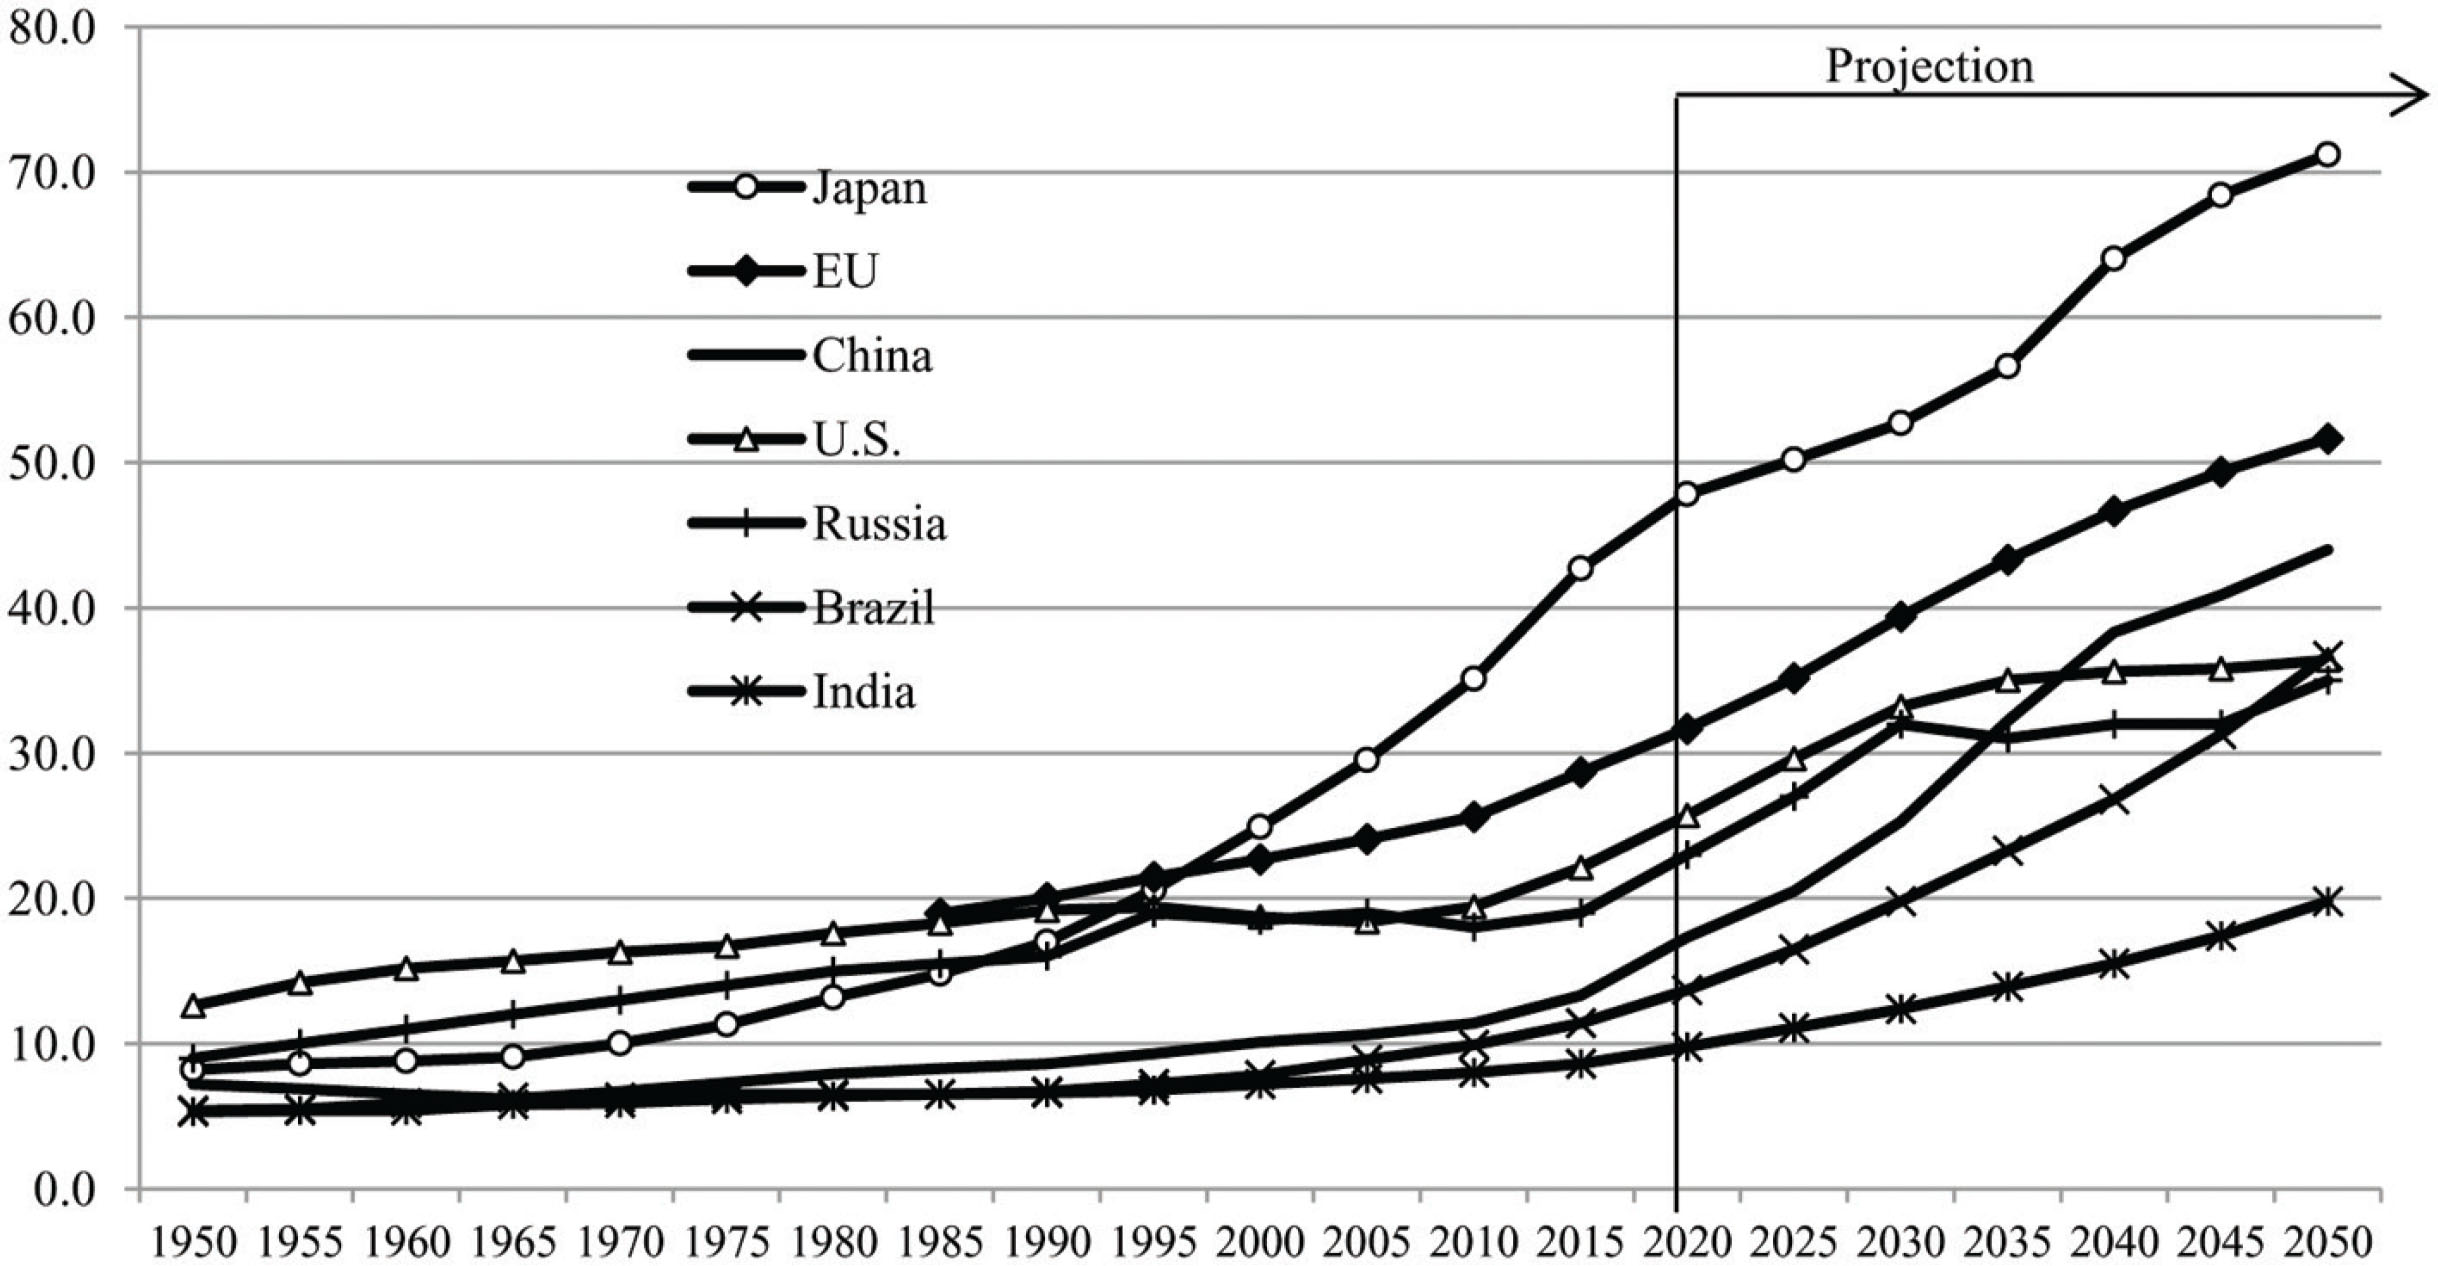
Figure 2
The ratio of the elderly population in major countries (%).
Note: The elderly population (aged 65 or over) divided by the productive population (age 15–64).
Source: [UN, DESA].
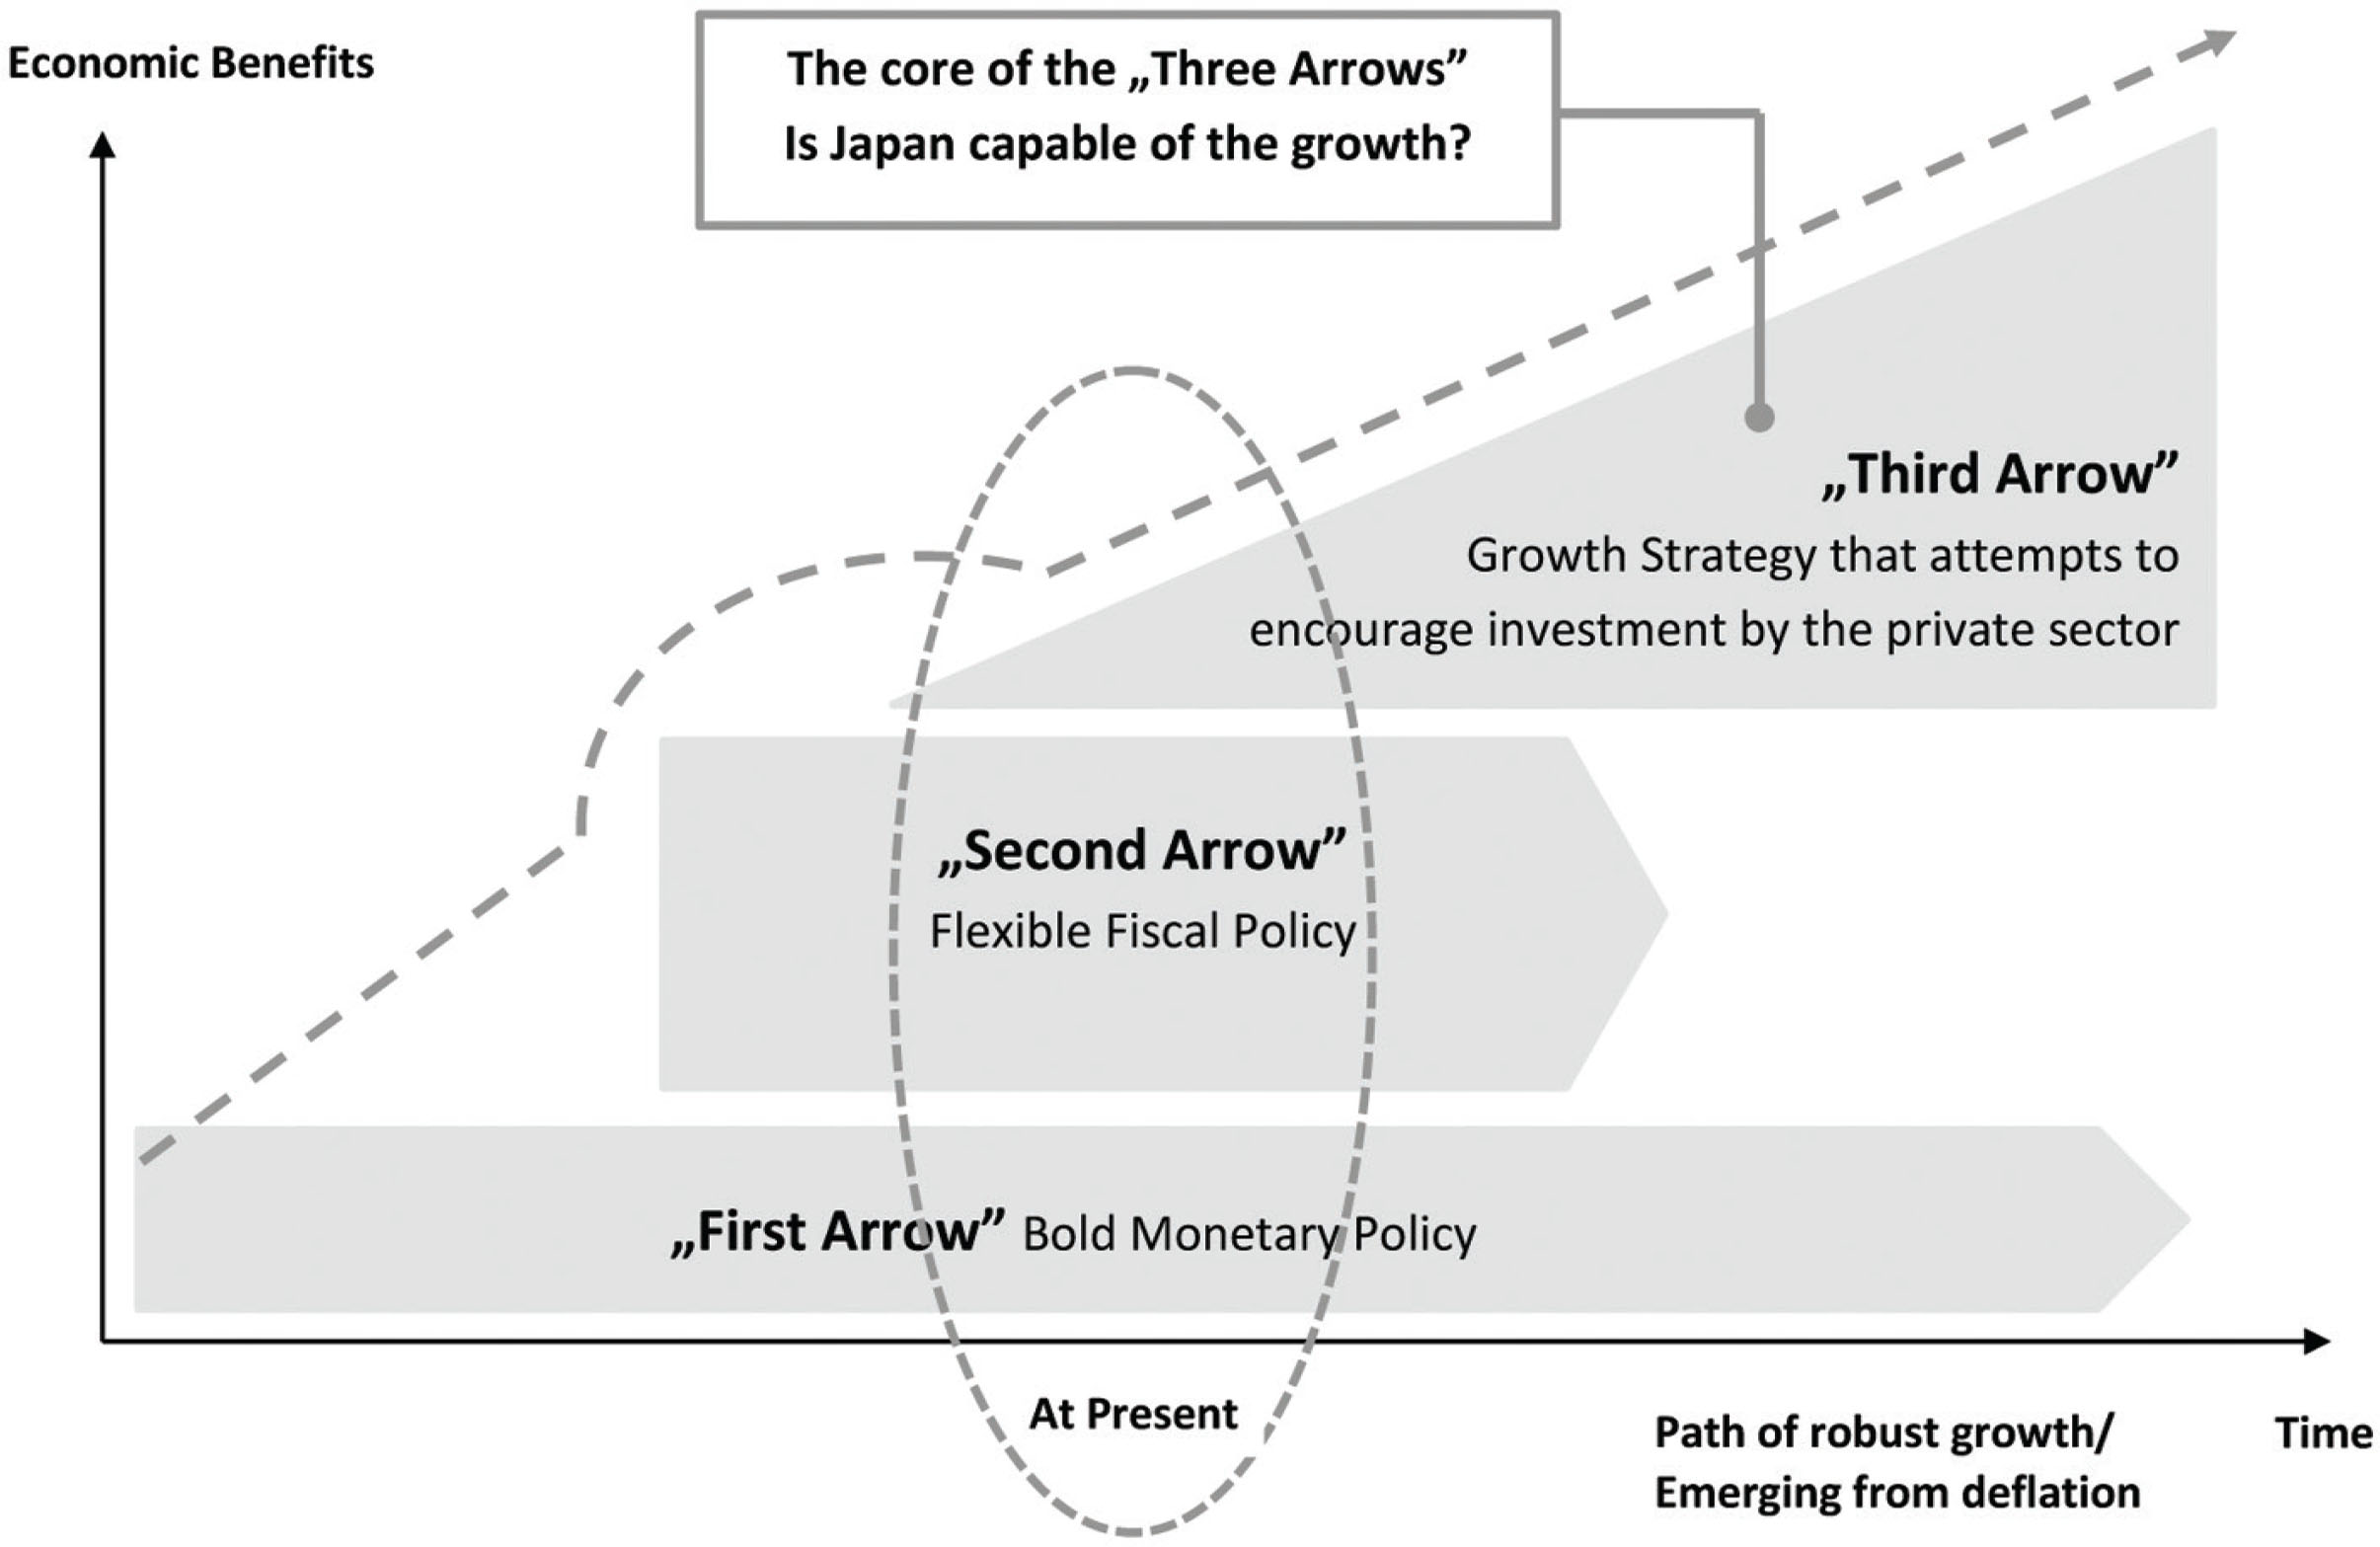
Figure 3
“Three-Arrows Strategy.”
Source: MUFG [2018, p. 5].
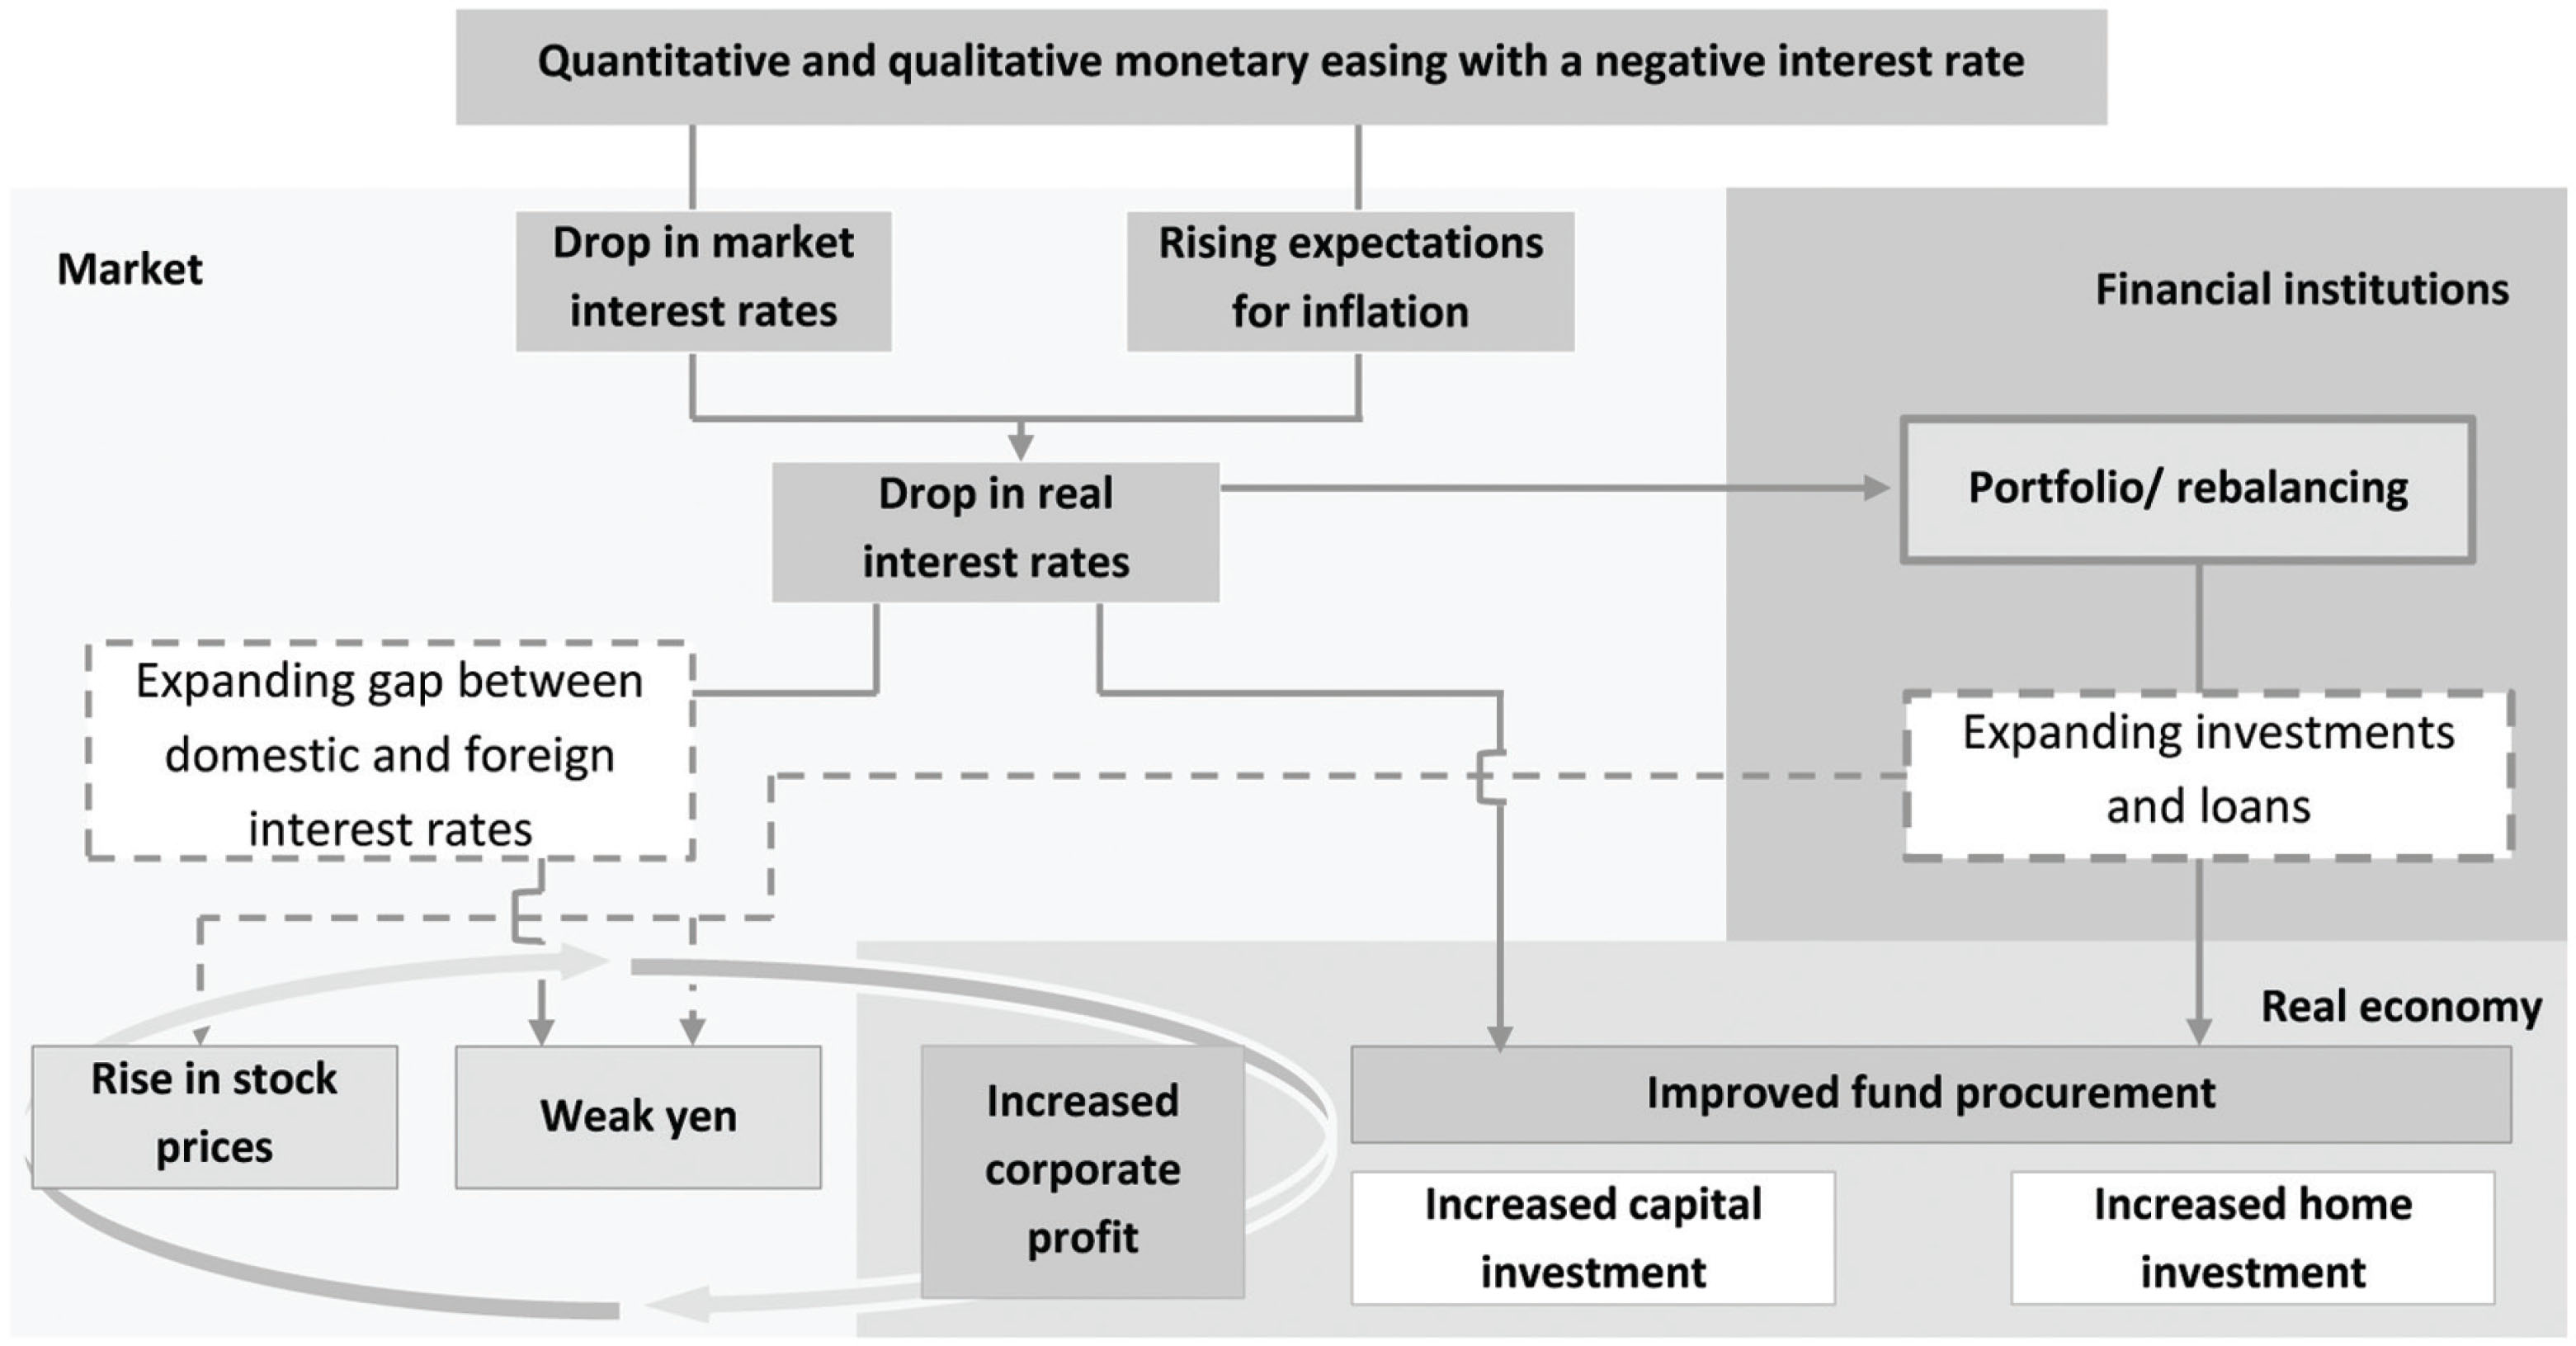
Figure 4
QQE system in Japan.
Source: MUFG [2018, p. 7].
Table 1
Japan: selected indicators, 2012–2017
| Year | Real GDP (in % change) | Output gap (in % change) | Business investment (in % change) | CPI deflator (in annual average) | Unemployment rate (in annual average) |
|---|---|---|---|---|---|
| 2012 | 1.5 | −3.7 | 4.1 | −0.1 | 4.3 |
| 2013 | 2.0 | −2.2 | 3.7 | 0.3 | 4.0 |
| 2014 | 0.4 | −2.6 | 5.4 | 2.8 | 3.6 |
| 2015 | 1.4 | −2.0 | 3.4 | 0.8 | 3.4 |
| 2016 | 1.0 | −1.8 | 0.6 | −0.1 | 3.1 |
| 2017 | 1.7 | −0.7 | 2.9 | 0.5 | 2.9 |
[i] Source:IMF [2018b, p. 5].
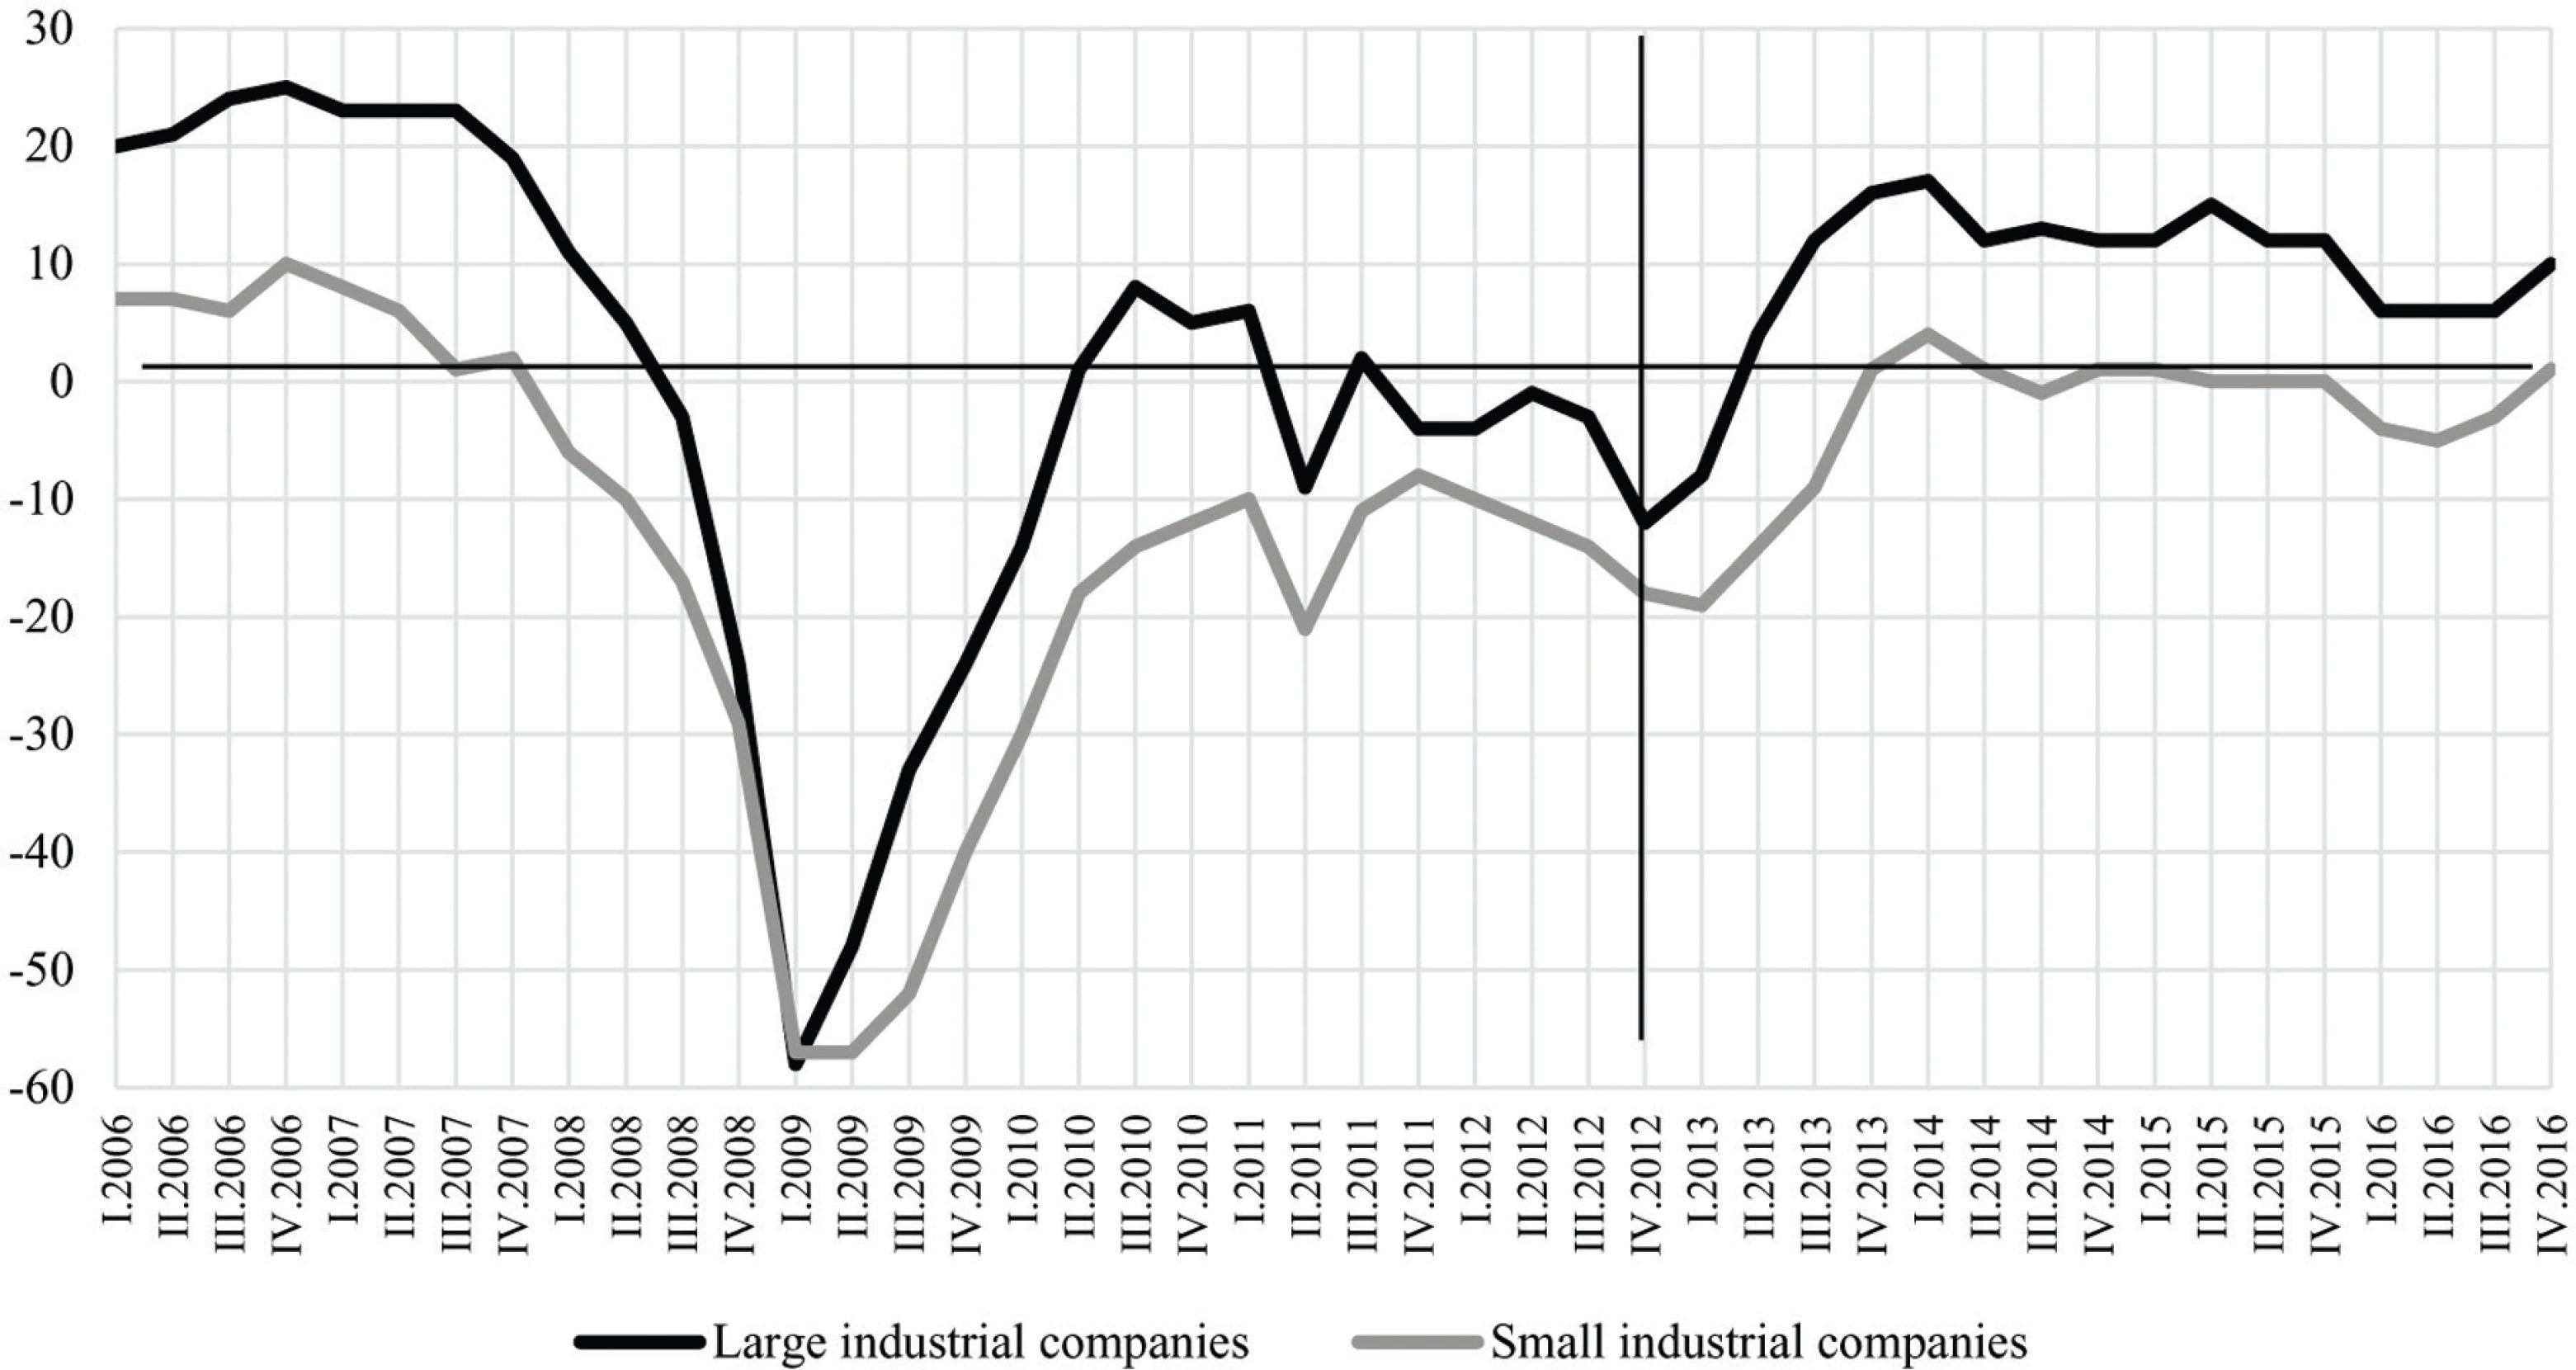
Figure 5
Tankan index for industrial companies.
Source: Own elaboration on the basis of [Bank of Japan].
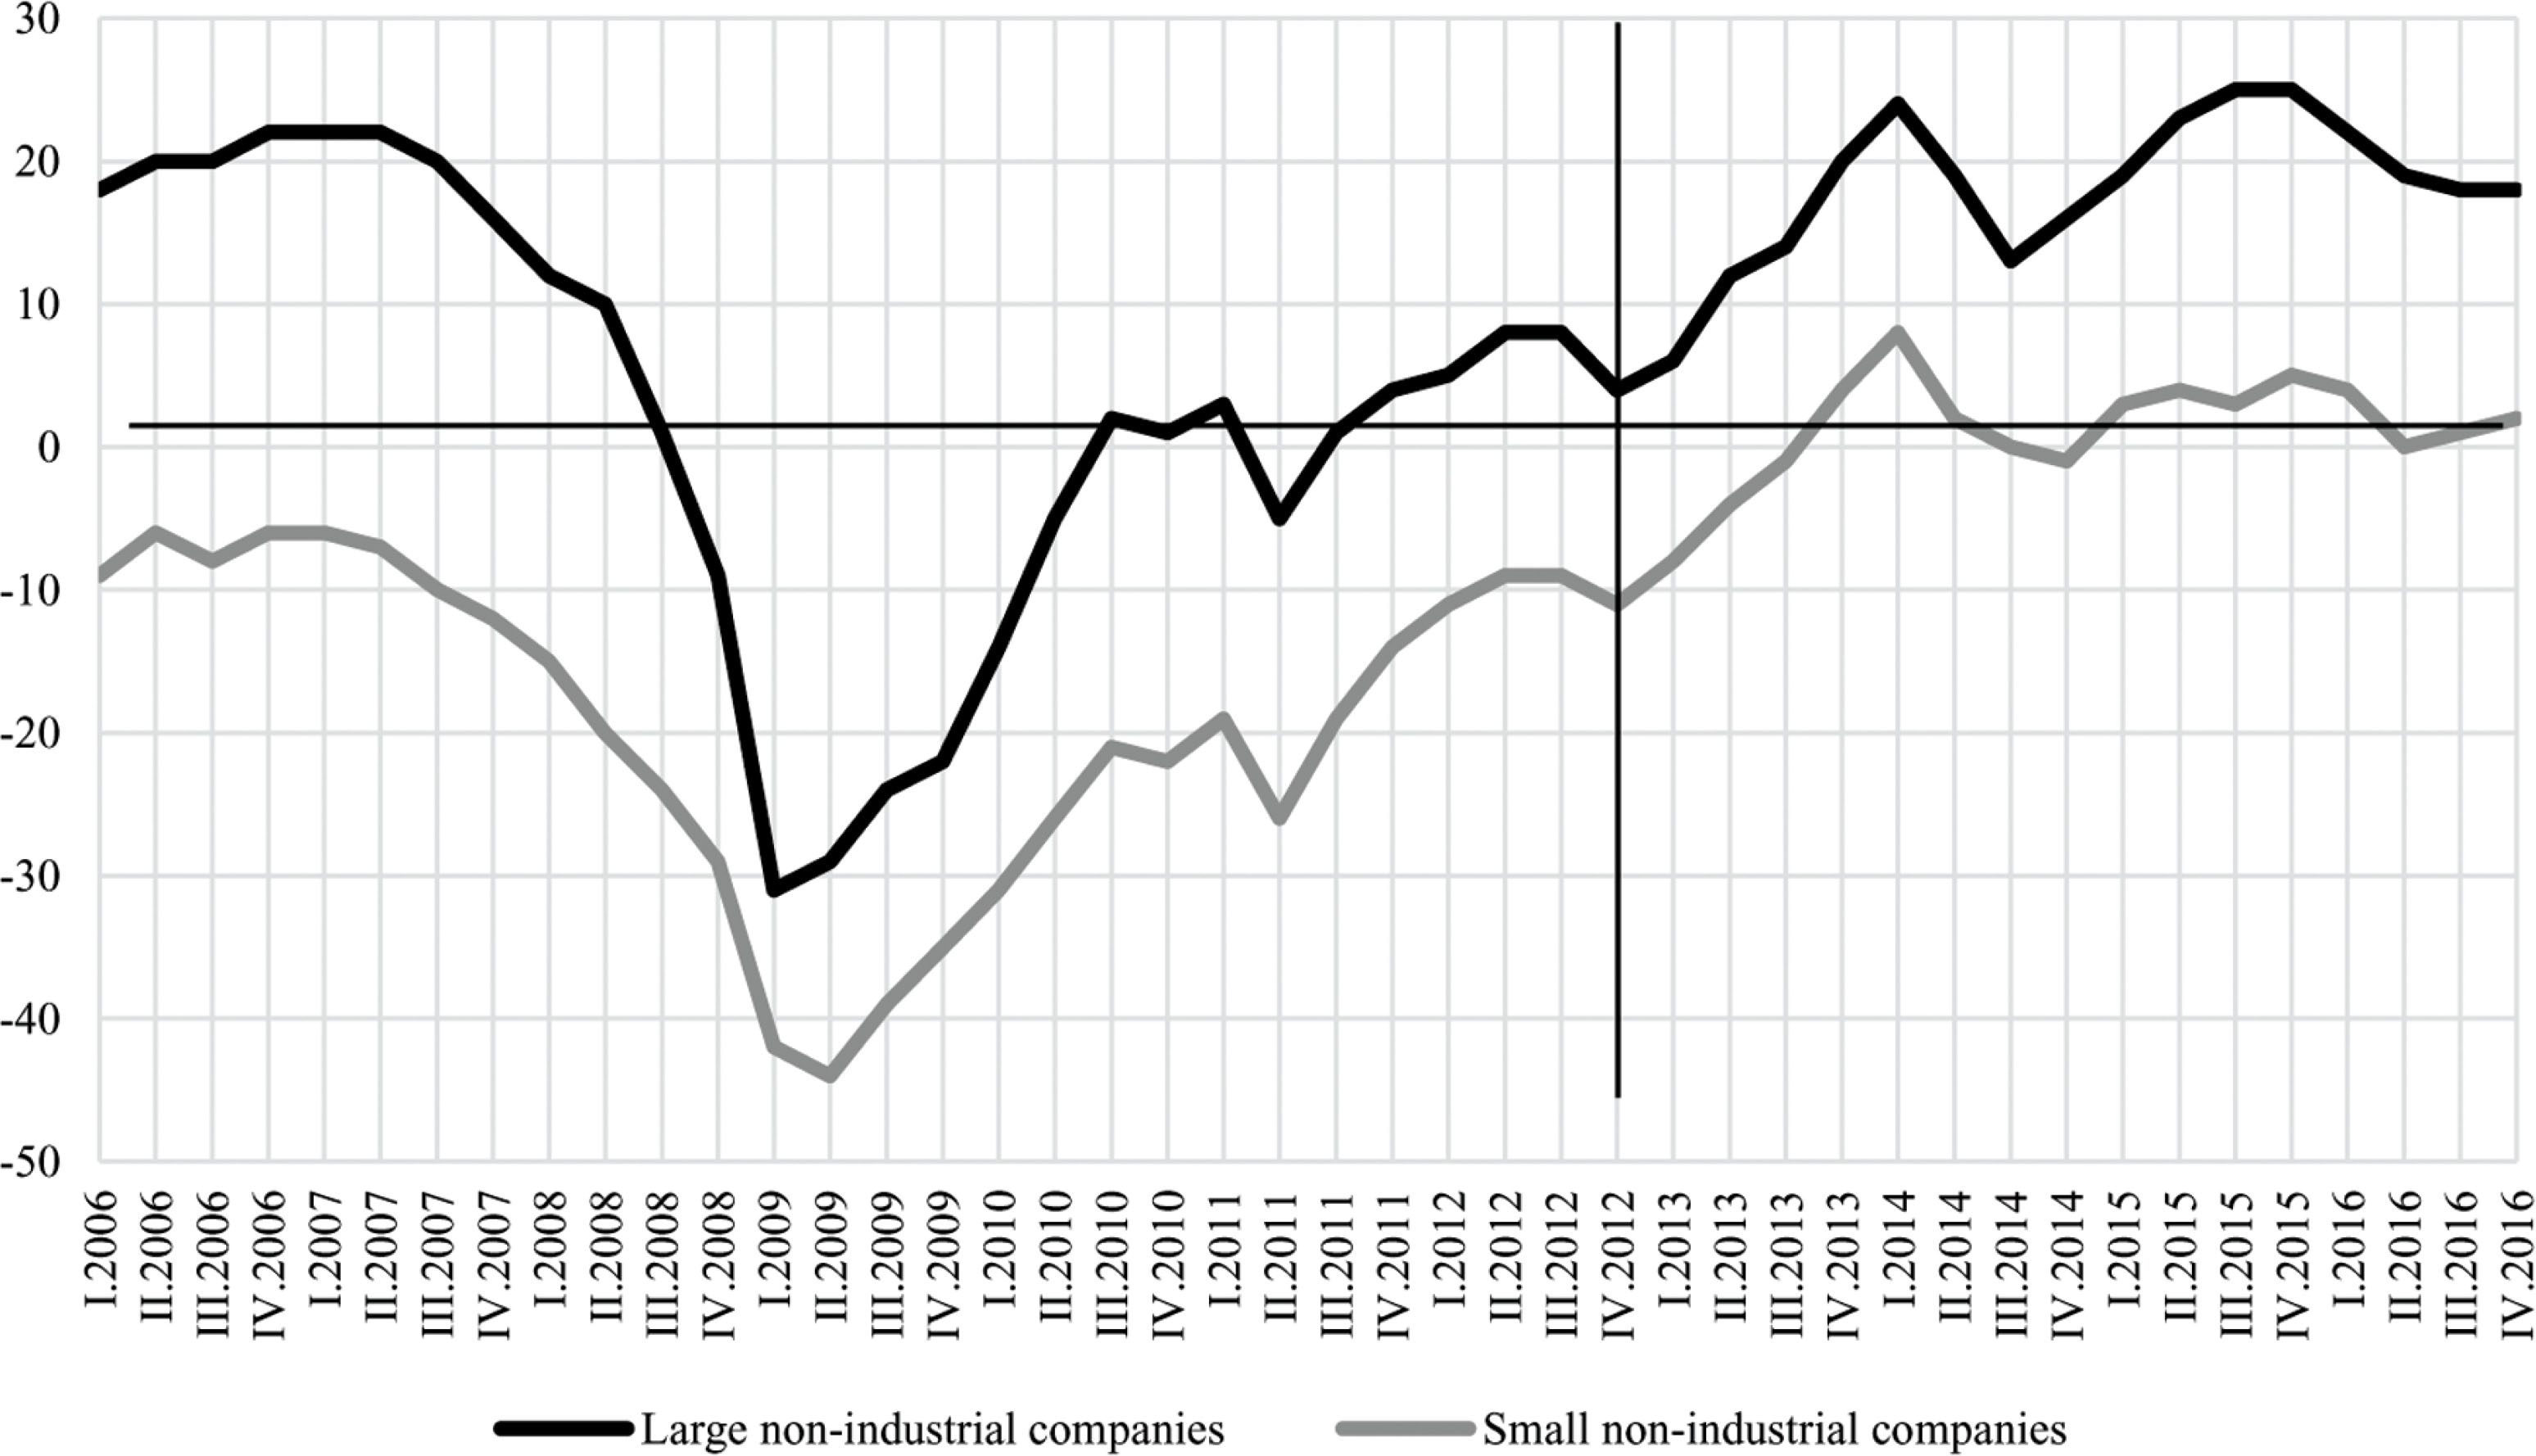
Figure 6
Tankan index for non-industrial companies.
Source: Own elaboration on the basis of [Bank of Japan].
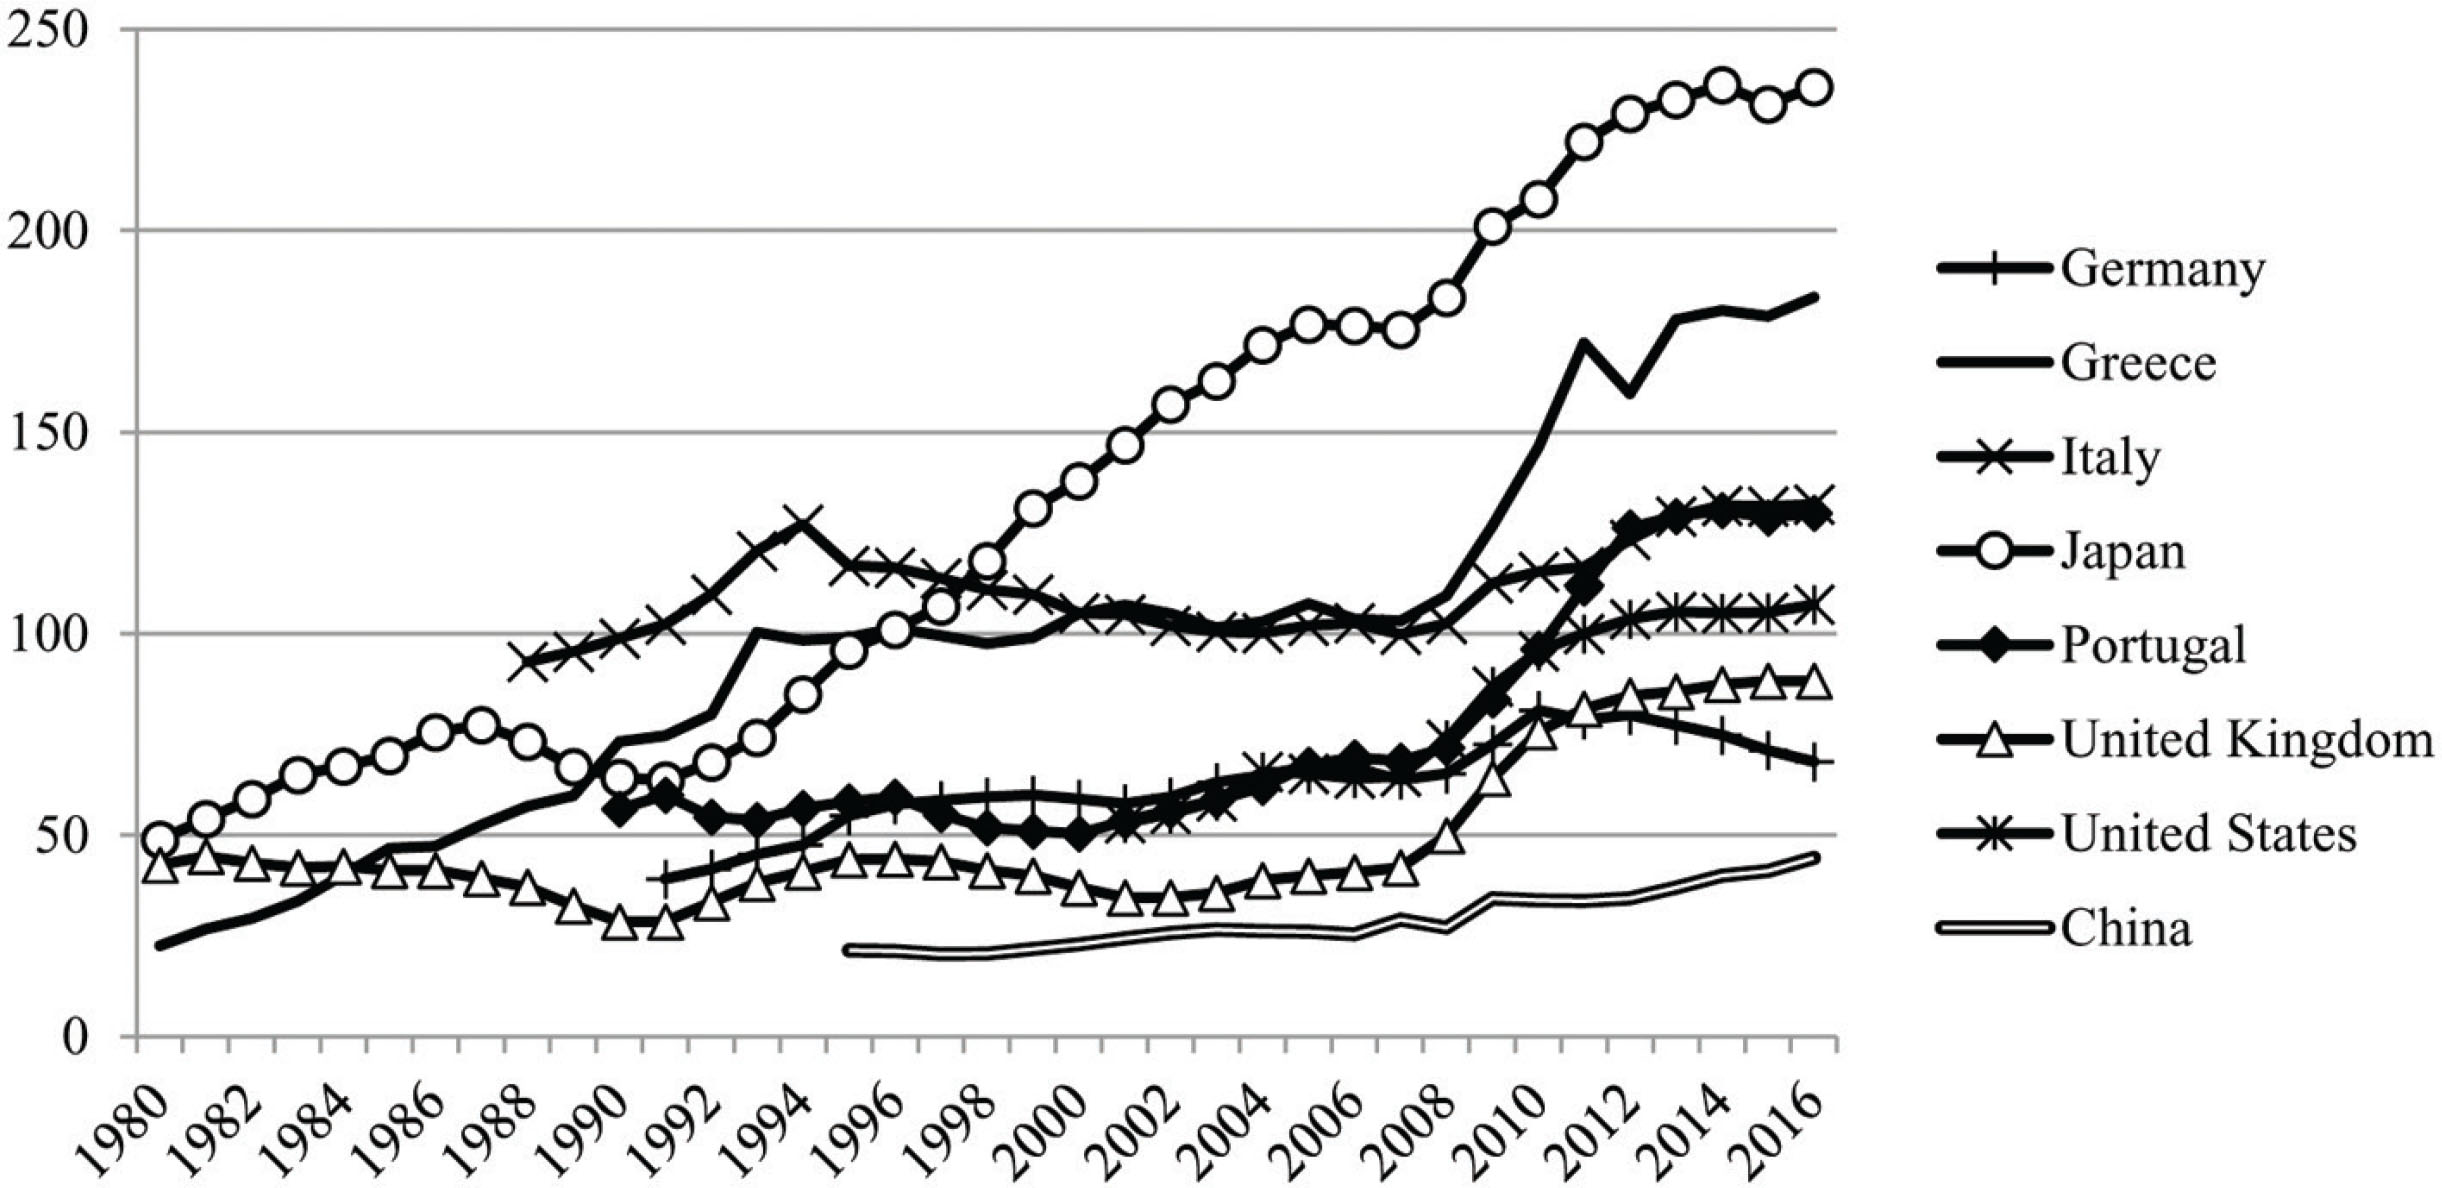
Figure 7
General government gross debt by country (% of nominal GDP).
Source: IMF [2018a].
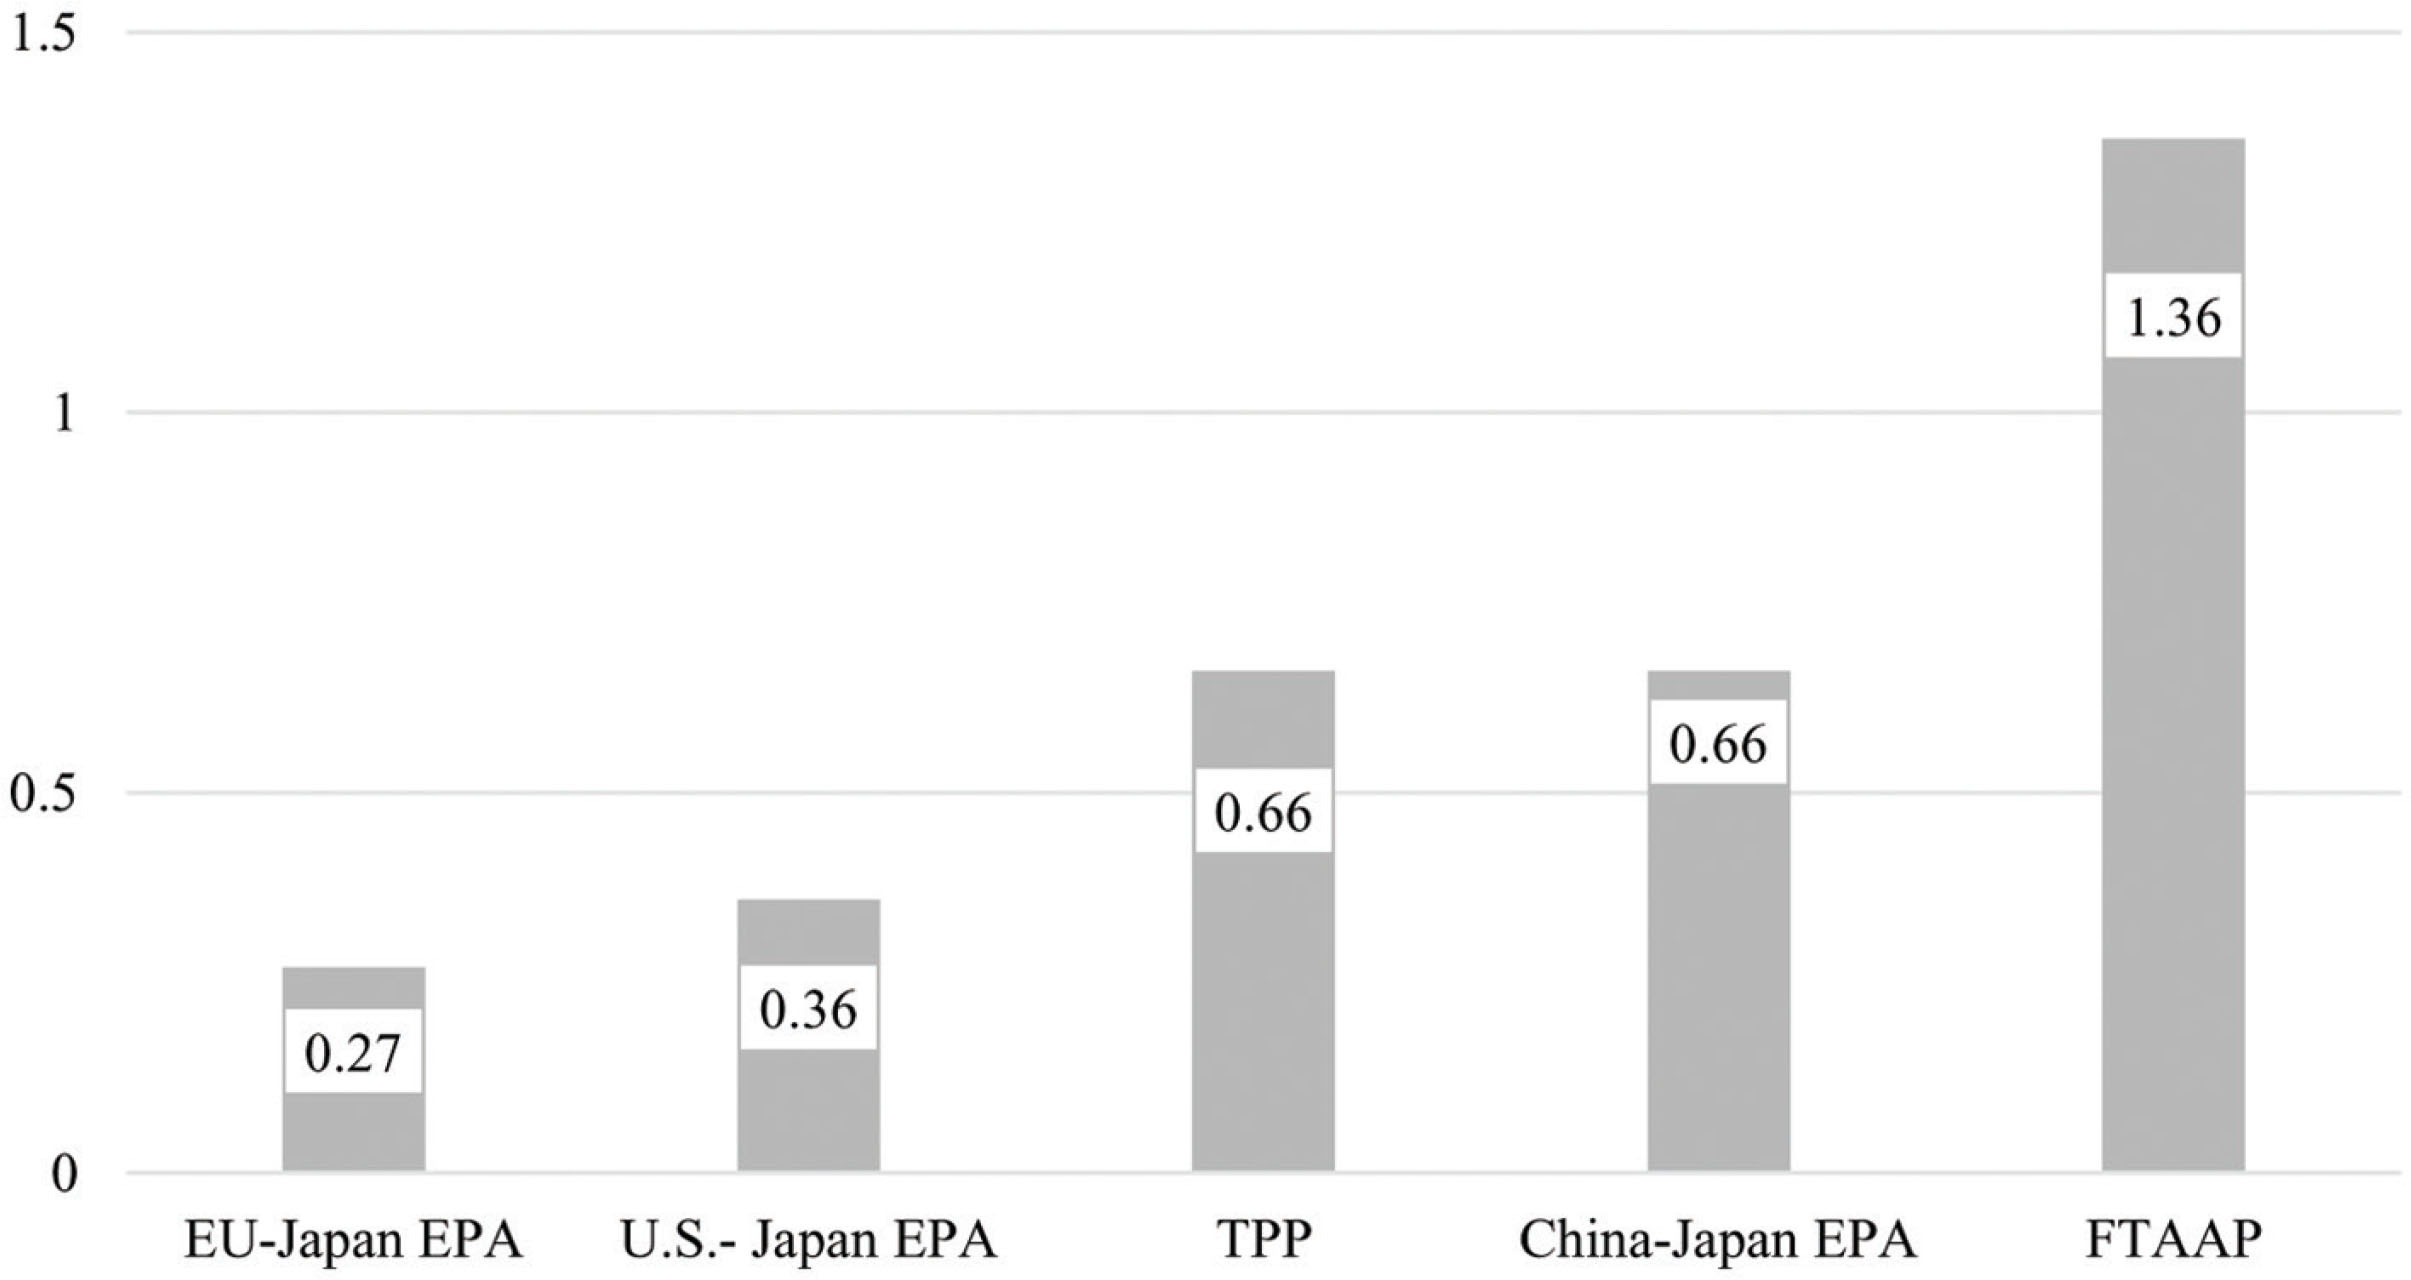
Figure 8
Projected effects of trade liberalization on real GDP (%).
Note: FTAAP denotes free trade area of the Asia-Pacific.
Source:MUFG [2018, p. 32].