
Table 1
Coefficients of similarity—financial system (2005)
| Country (2005) | Reference country | |||
|---|---|---|---|---|
| Germany | Spain | Sweden | The United Kingdom | |
| Bulgaria | 36.0 | 37.6 | 14.4 | 13.6 |
| Croatia | 60.8 | 59.9 | 35.7 | 32.1 |
| Czech Republic | 56.4 | 55.4 | 31.1 | 26.4 |
| Estonia | 56.7 | 51.1 | 42.7 | 20.4 |
| Hungary | 57.4 | 56.4 | 32.1 | 35.4 |
| Latvia | 56.8 | 55.9 | 31.7 | 33.3 |
| Lithuania | 62.9 | 57.2 | 39.0 | 27.2 |
| Poland | 49.7 | 48.8 | 27.0 | 28.0 |
| Romania | 46.5 | 45.7 | 21.7 | 24.5 |
| Slovakia | 50.3 | 49.4 | 25.2 | 26.2 |
| Slovenia | 62.0 | 61.1 | 36.8 | 37.3 |
[i] Own calculations.
Table 2
Coefficients of similarity—financial system (2014)
| Country (2014) | Reference country | |||
|---|---|---|---|---|
| Germany | Spain | Sweden | The United Kingdom | |
| Bulgaria | 45.2 | 48.4 | 12.7 | 24.1 |
| Croatia | 72.8 | 66.9 | 36.5 | 33.8 |
| Czech Republic | 61.0 | 64.2 | 24.4 | 23.0 |
| Estonia | 72.4 | 66.5 | 35.0 | 28.1 |
| Hungary | 61.6 | 63.8 | 25.2 | 29.1 |
| Latvia | 61.0 | 64.3 | 24.6 | 34.9 |
| Lithuania | 59.9 | 56.6 | 25.7 | 21.8 |
| Poland | 59.7 | 62.9 | 24.0 | 30.4 |
| Romania | 47.5 | 50.7 | 12.3 | 21.0 |
| Slovakia | 67.5 | 67.4 | 31.9 | 22.6 |
| Slovenia | 52.3 | 55.5 | 15.3 | 22.2 |
[i] Own calculations.
Table 3
Change of the coefficients of similarity between 2005 and 2014—financial system (percentage points)
| Country | Reference country | |||
|---|---|---|---|---|
| Germany | Spain | Sweden | The United Kingdom | |
| Bulgaria | 9.2 | 10.8 | –1.7 | 10.5 |
| Croatia | 12.0 | 7.0 | 0.8 | 1.7 |
| Czech Republic | 4.6 | 8.8 | –6.7 | –3.4 |
| Estonia | 15.7 | 15.4 | –7.7 | 7.7 |
| Hungary | 4.2 | 7.4 | –6.9 | –6.3 |
| Latvia | 4.2 | 8.4 | –7.1 | 1.6 |
| Lithuania | –3.0 | –0.6 | –13.3 | –5.4 |
| Poland | 10.0 | 14.1 | –3.0 | 2.4 |
| Romania | 1.0 | 5.0 | –9.4 | –3.5 |
| Slovakia | 17.2 | 18.0 | 6.7 | –3.6 |
| Slovenia | –9.7 | –5.6 | –21.5 | –15.1 |
[i] Own calculations.
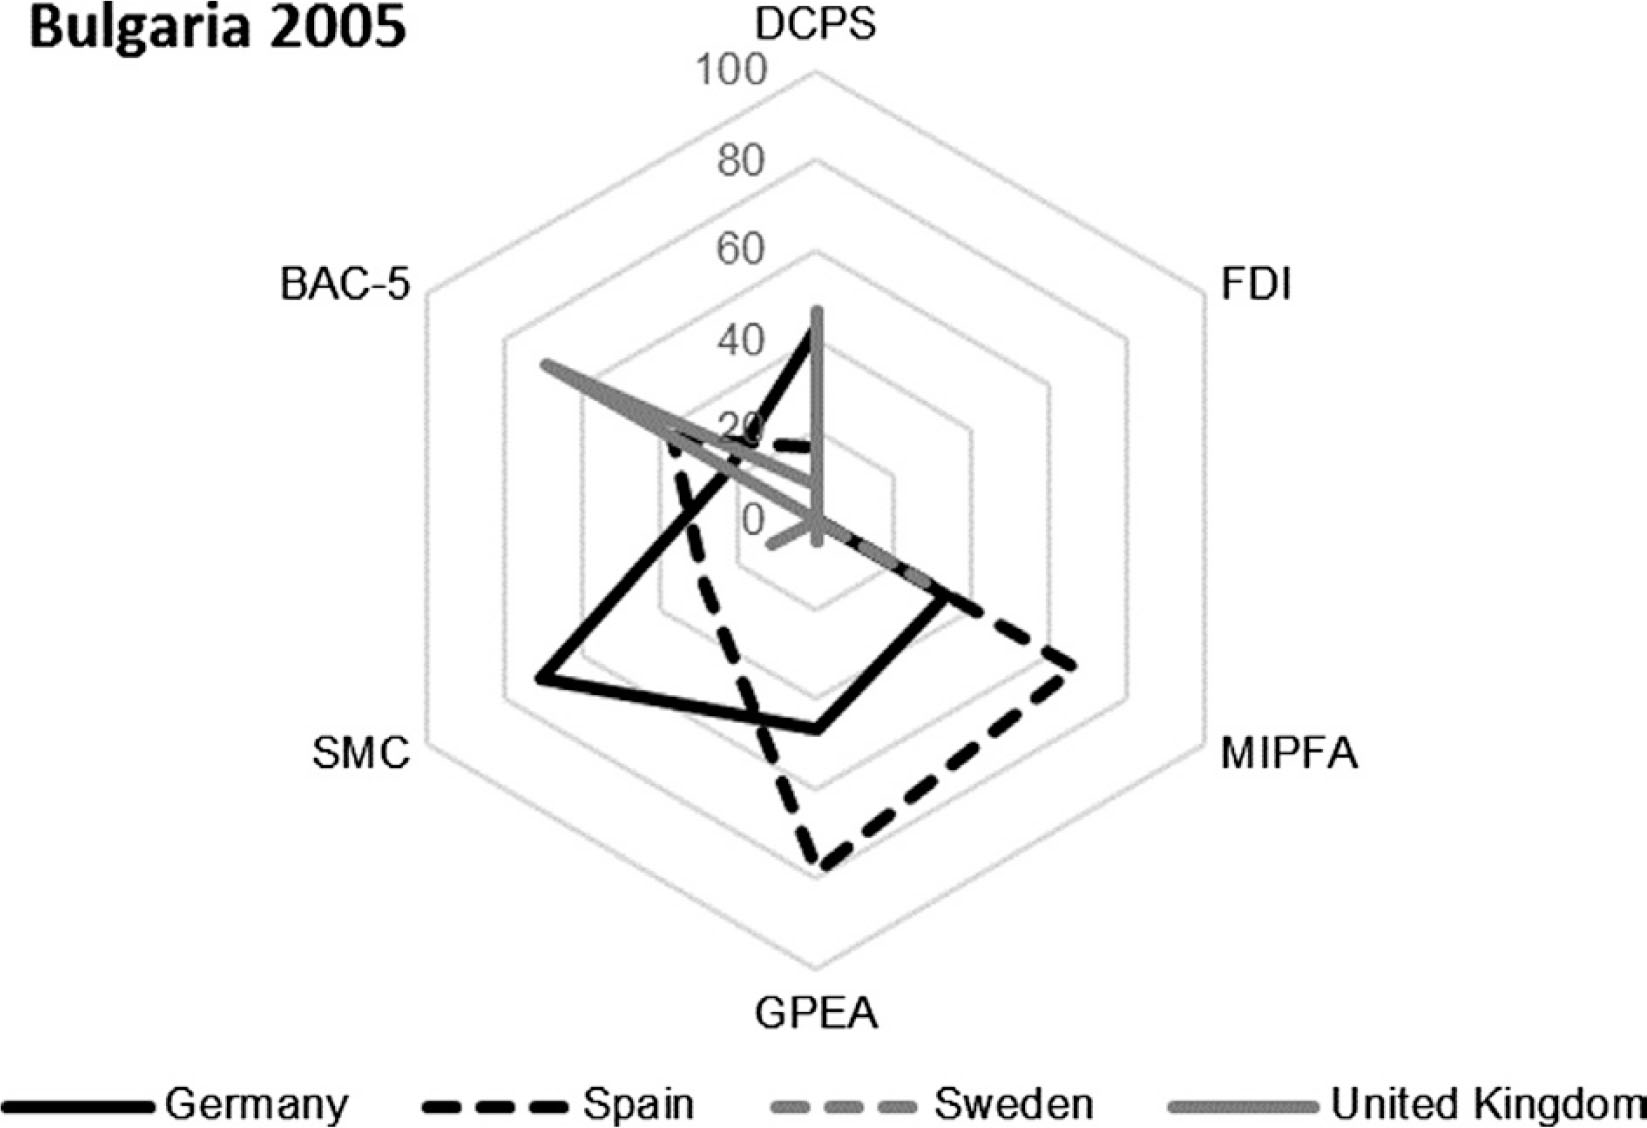
Figure A1
The hexagon for Bulgaria (year 2005).
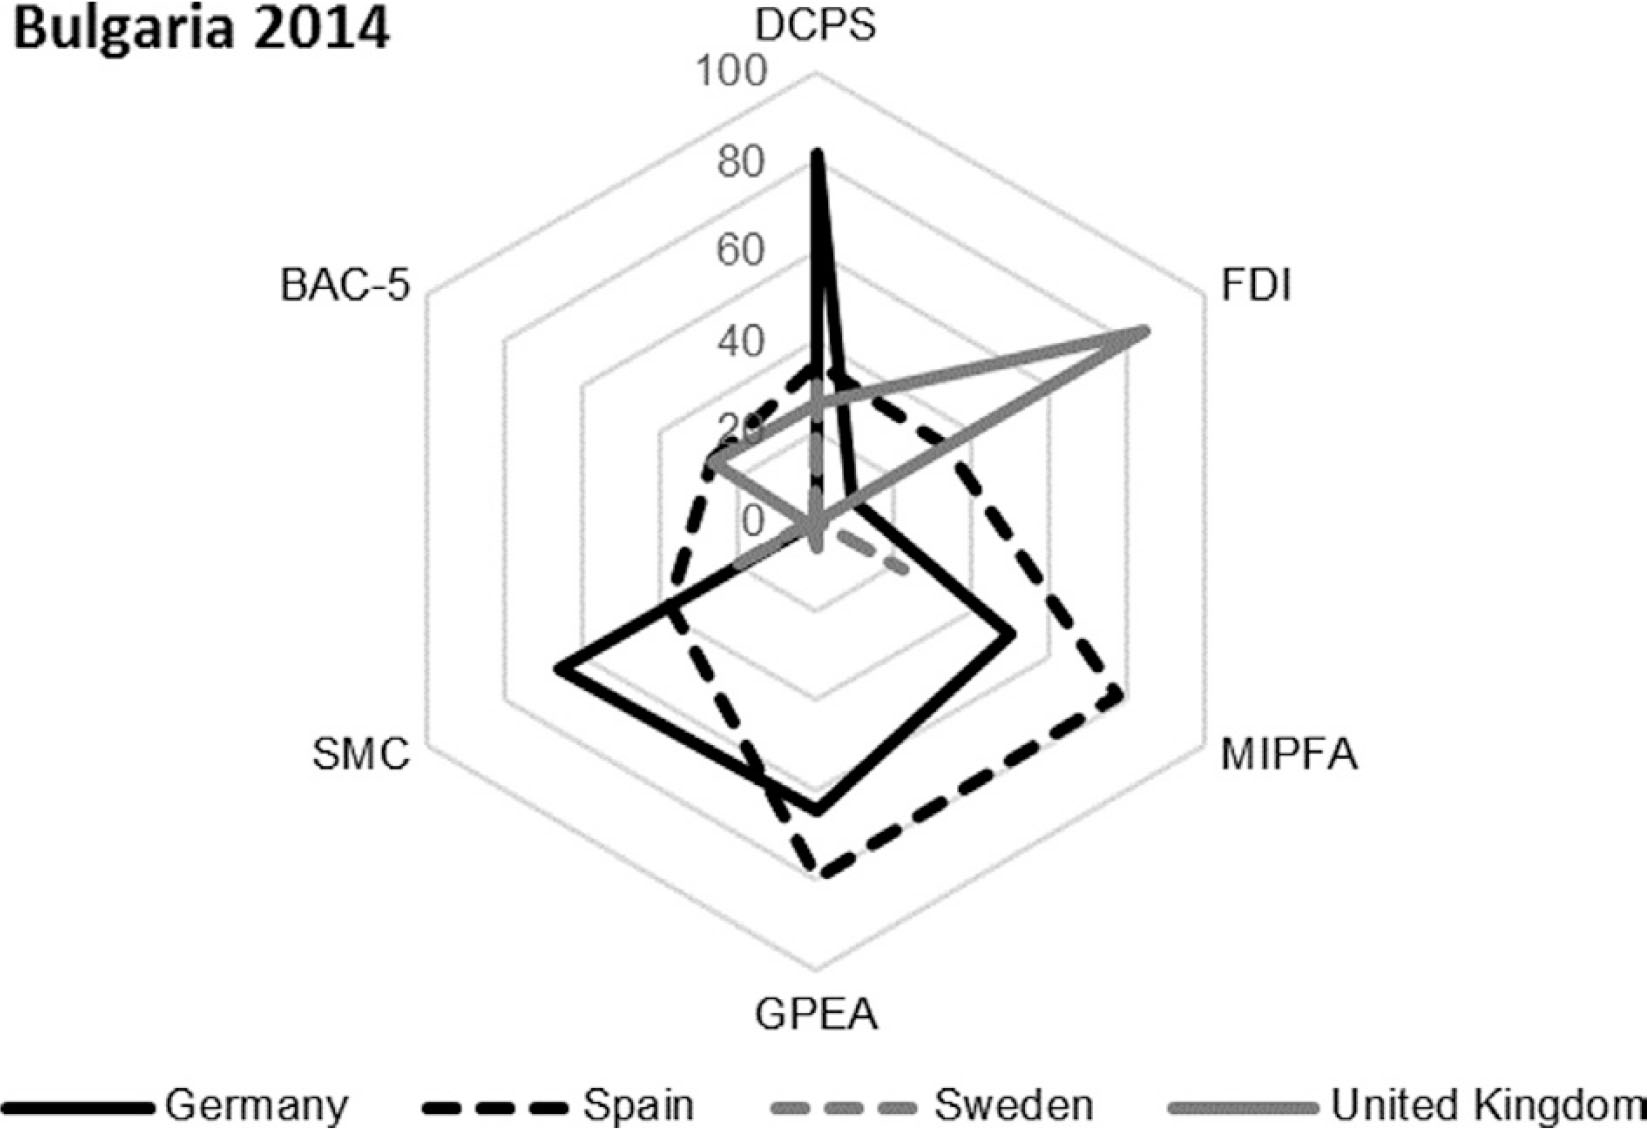
Figure A2
The hexagon for Bulgaria (year 2014).
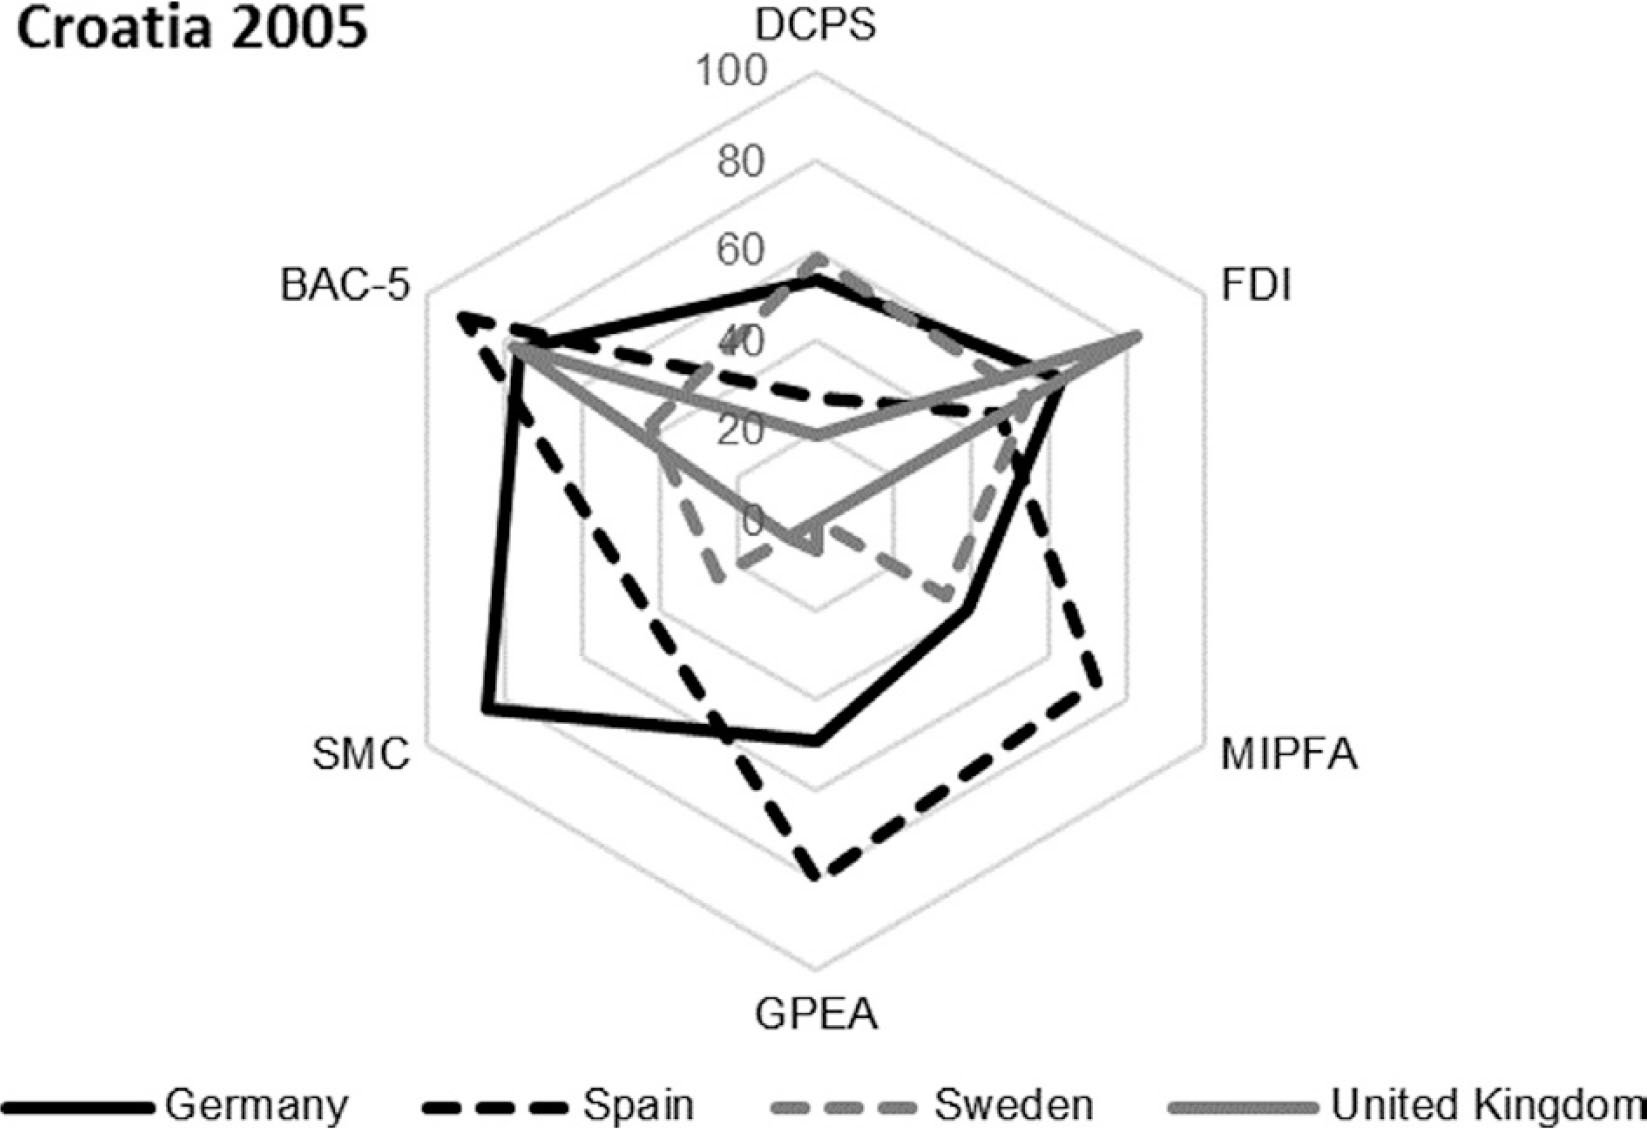
Figure A3
The hexagon for Croatia (year 2005).
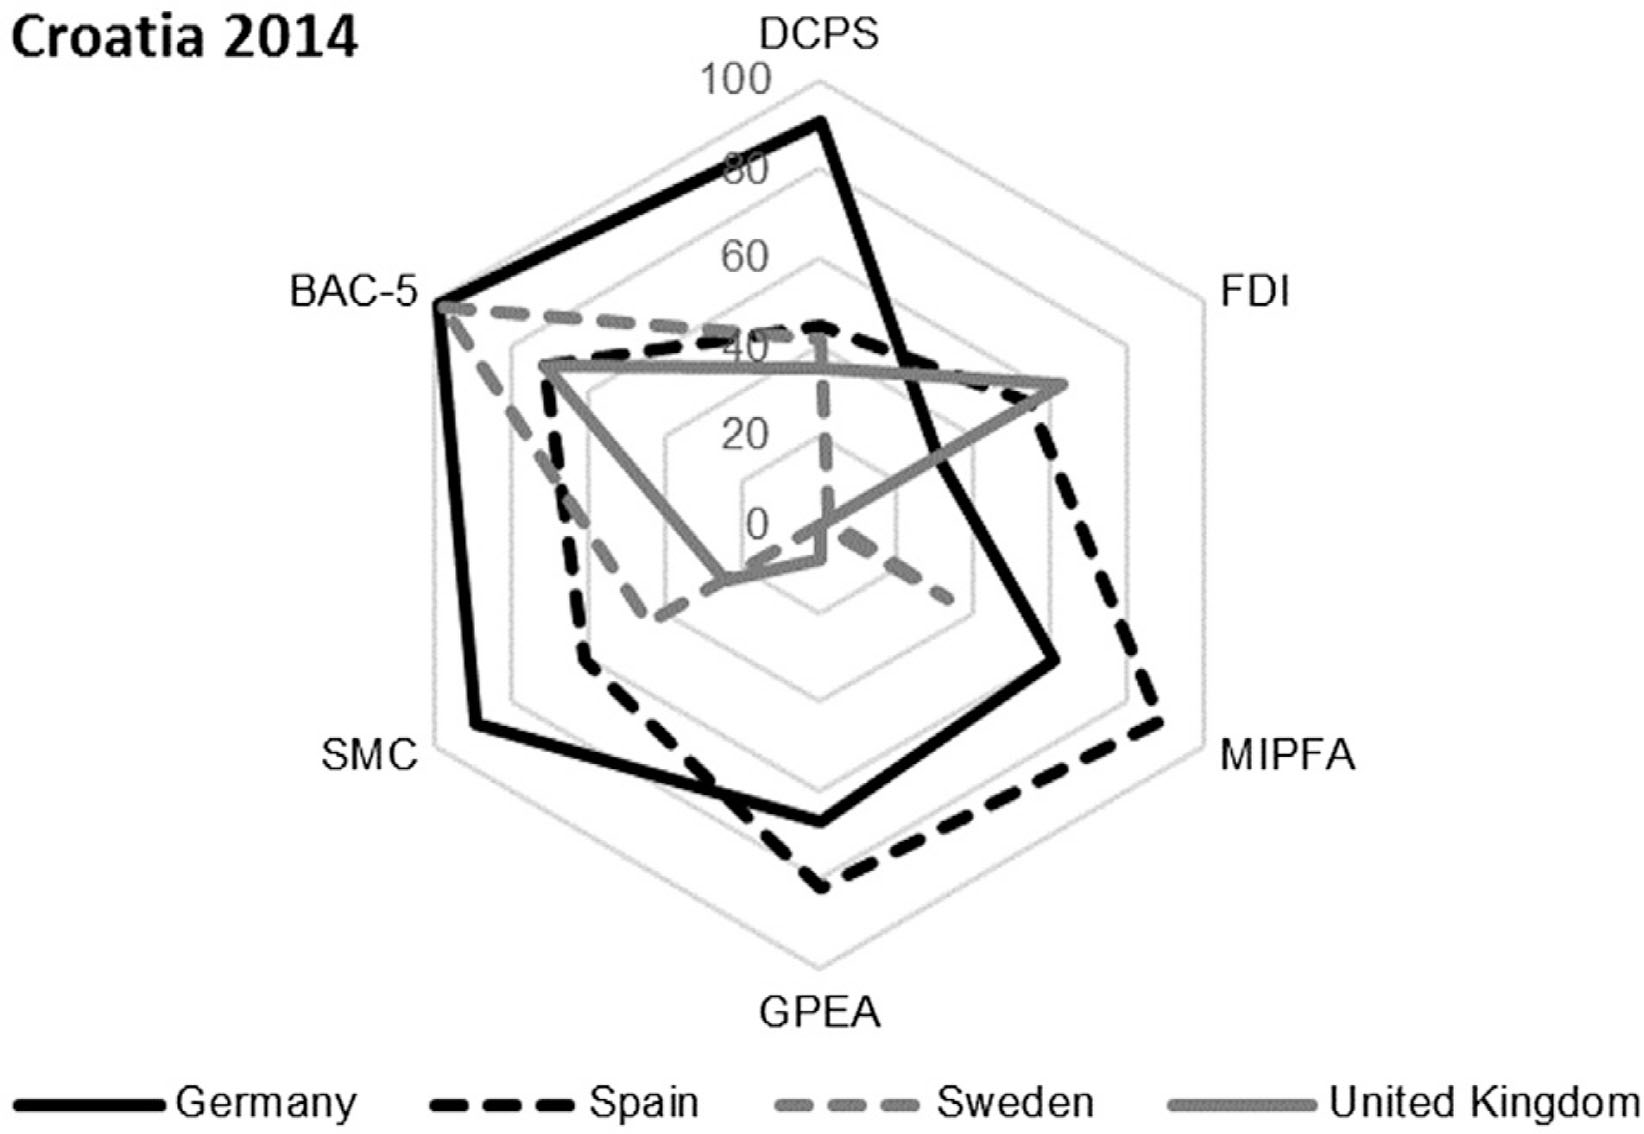
Figure A4
The hexagon for Croatia (year 2014).
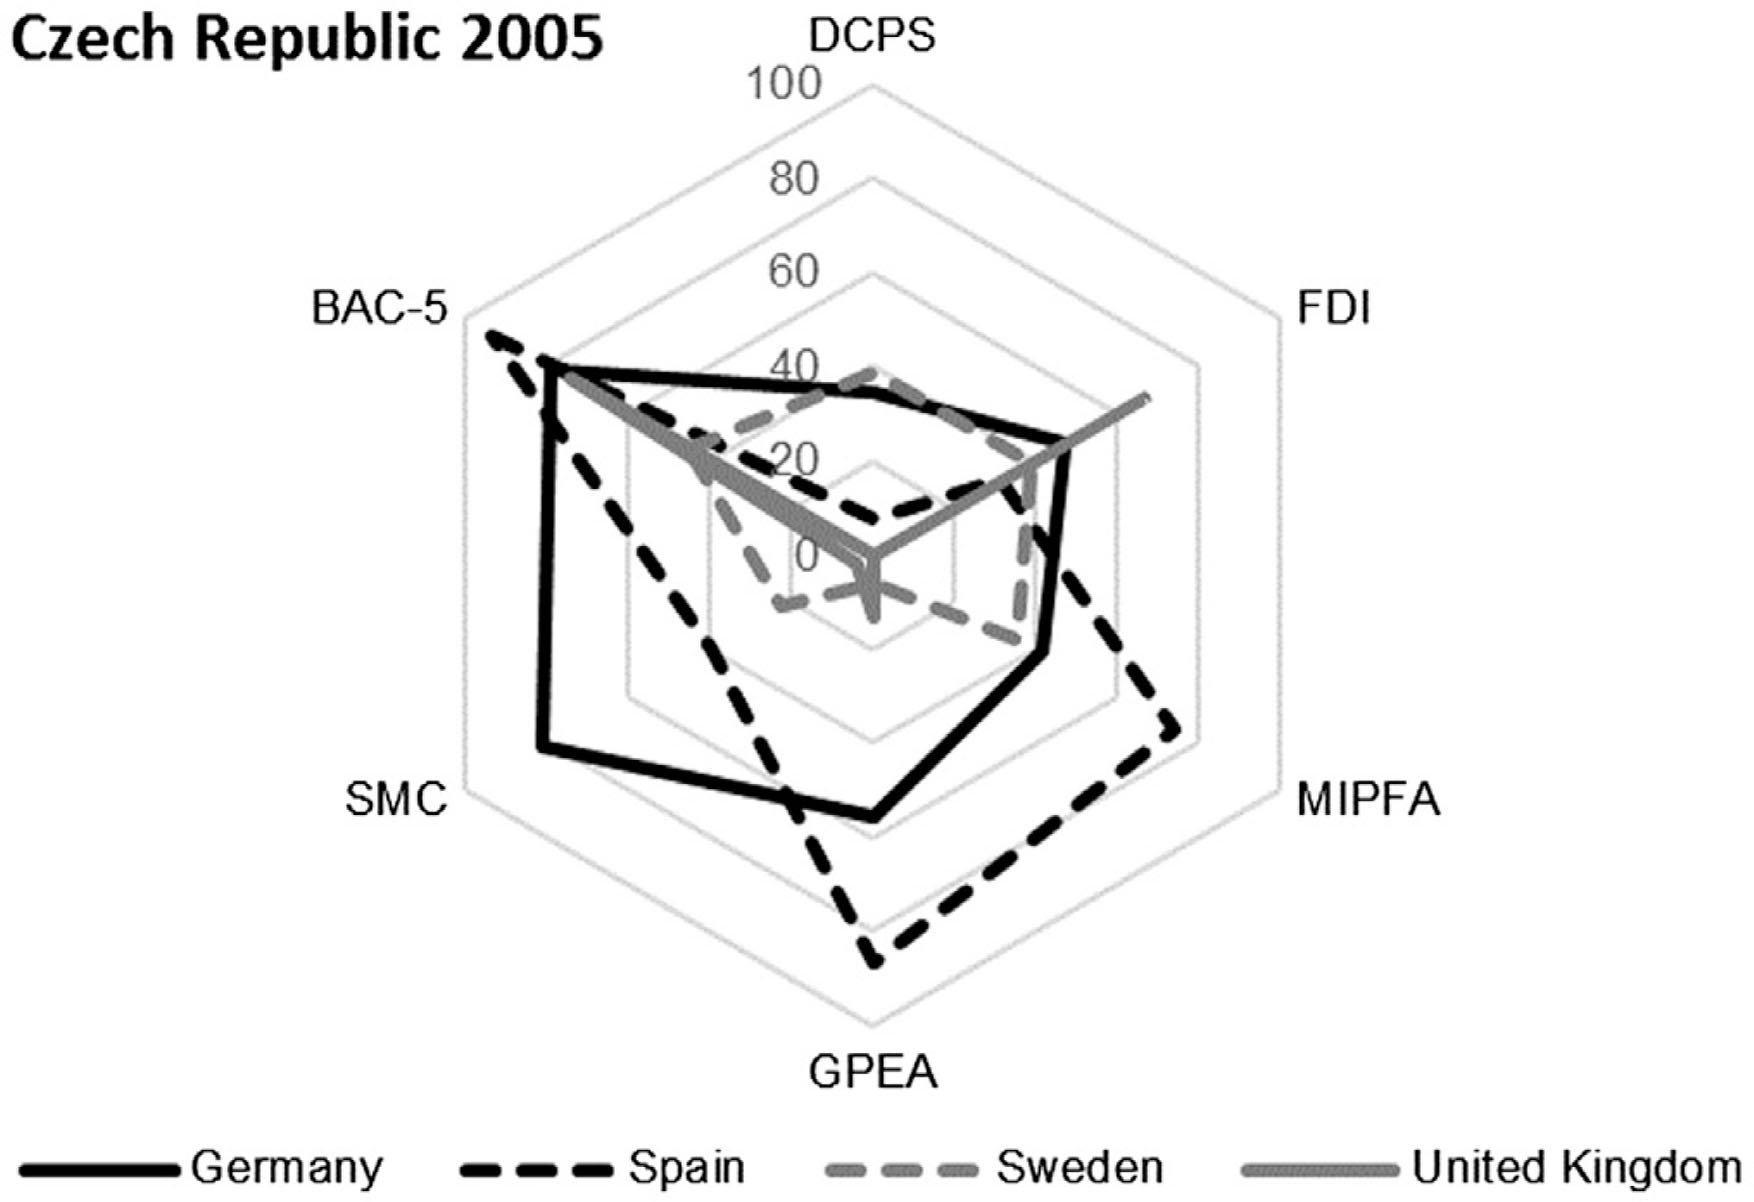
Figure A5
The hexagon for Czech Republic (year 2005).
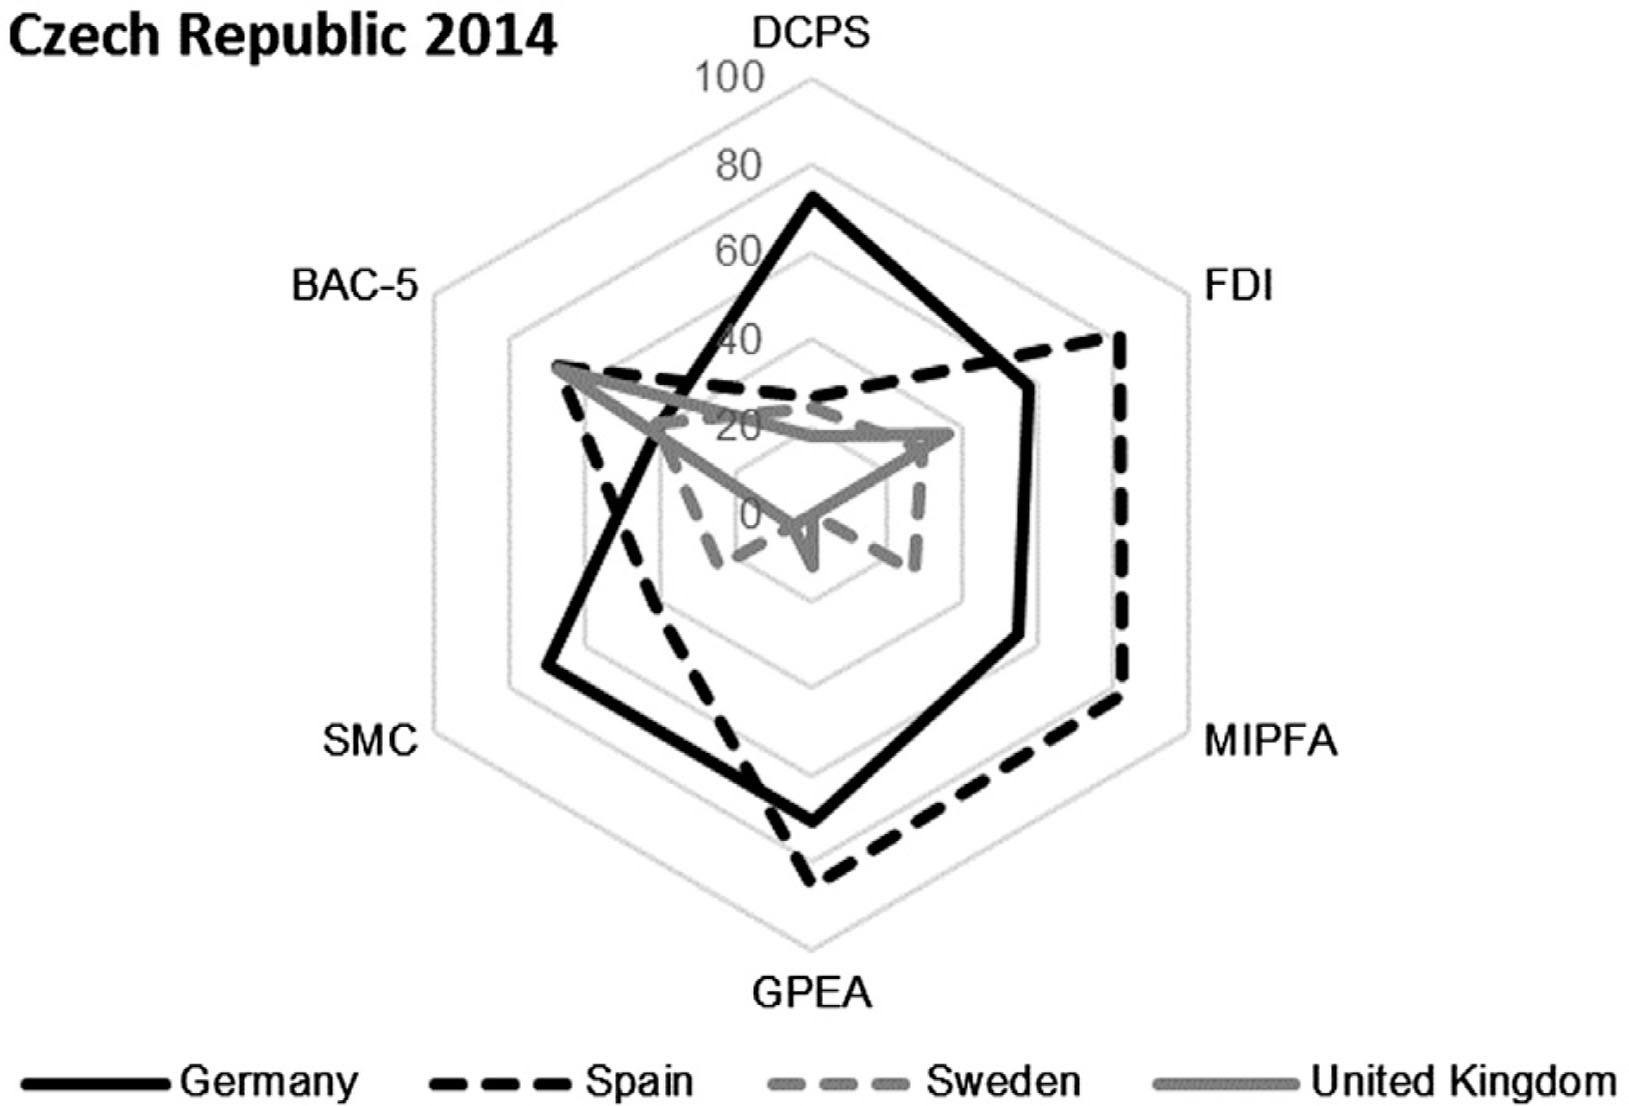
Figure A6
The hexagon for Czech Republic (year 2014).
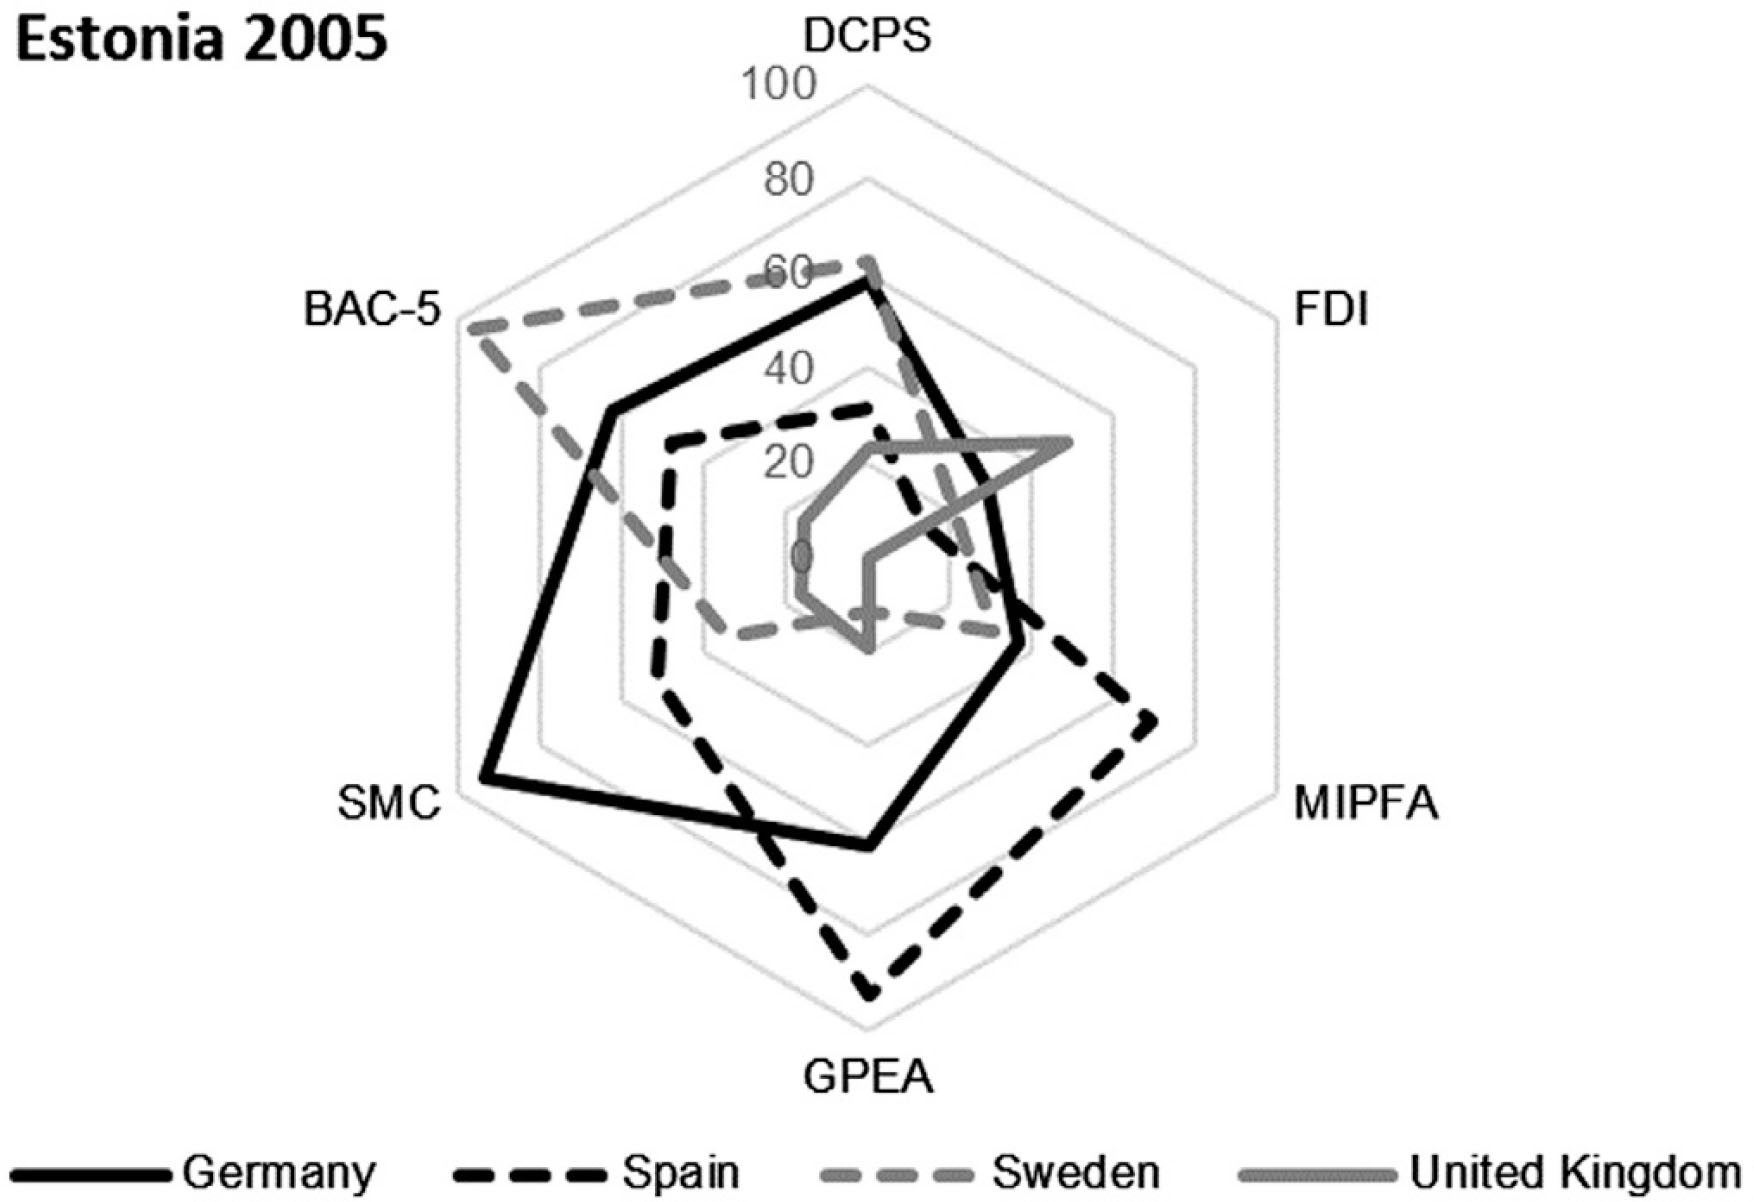
Figure A7
The hexagon for Estonia (year 2005).
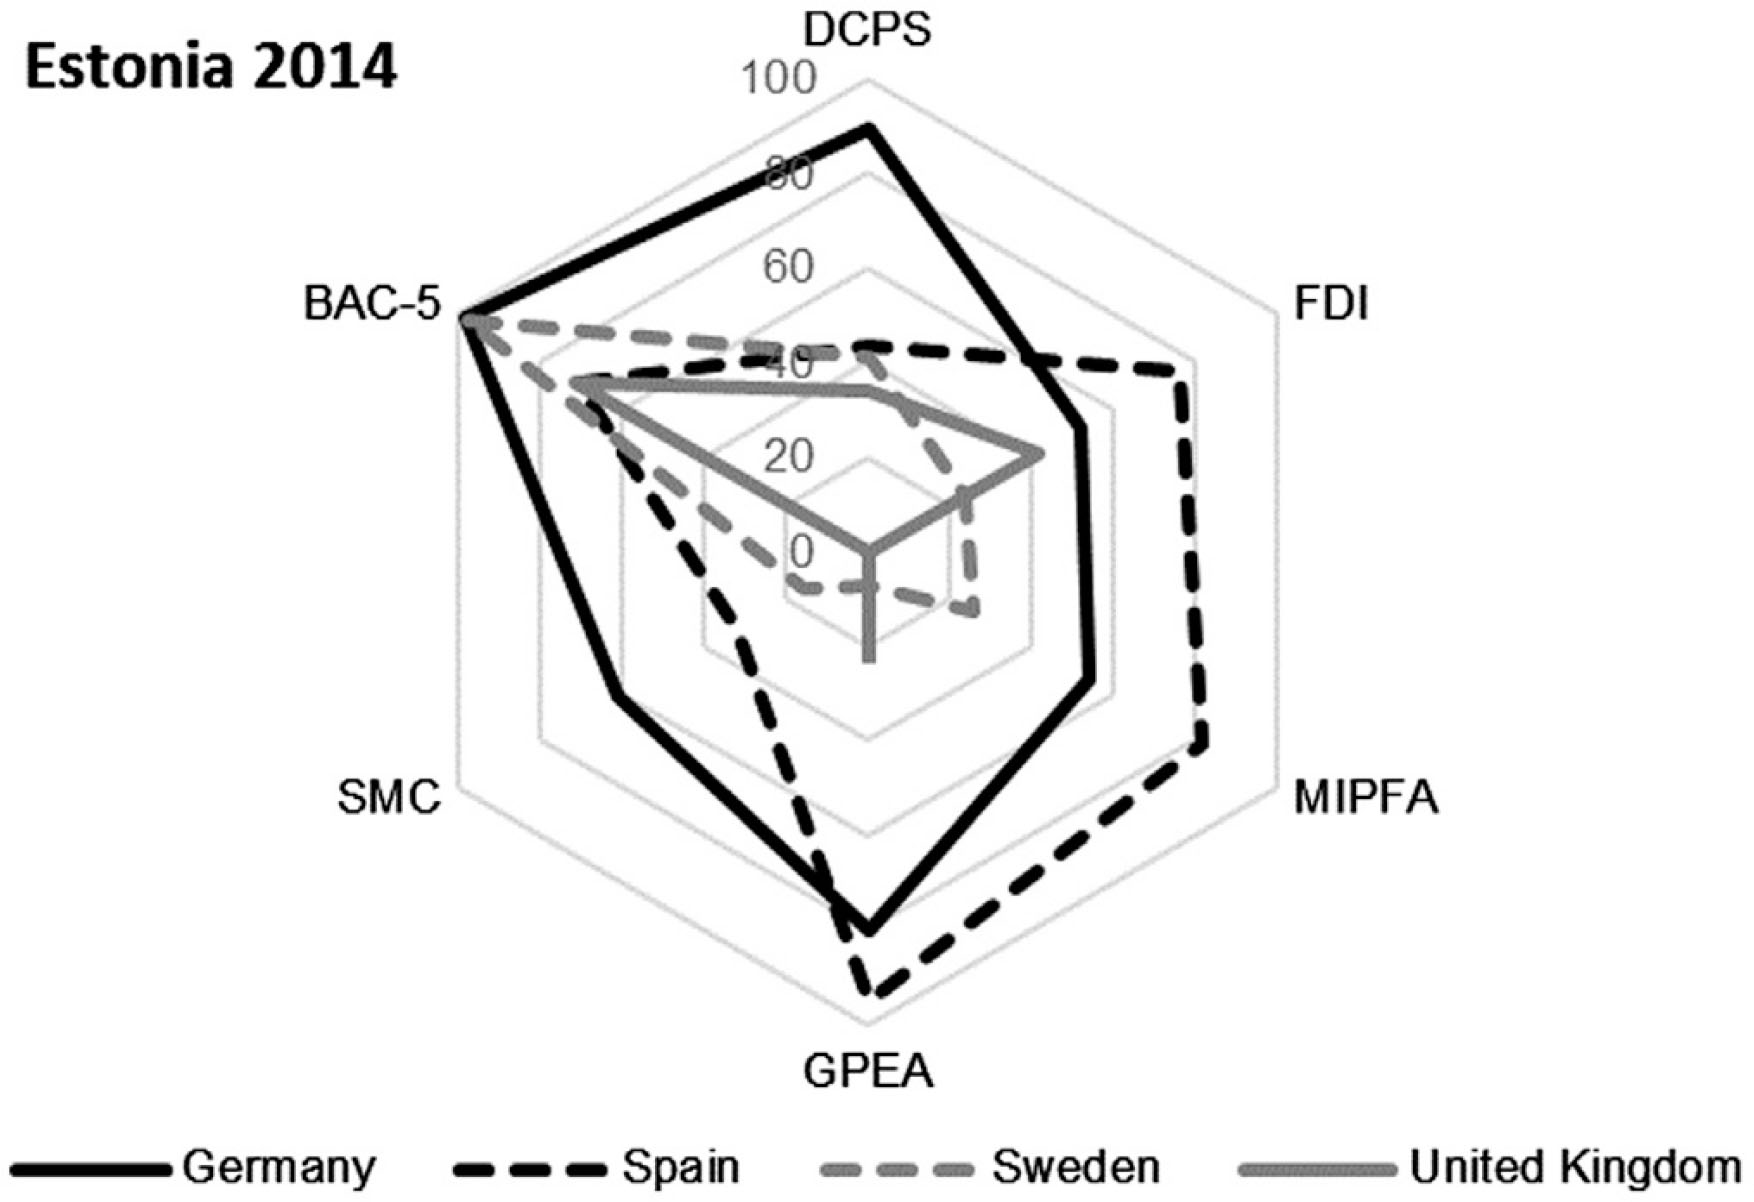
Figure A8
The hexagon for Estonia (year 2014).
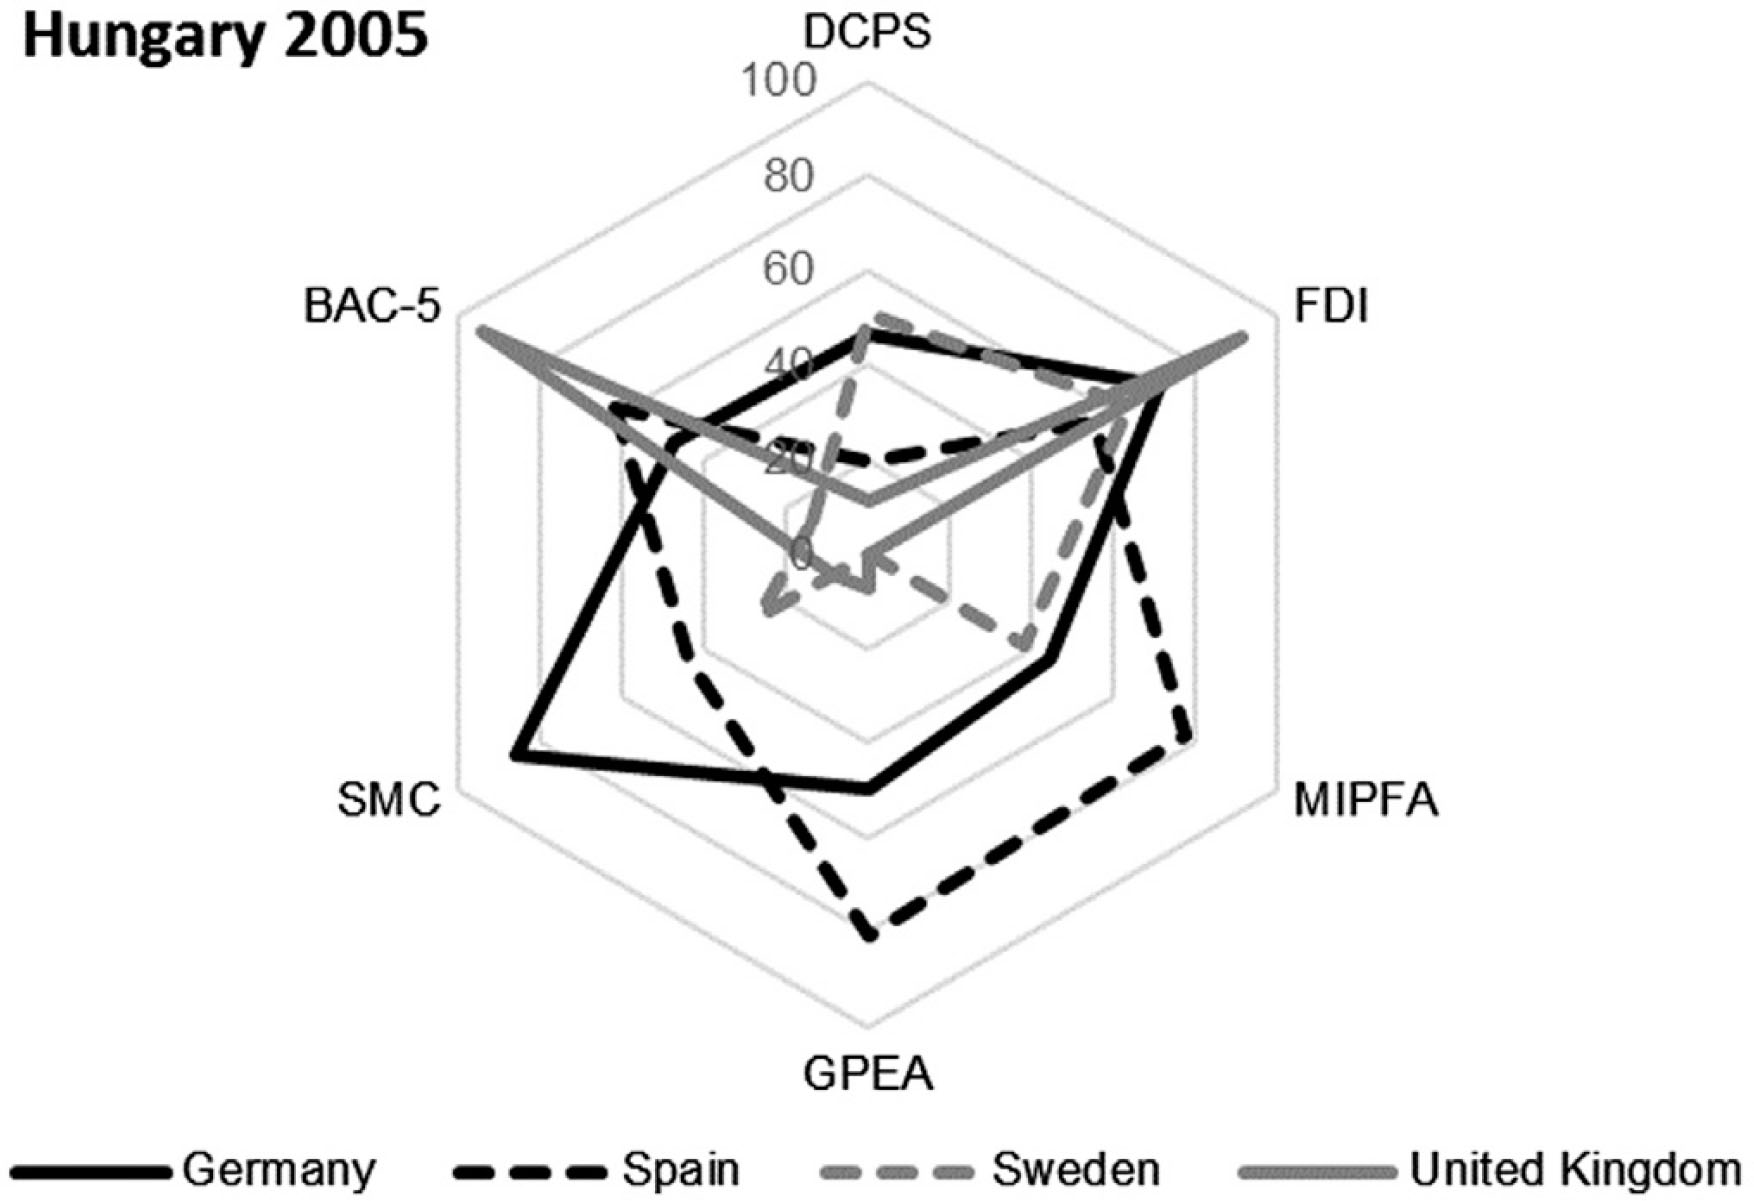
Figure A9
The hexagon for Hungary (year 2005).
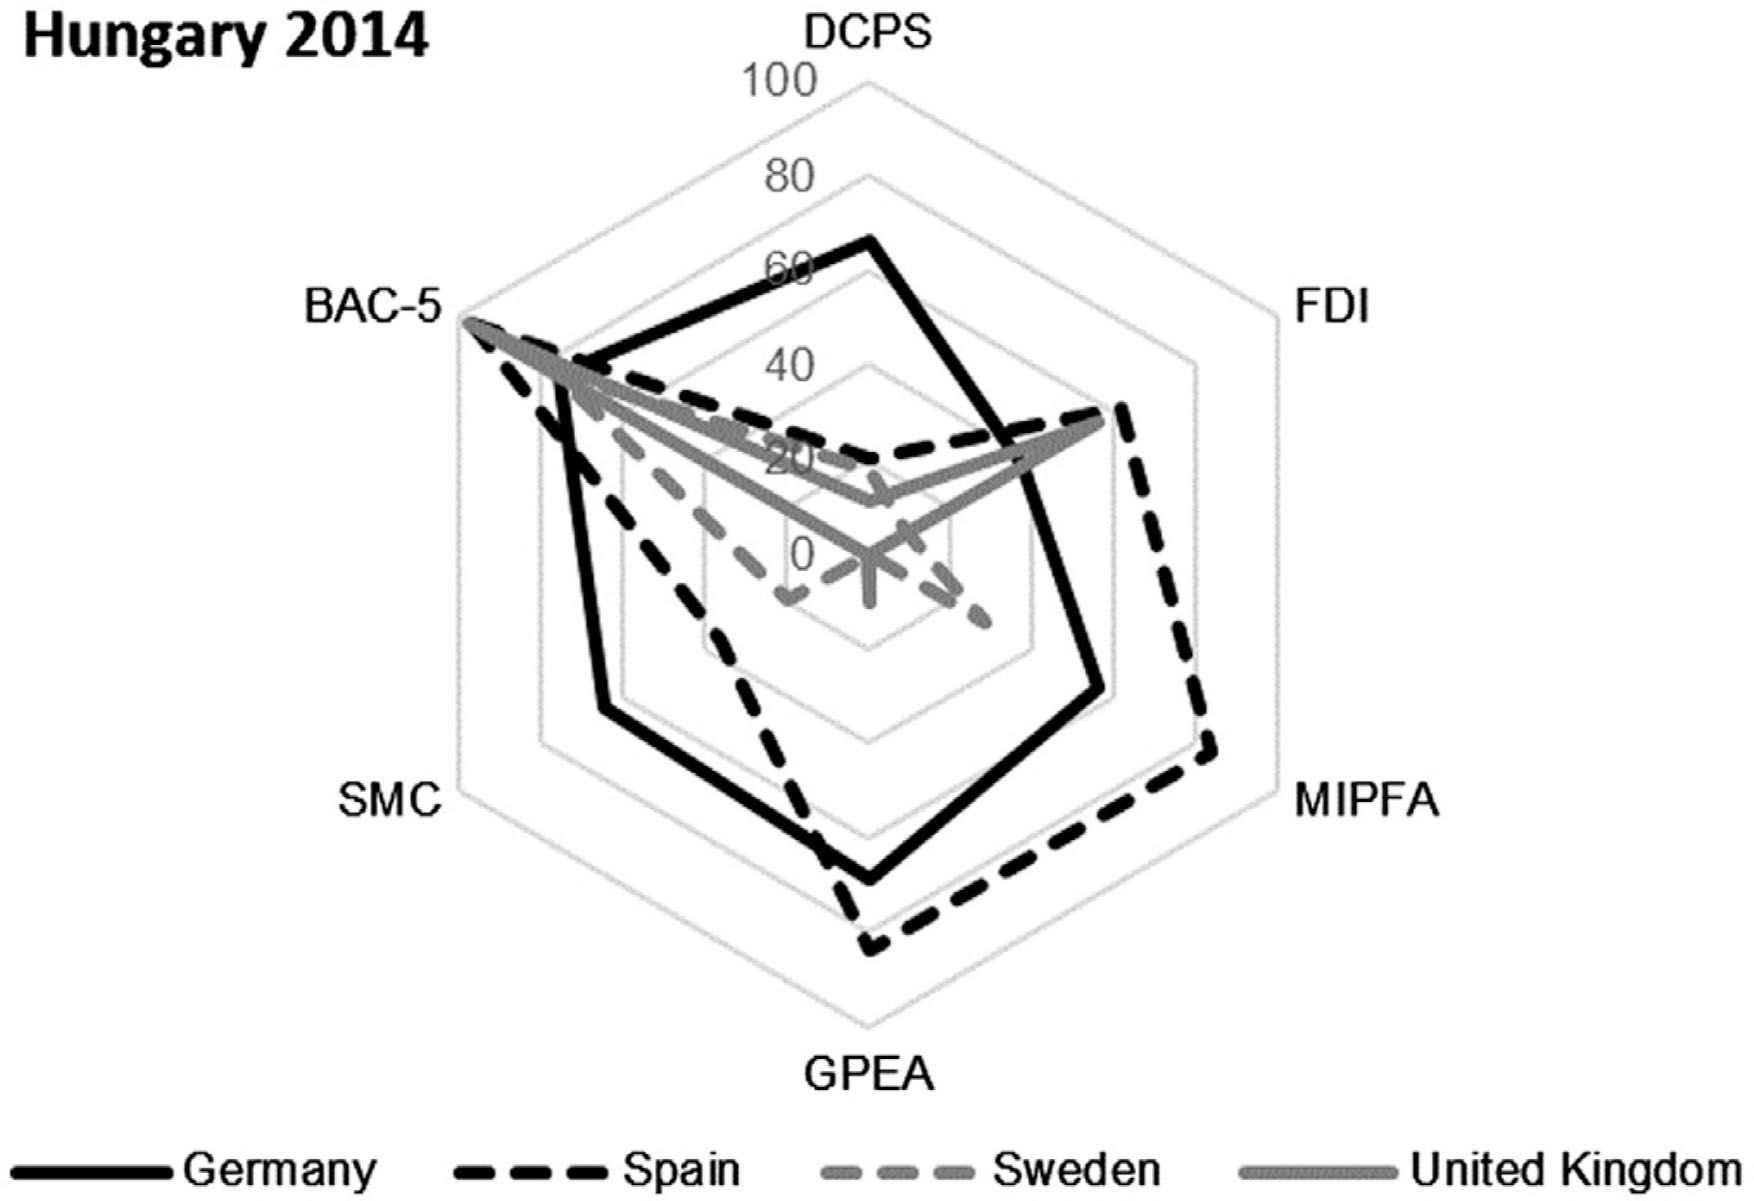
Figure A10
The hexagon for Hungary (year 2014).
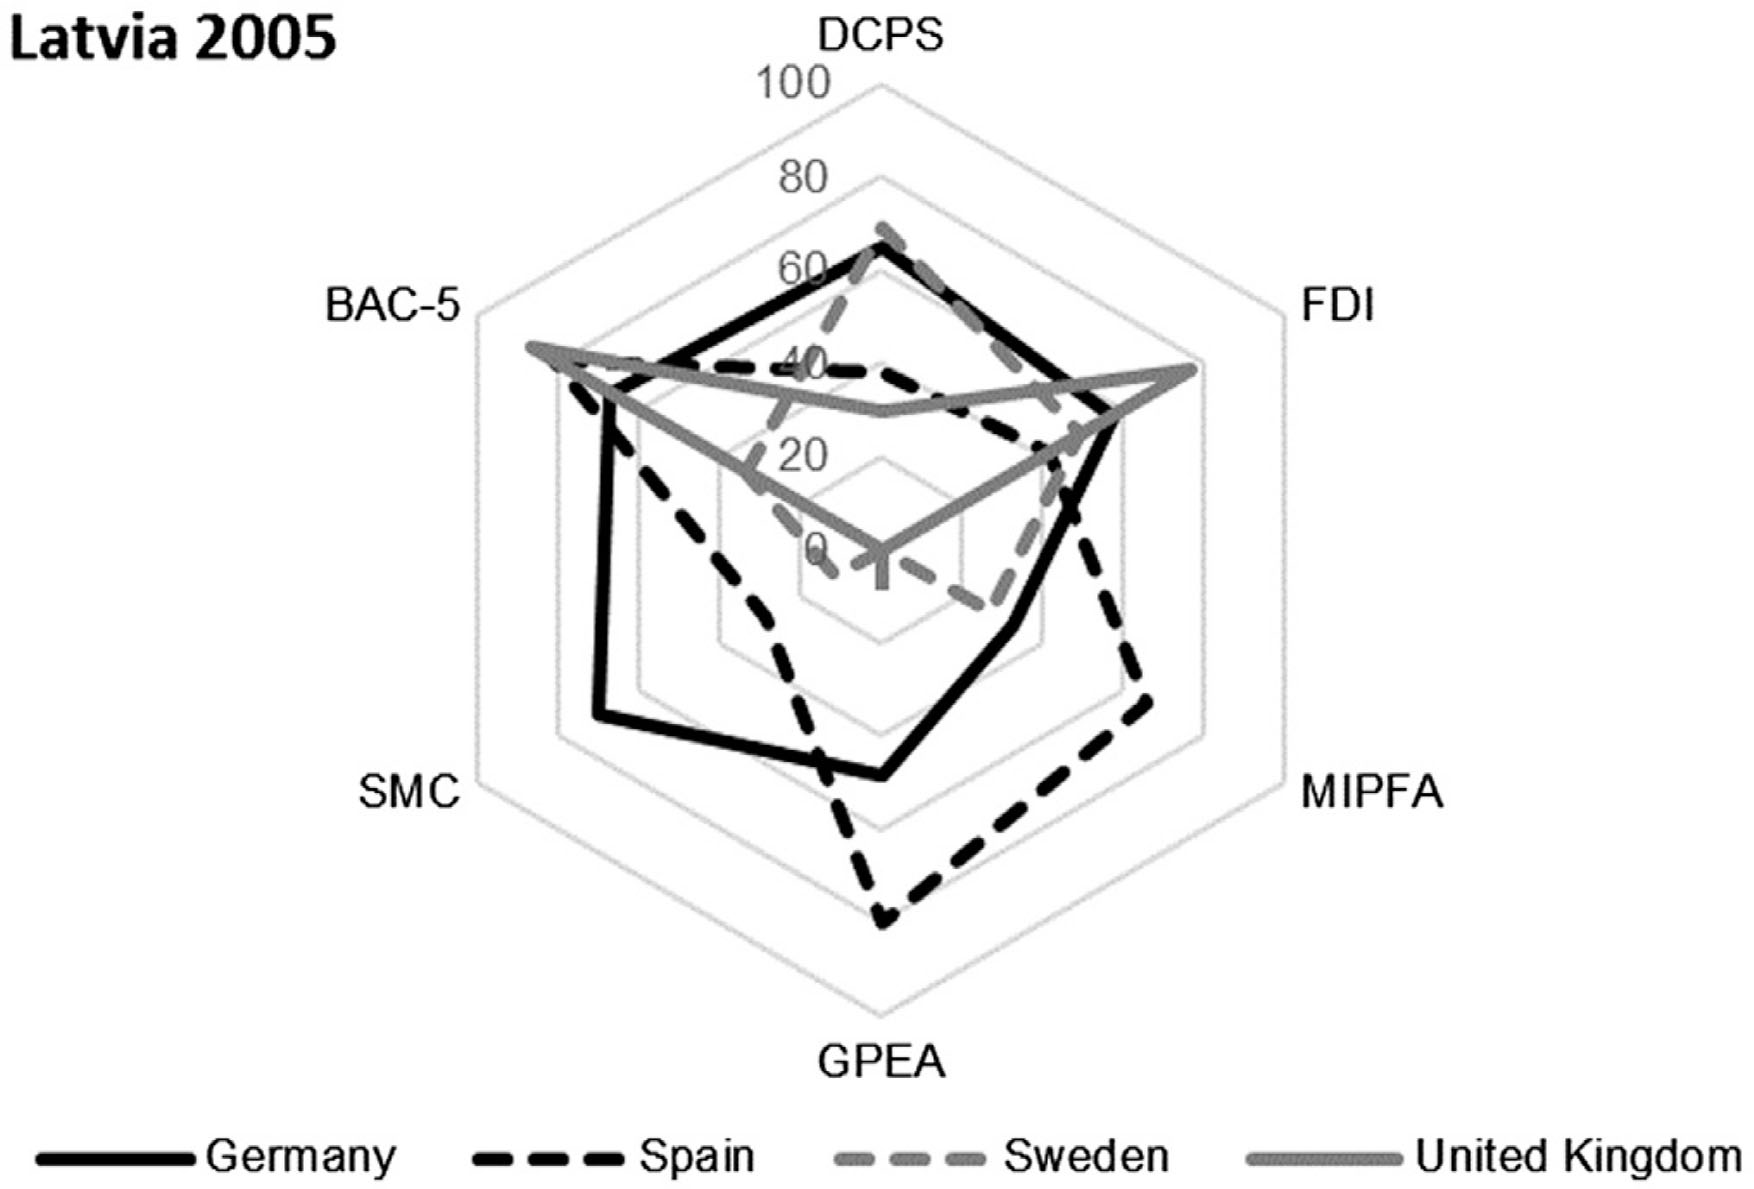
Figure A11
The hexagon for Latvia (year 2005).
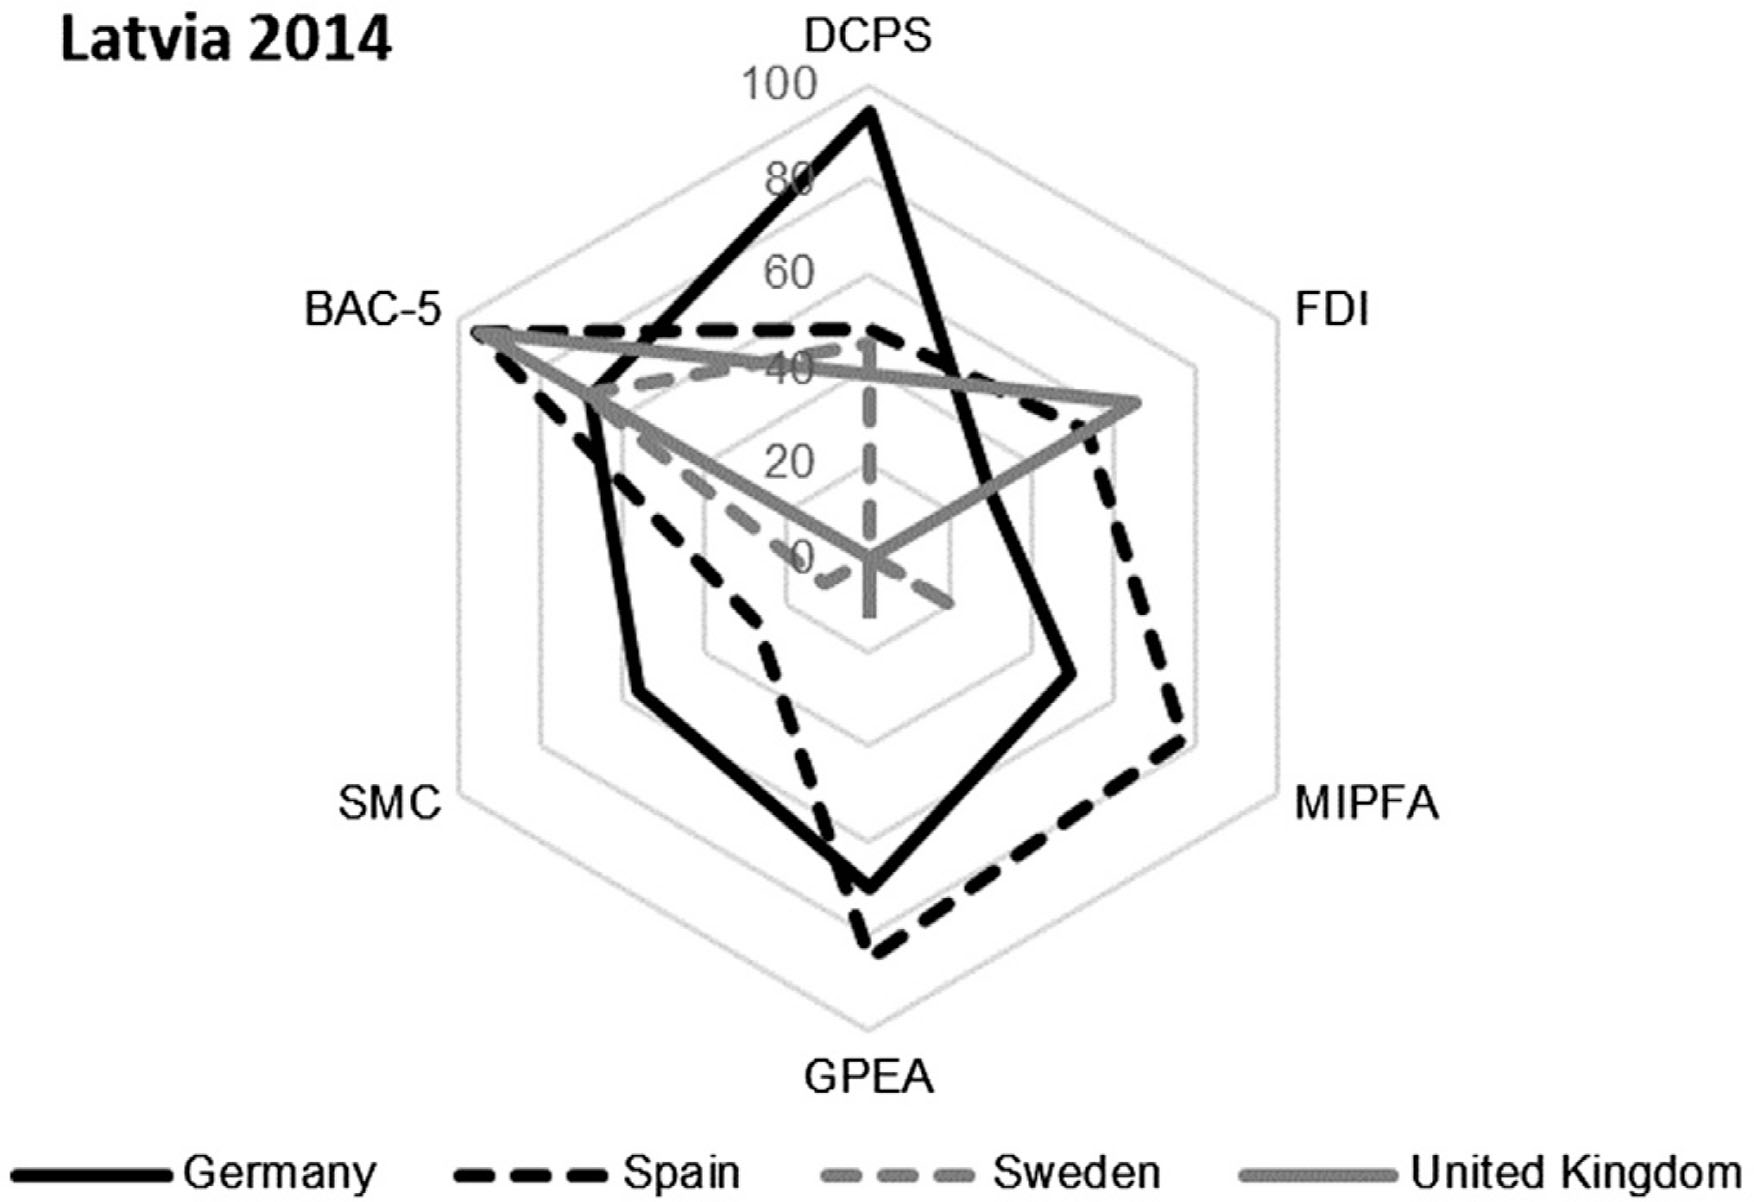
Figure A12
The hexagon for Latvia (year 2014).
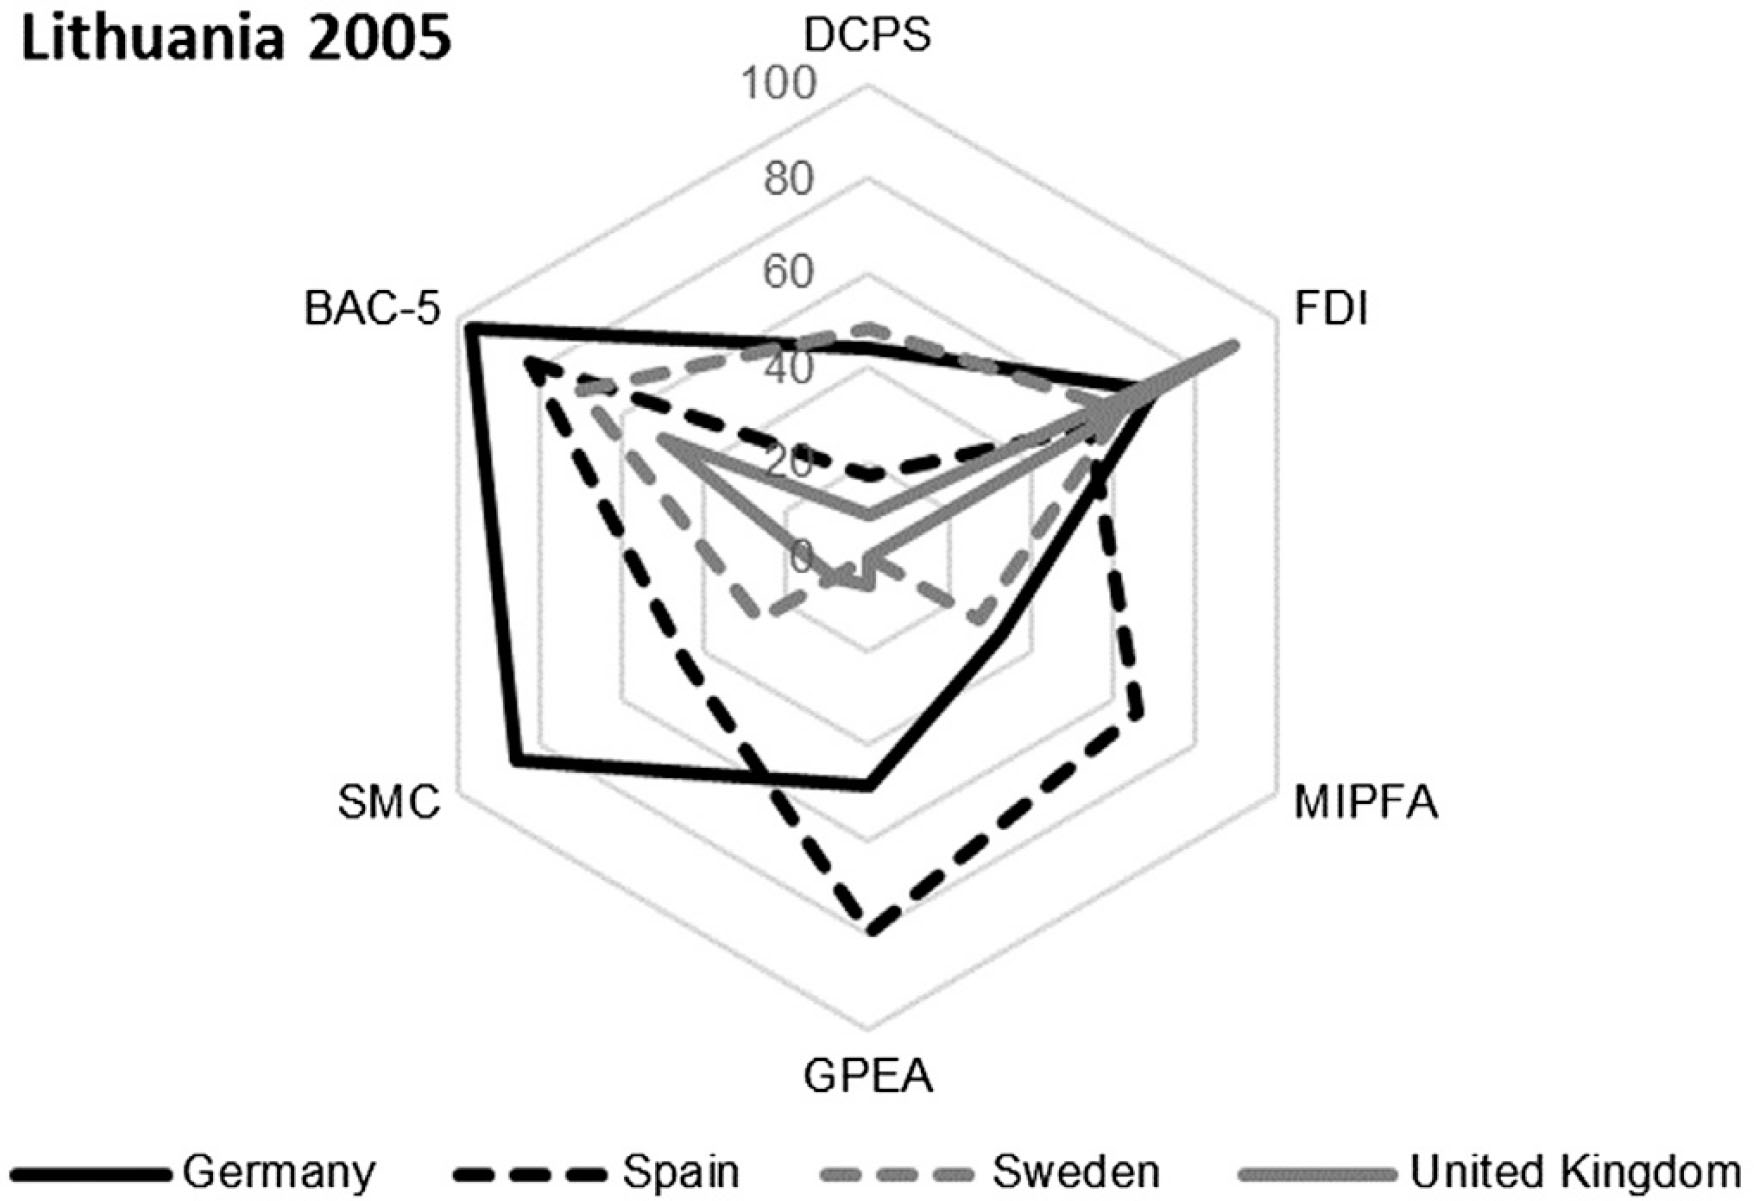
Figure A13
The hexagon for Lithuania (year 2005).
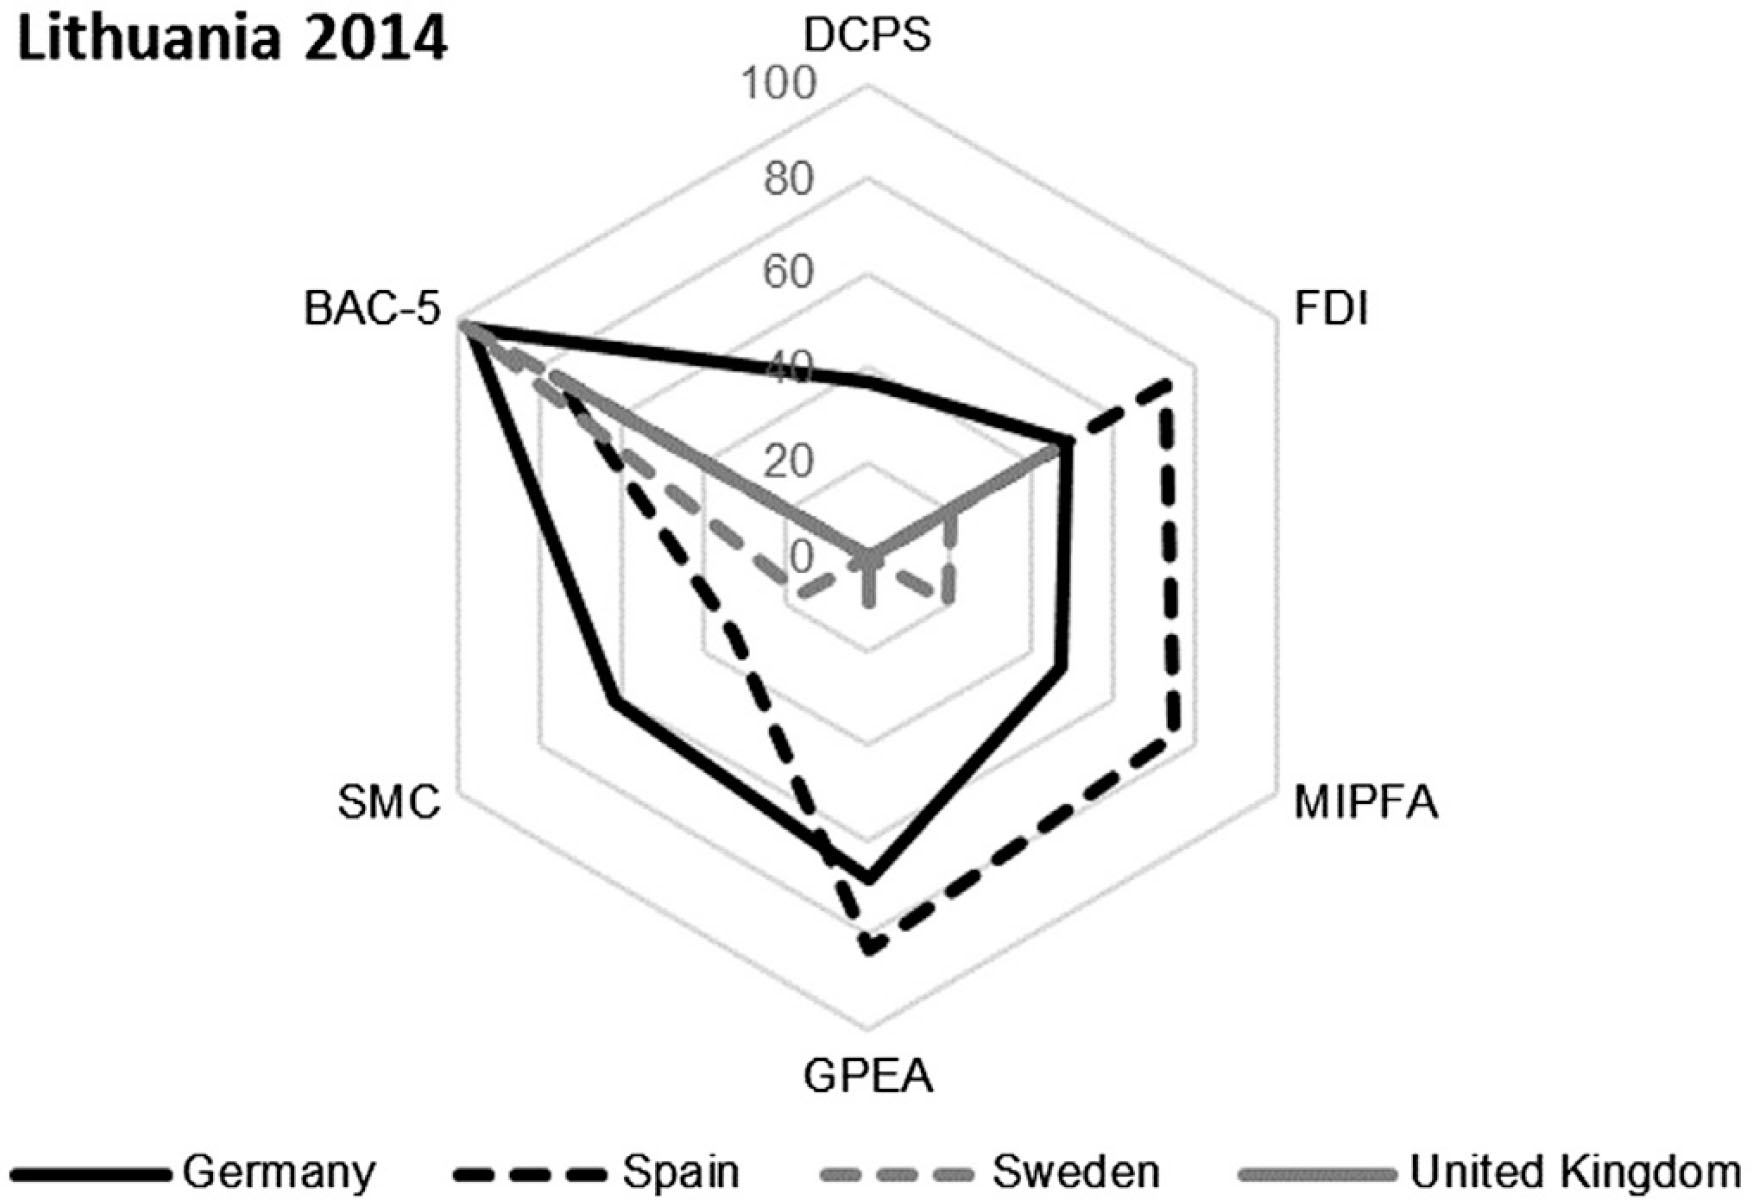
Figure A14
The hexagon for Lithuania (year 2014).
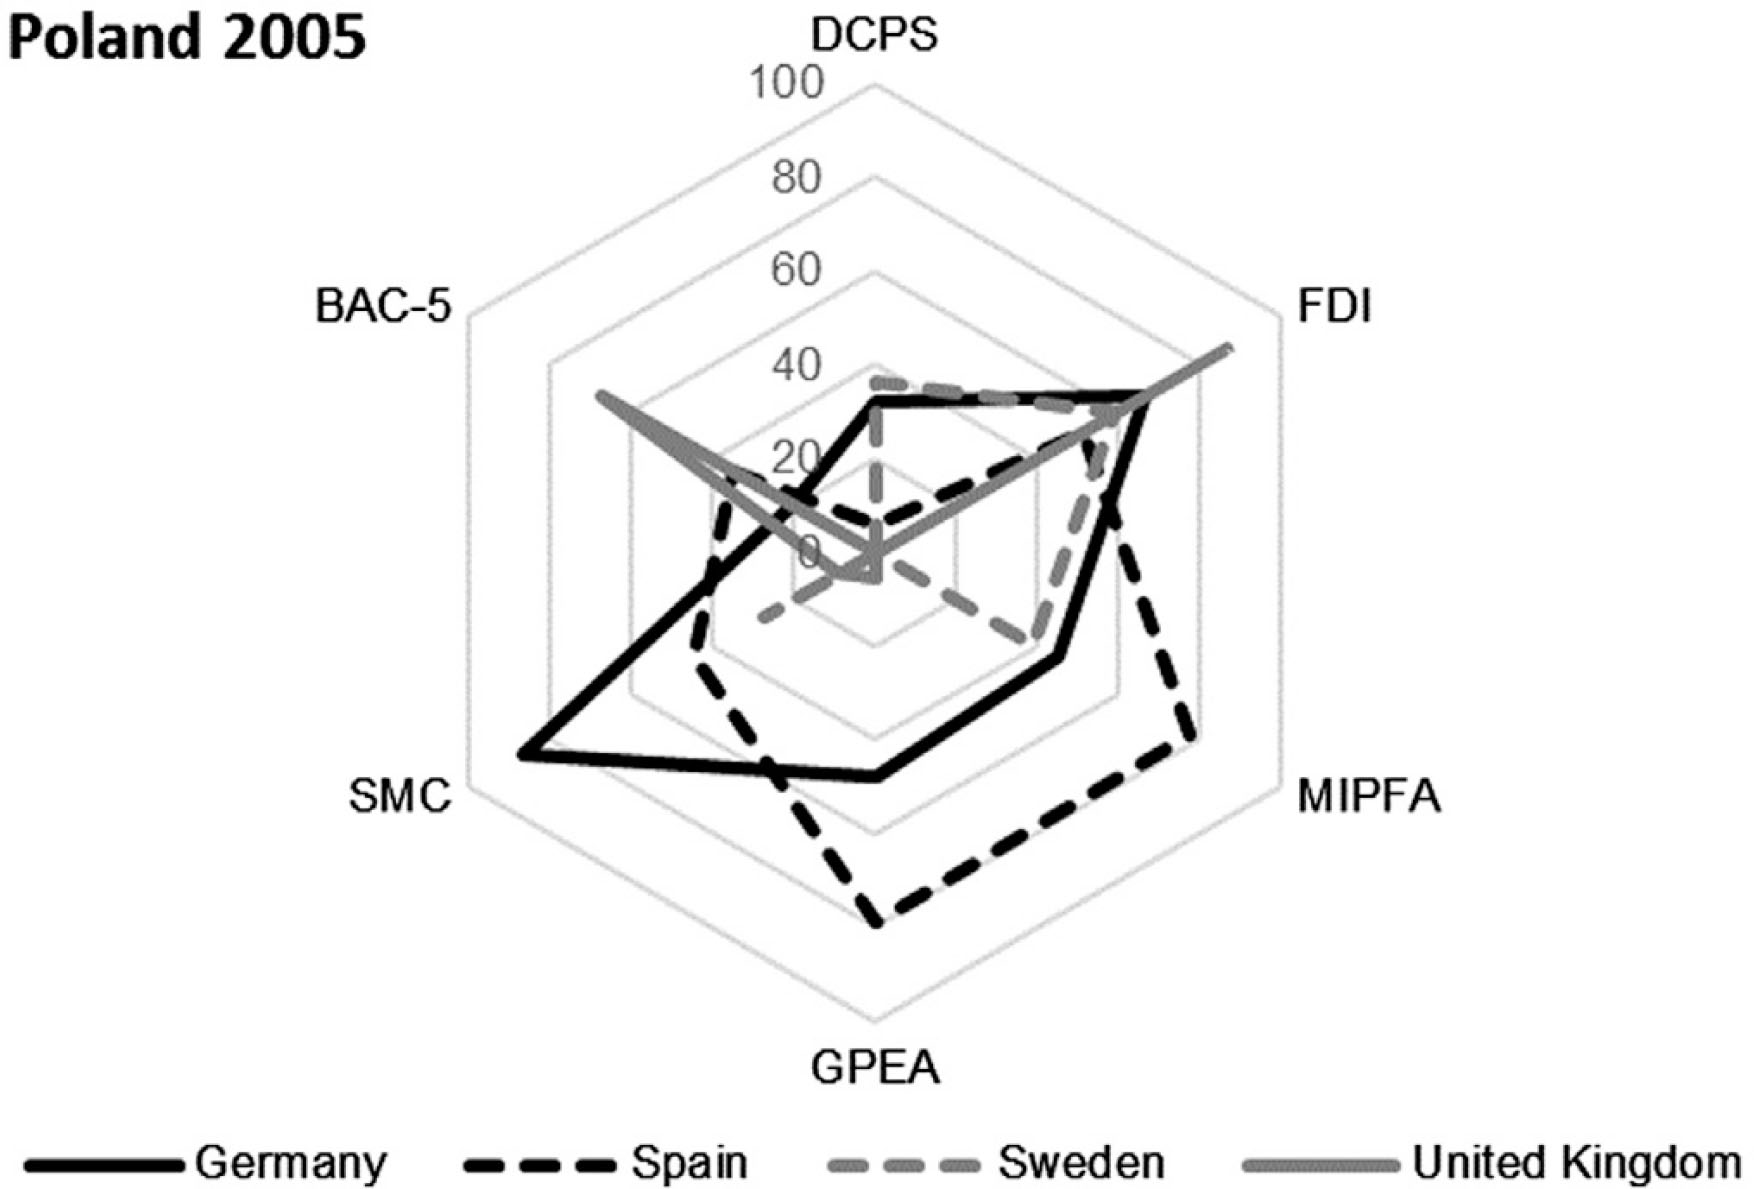
Figure A15
The hexagon for Poland (year 2005).
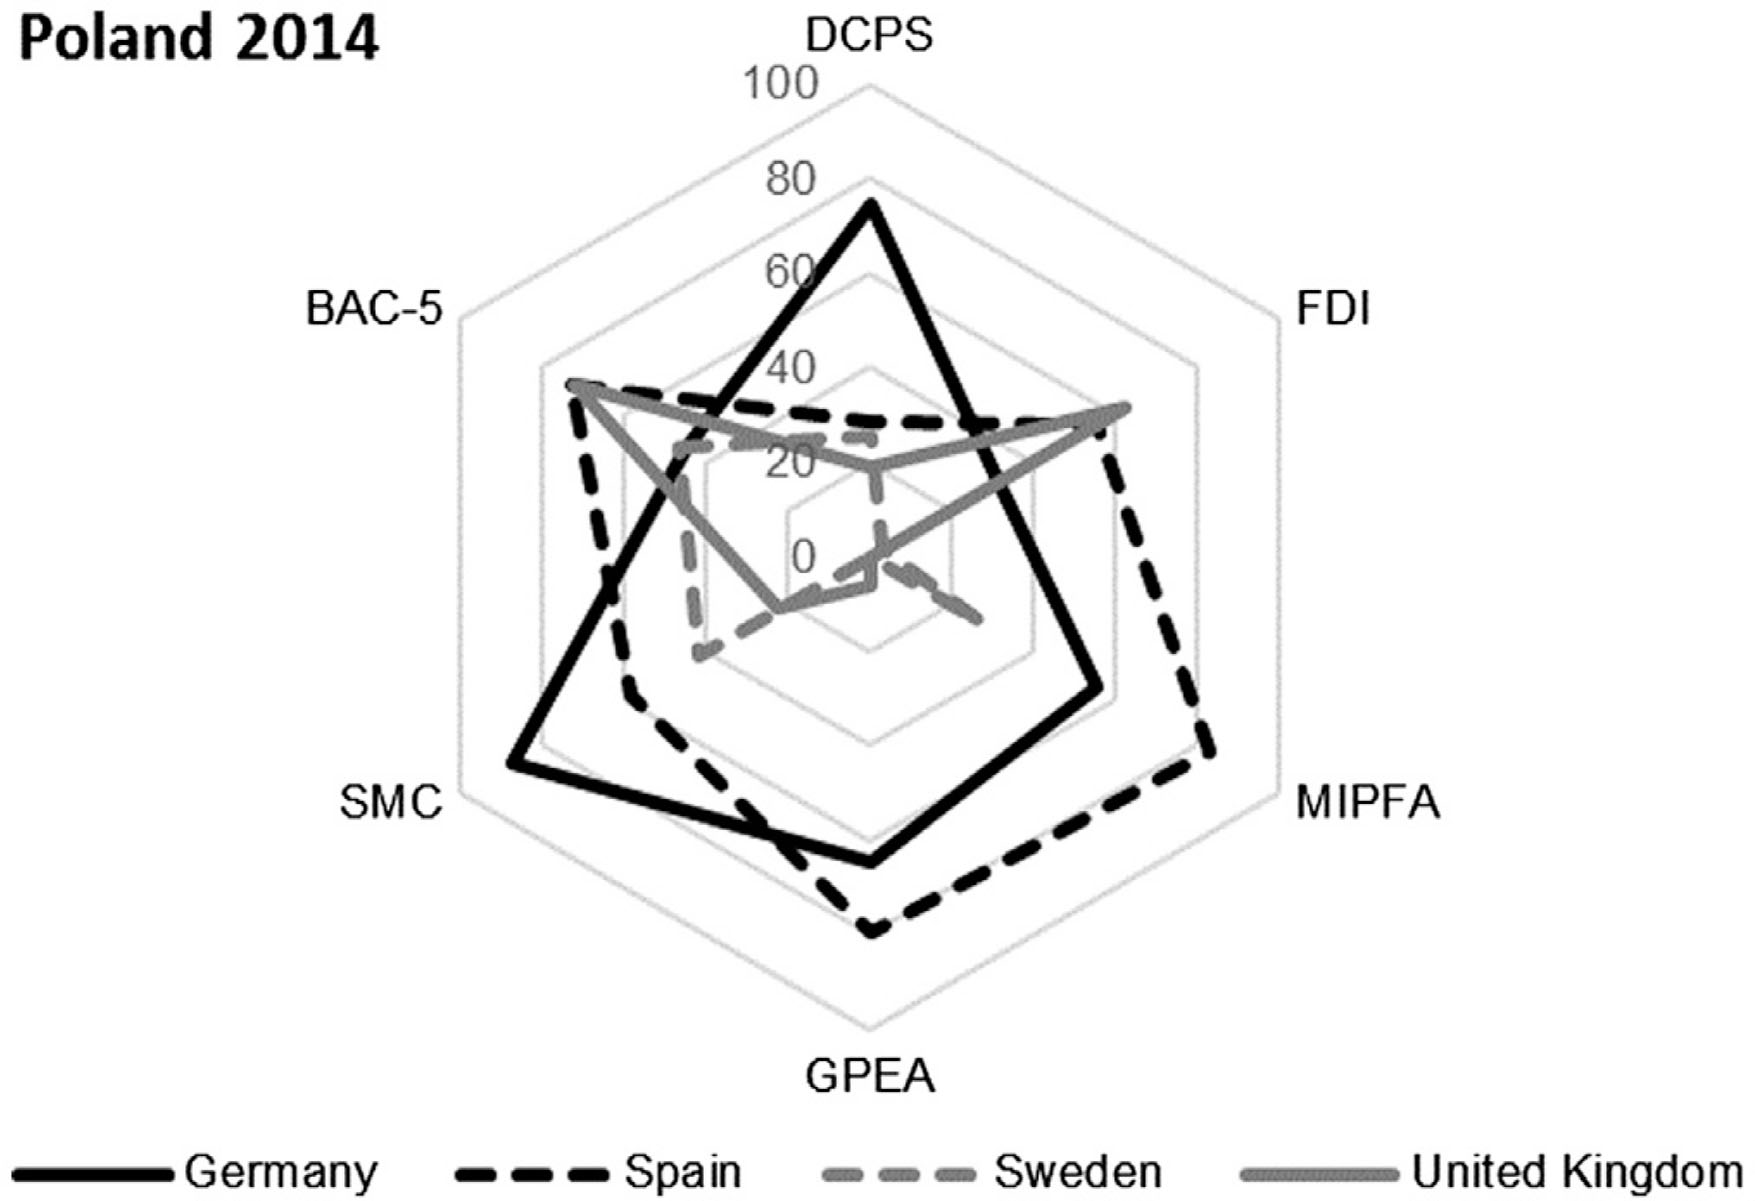
Figure A16
The hexagon for Poland (year 2014).
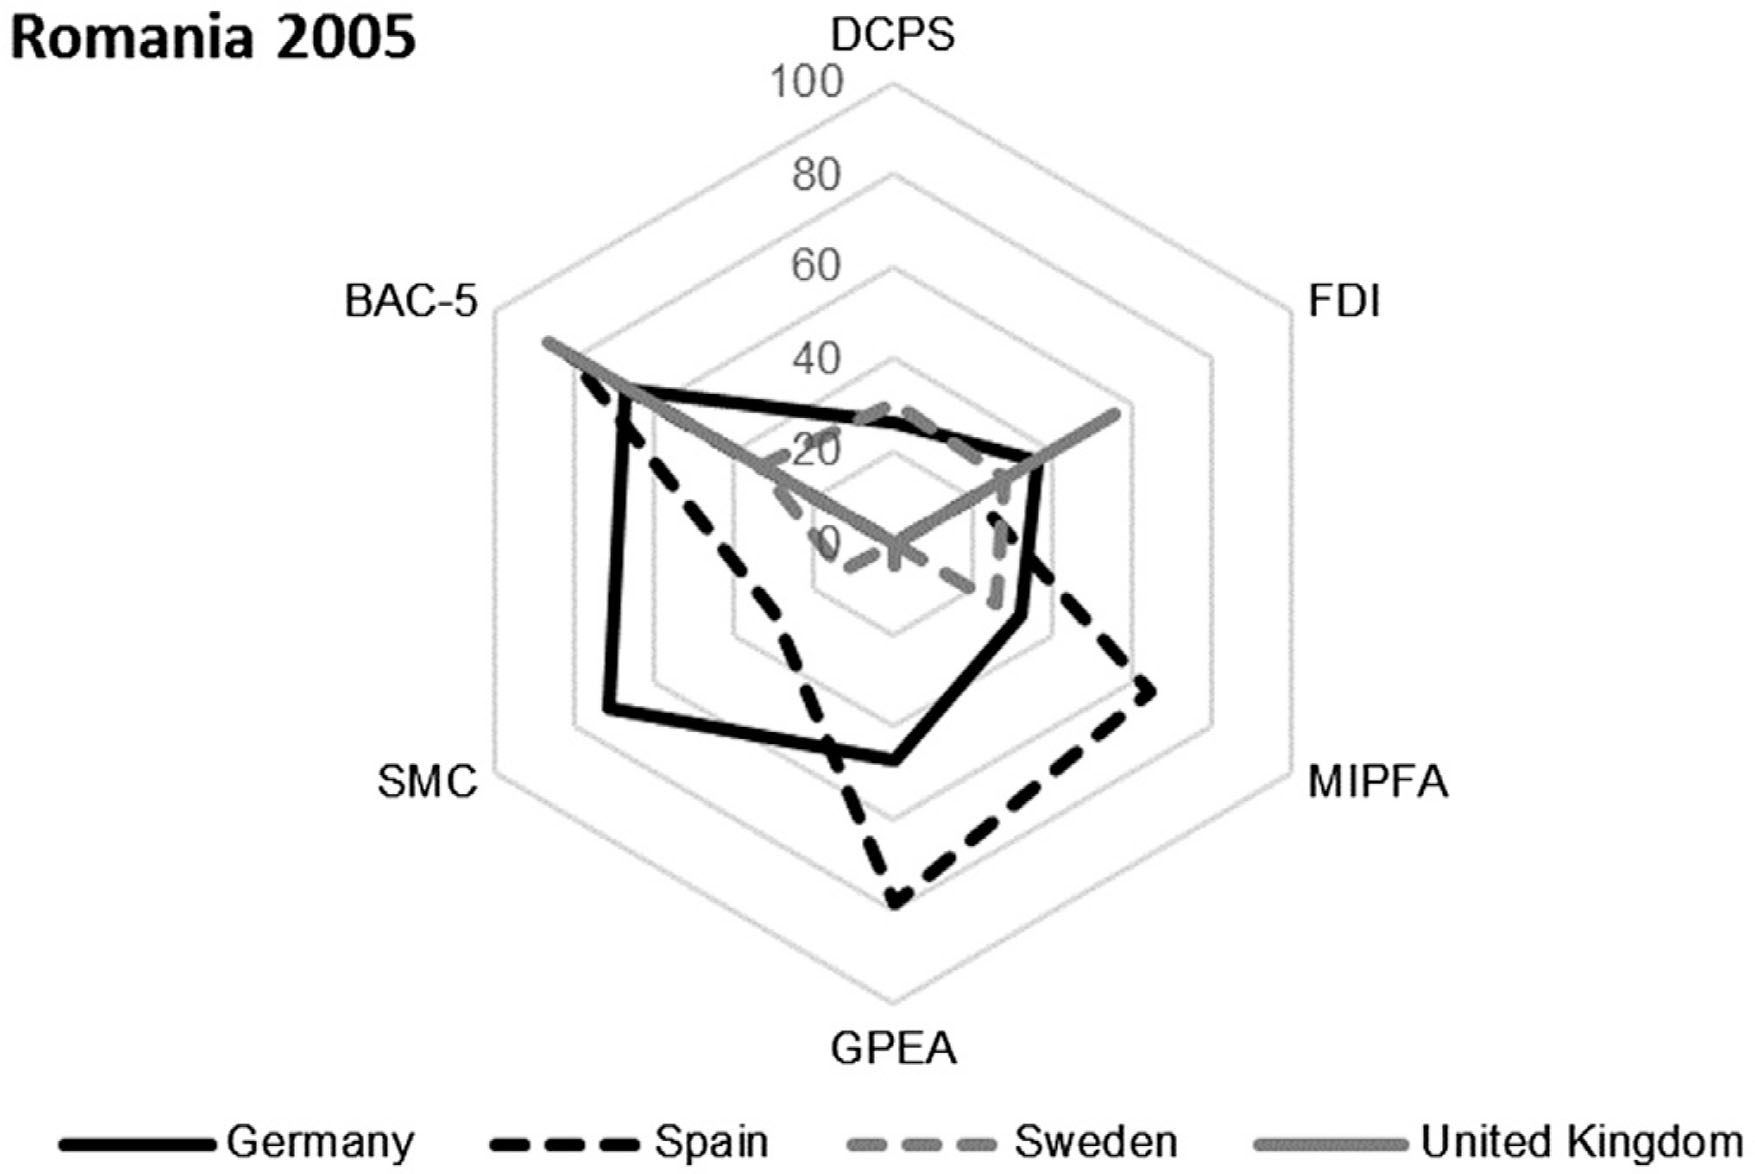
Figure A17
The hexagon for Romania (year 2005).
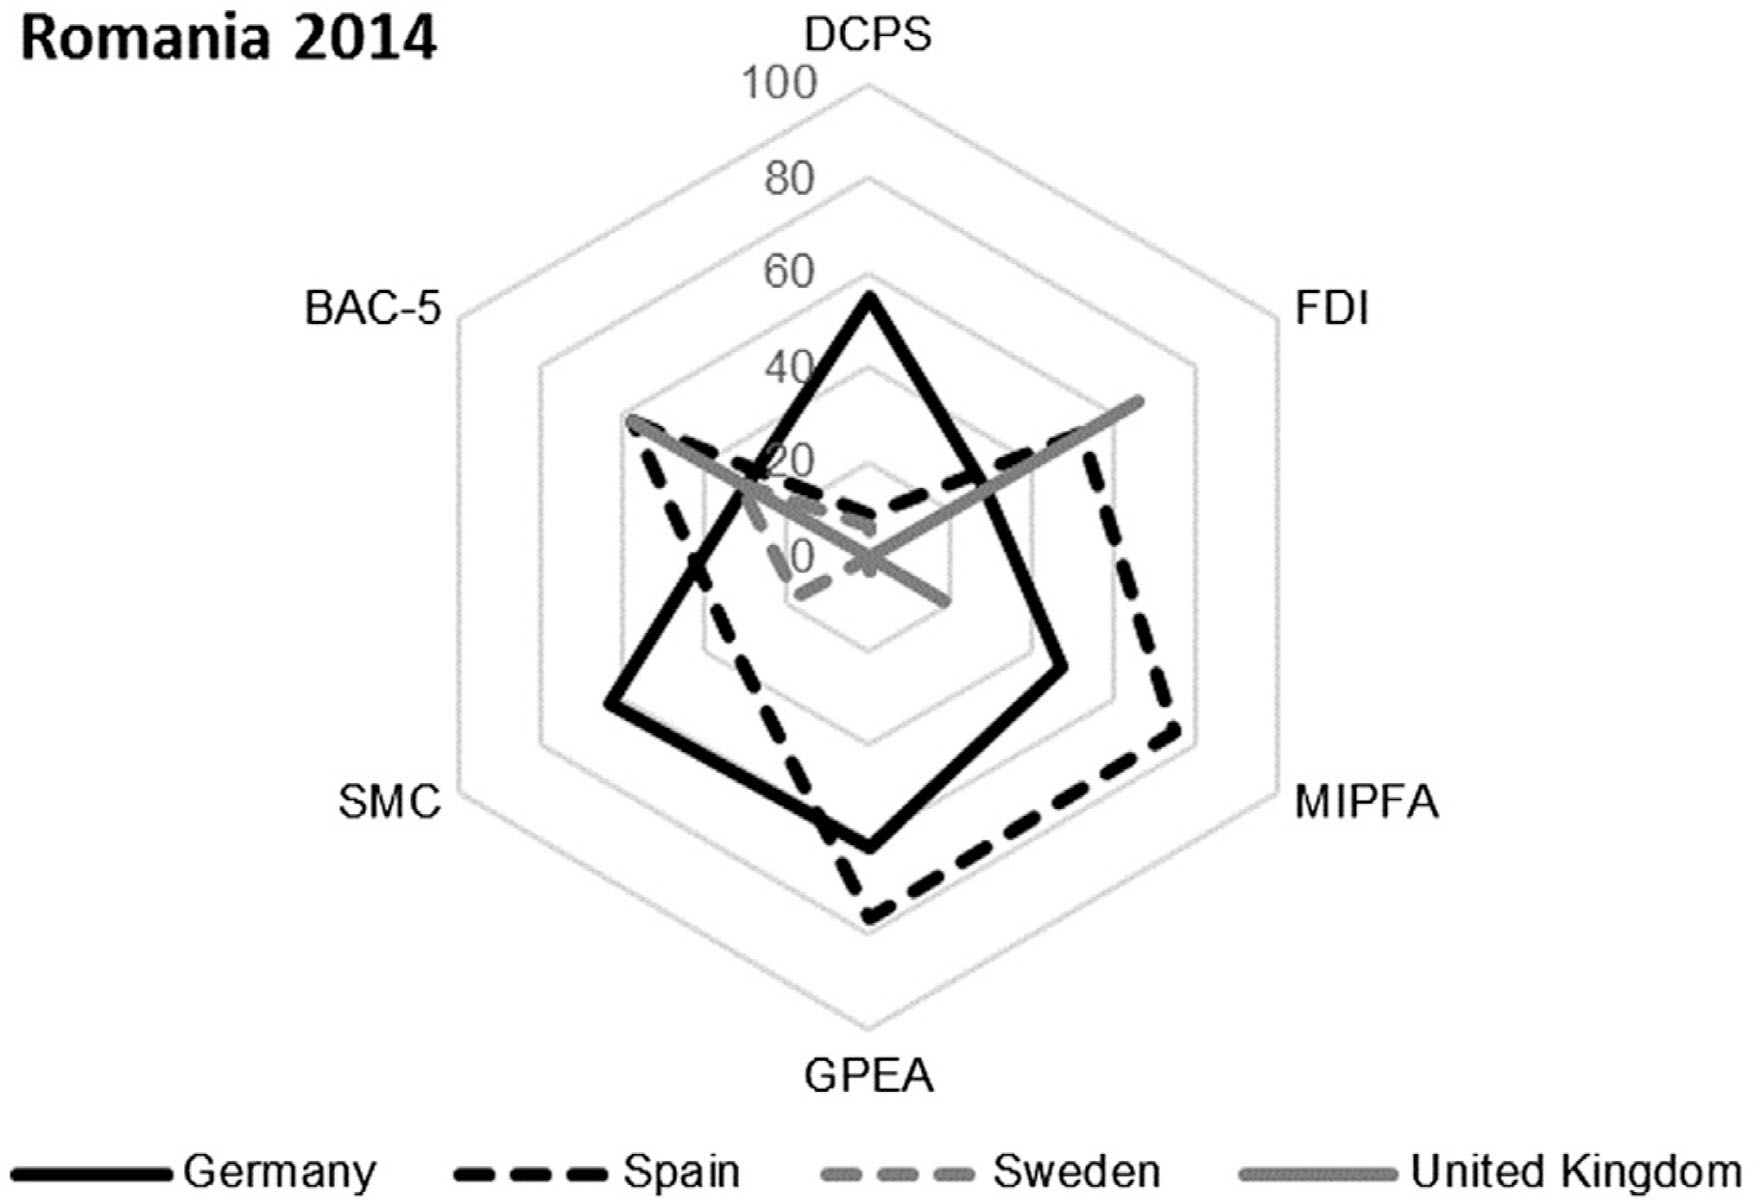
Figure A18
The hexagon for Romania (year 2014).
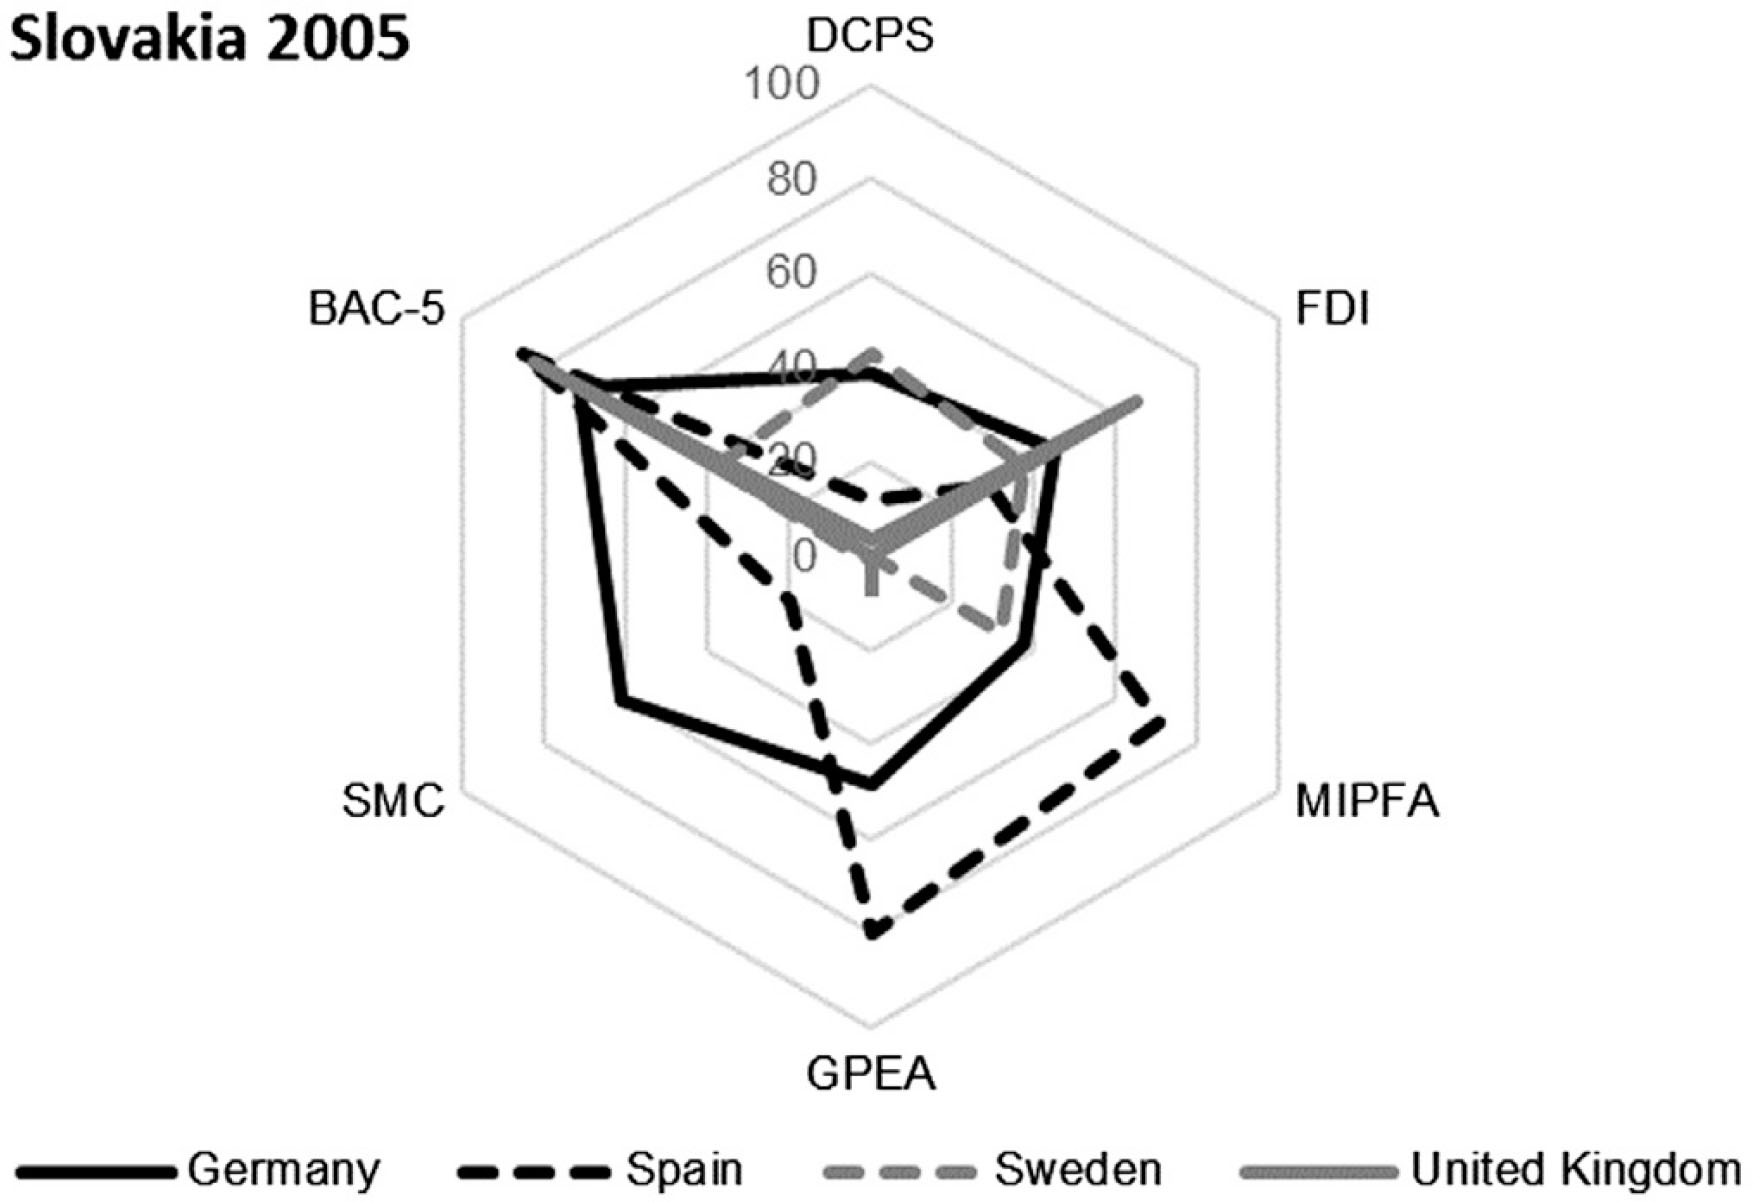
Figure A19
The hexagon for Slovakia (year 2005).
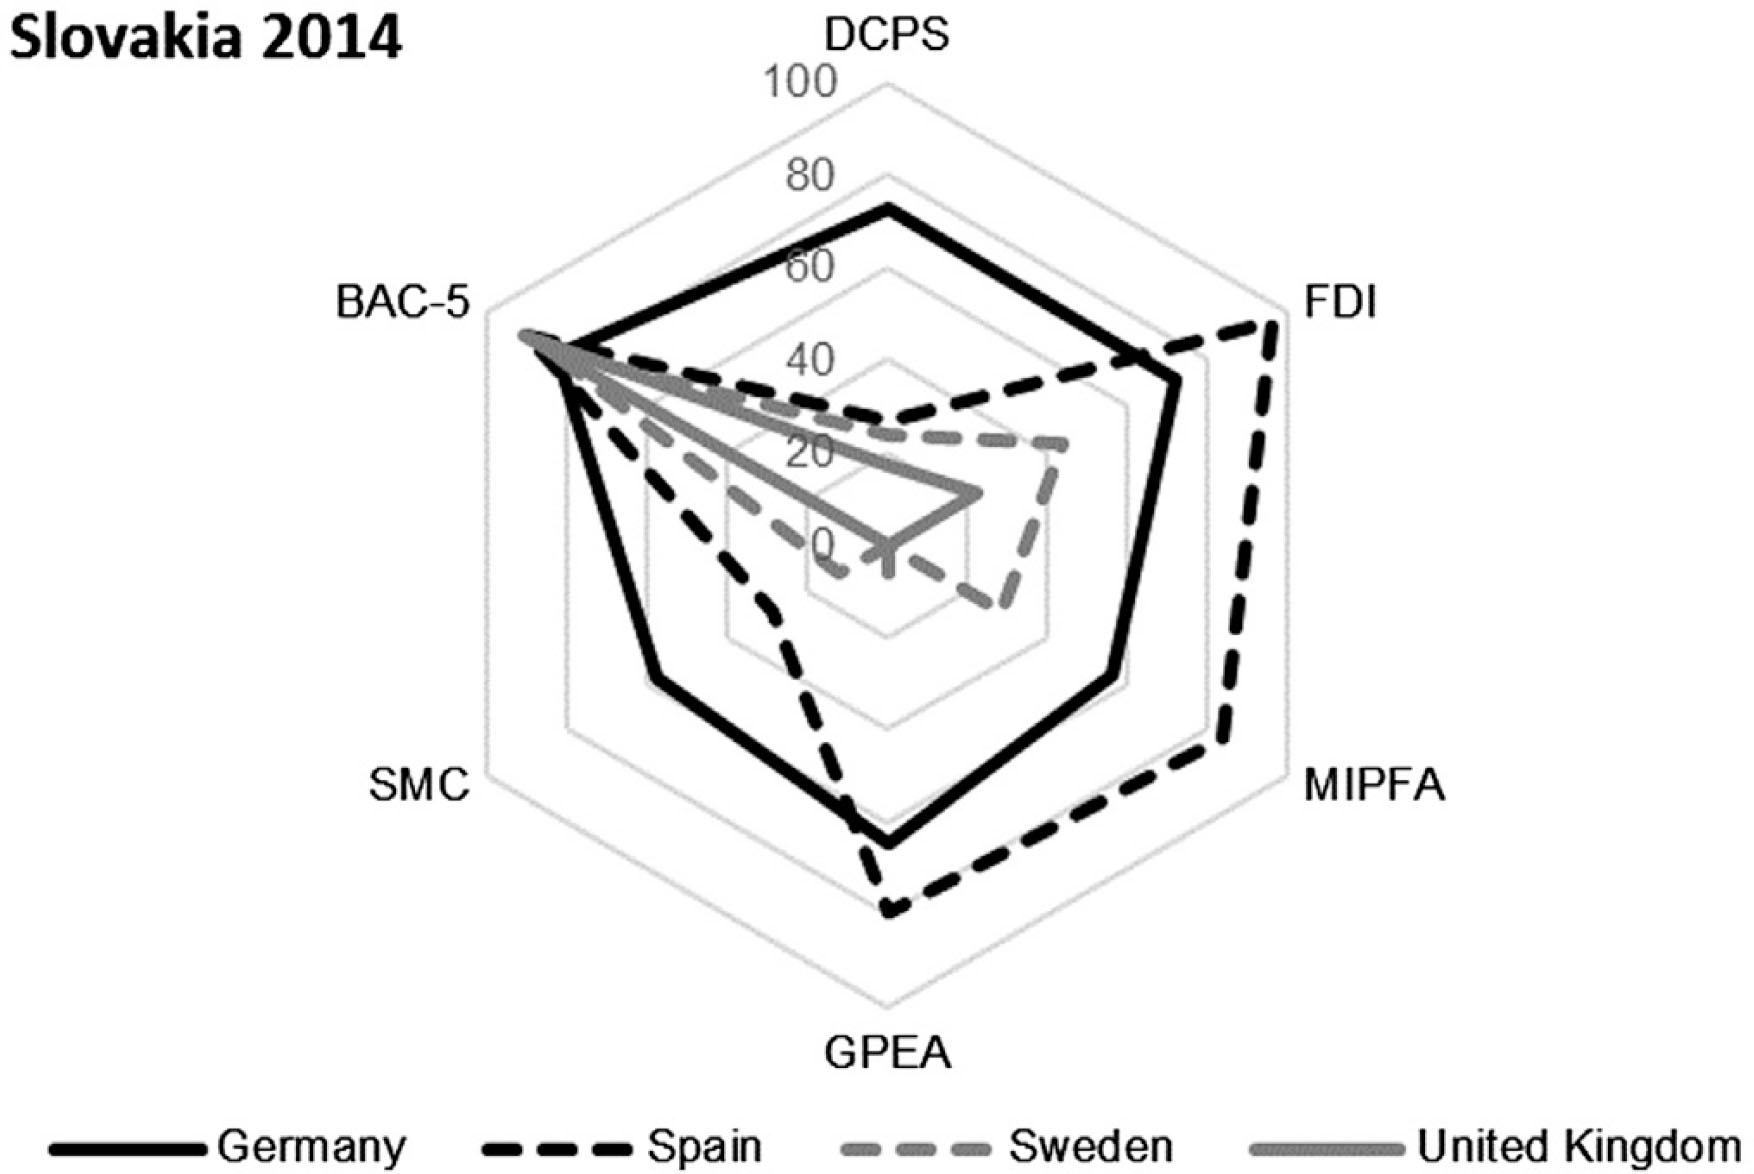
Figure A20
The hexagon for Slovakia (year 2014).
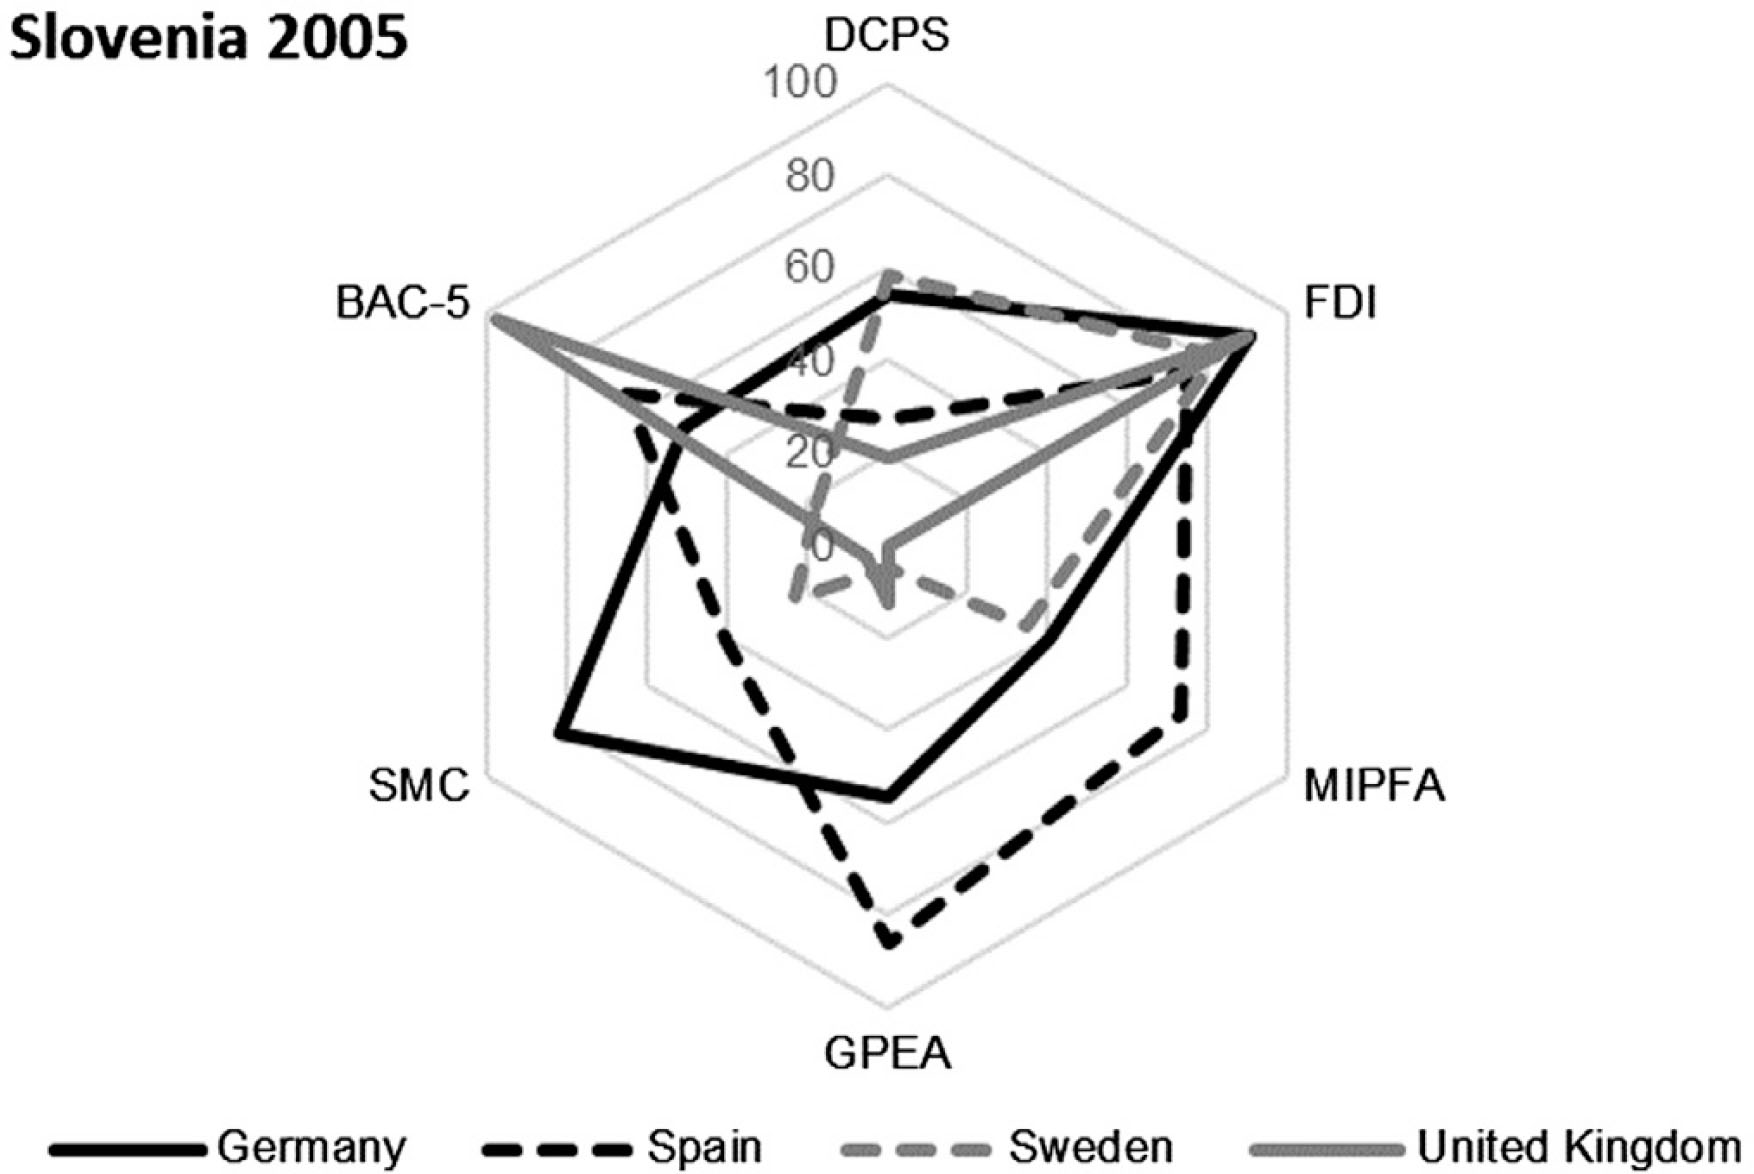
Figure A21
The hexagon for Slovenia (year 2005).
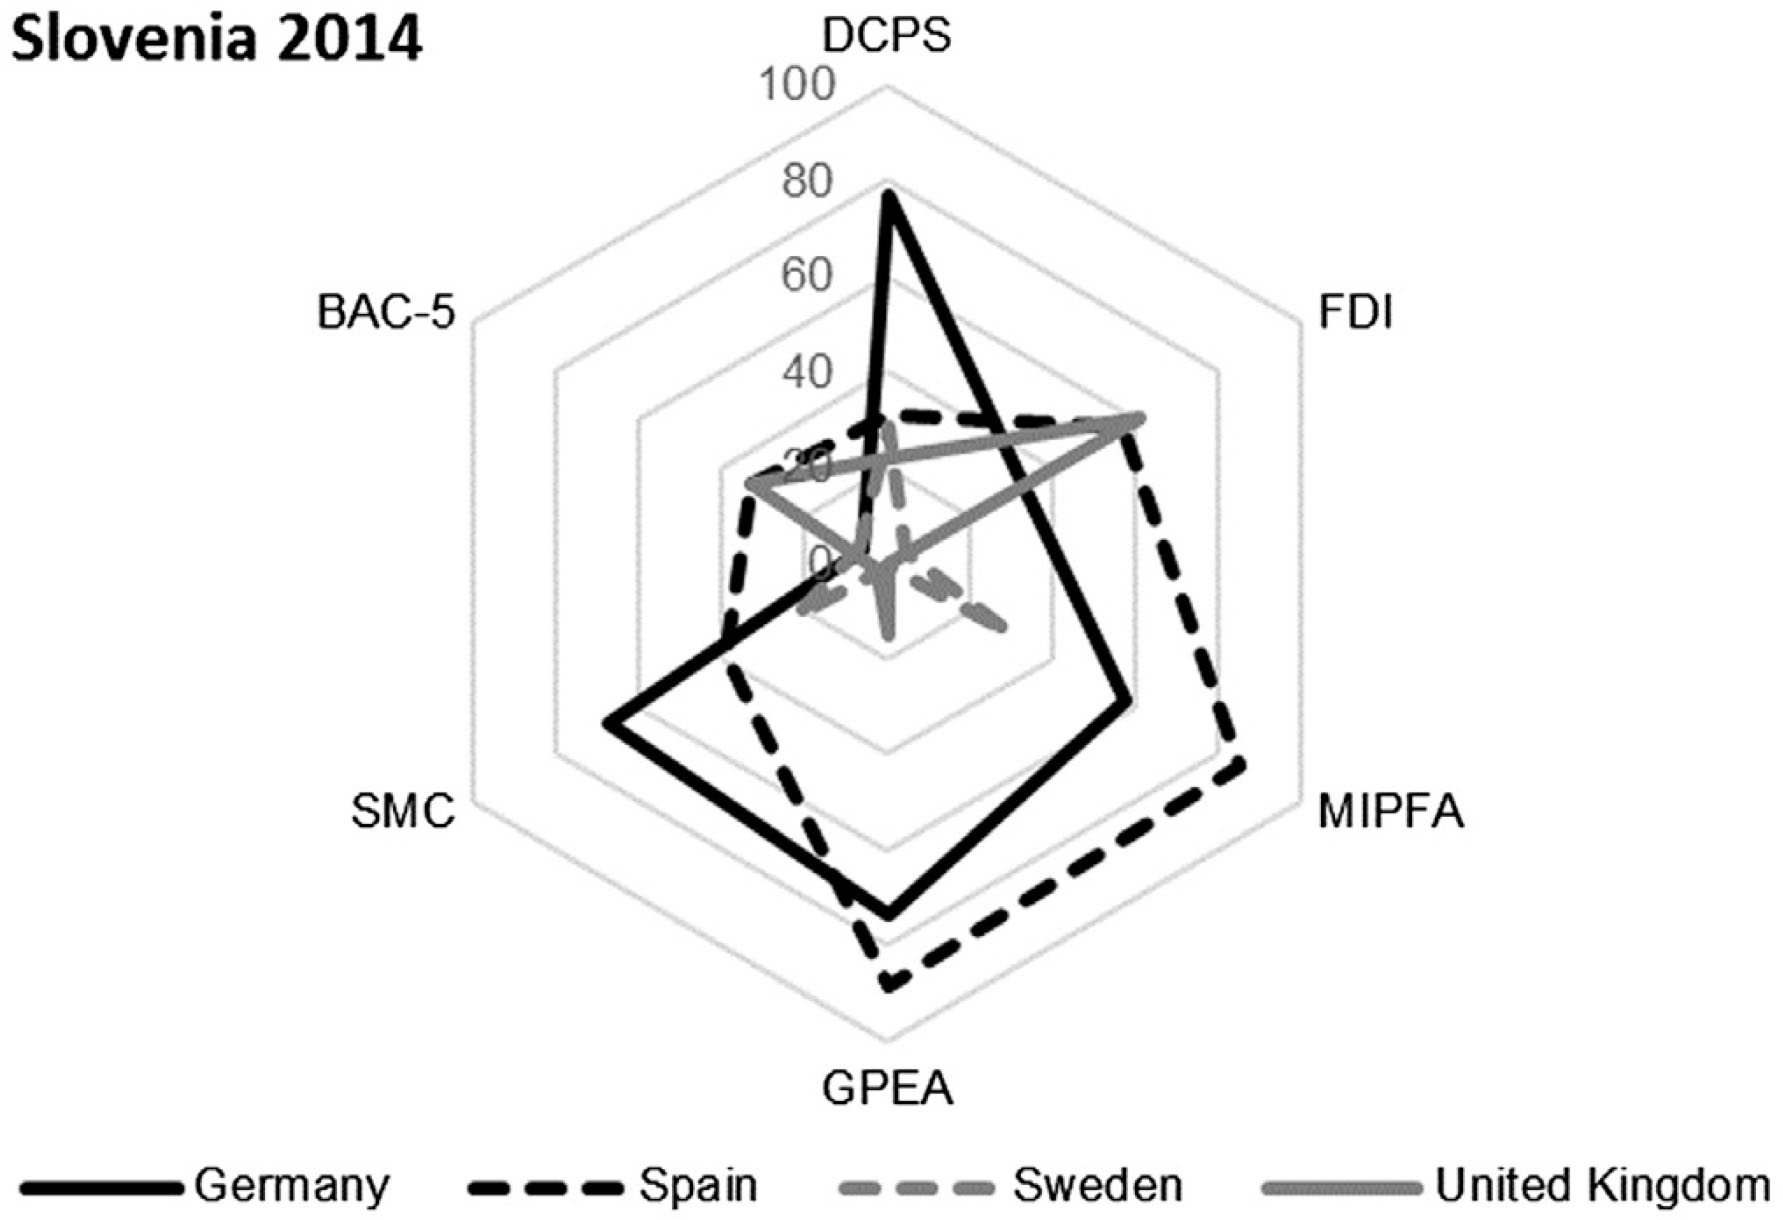
Figure A22
The hexagon for Slovenia (year 2014)