
Table 1
Political news headlines categorizing criteria
| News headlines | Categorizing | Decision |
|---|---|---|
| Kurdish leader Abdullah Ocalan declares ceasefire with Turkey. | Good News | Included |
| Vladimir Putin: Turkey’s downing of Russian jet “a stab in the back.” | Bad News | Included |
| Turkey and United States “agree in principle” to provide air support for Syrian rebels. | Nonevent | Excluded |
| Dilek Öcalan, niece of jailed Kurdish leader, enters Turkish parliament. | Nonevent | Excluded |
| Good news | Political news with positive nature, which are expected to increase stock market investors’ appetite such as: | |
| – signing new deals and accords | ||
| – declaring ceasefire | ||
| – ending conflicts | ||
| – peaceful and successful elections | ||
| – quick and easy government formation | ||
| – fruitful diplomatic visits | ||
| – freeing prisoners, etc. | ||
| Bad news | Political news with negative nature, which are expected to decrease stock market investors’ appetite such as: | |
| – military incursion into a war zone | ||
| – protest movements | ||
| – coup attempts | ||
| – bombing attacks | ||
| – detaining journalists | ||
| – cut off diplomatic relations | ||
| – unfair elections, etc. | ||
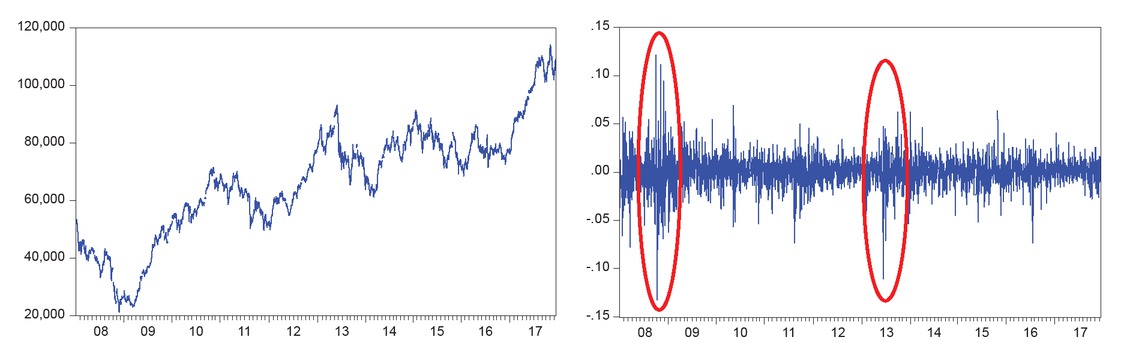
Figure 1
BIST-100 Index Closing Prices and Returns (January 2008–December 2017).
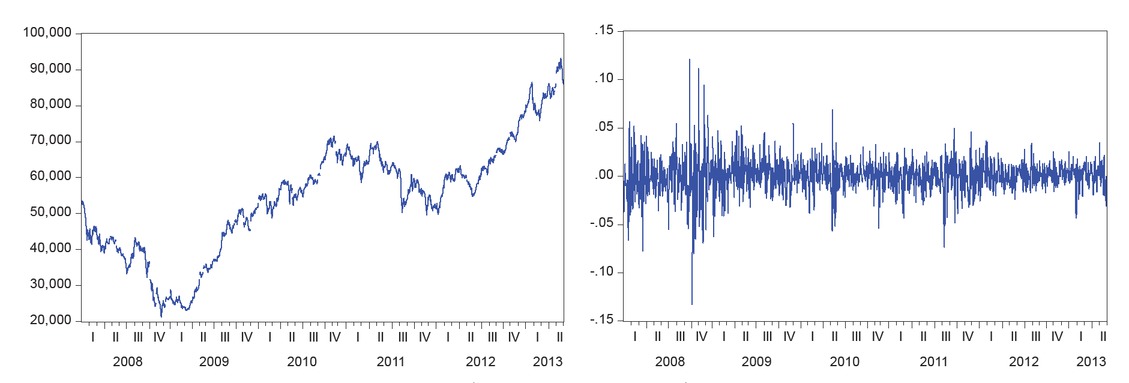
Figure 2
BIST-100 Index Closing Prices and Returns (January 2008–May 2013).
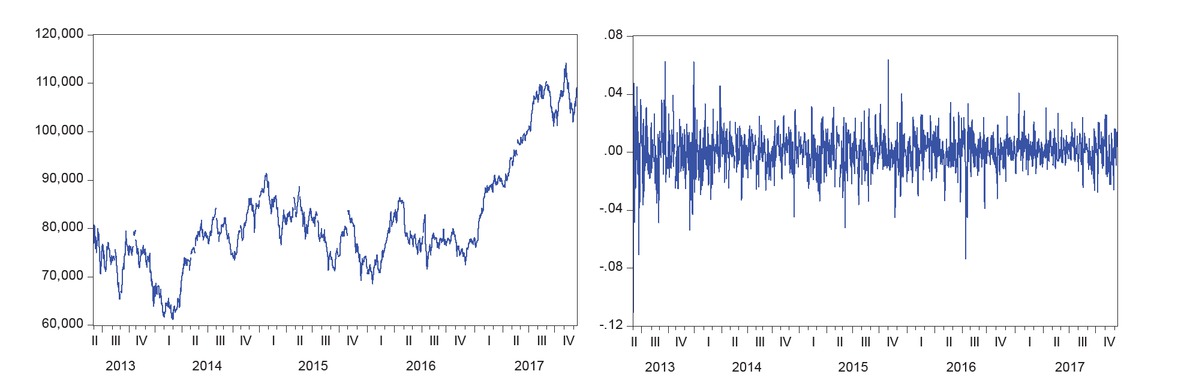
Figure 3
BIST-100 Index Closing Prices and Returns (June 2013–December 2017).
Table 2
Descriptive statistics of the daily returns of the BIST-100 index
| Statistical indicator | Full sample period | First subperiod | Second subperiod |
|---|---|---|---|
| Mean | 0.000277 | 0.000327 | 0.000216 |
| Median | 0.000737 | 0.000914 | 0.000526 |
| Maximum | 0.121272 | 0.121272 | 0.063602 |
| Minimum | −0.132585 | −0.132585 | −0.110638 |
| SD | 0.016851 | 0.018572 | 0.014508 |
| Skewness | −0.288541 | −0.177630 | −0.556939 |
| Kurtosis | 9.147130 | 8.798611 | 8.232316 |
| Jarque–Bera | 3877.145 | 1878.755 | 1317.614 |
| Probability | 0.000000 | 0.000000 | 0.000000 |
| Sum | 0.675713 | 0.437161 | 0.238551 |
| Sum SD | 0.692872 | 0.460487 | 0.232378 |
| Observations | 2441 | 1336 | 1105 |
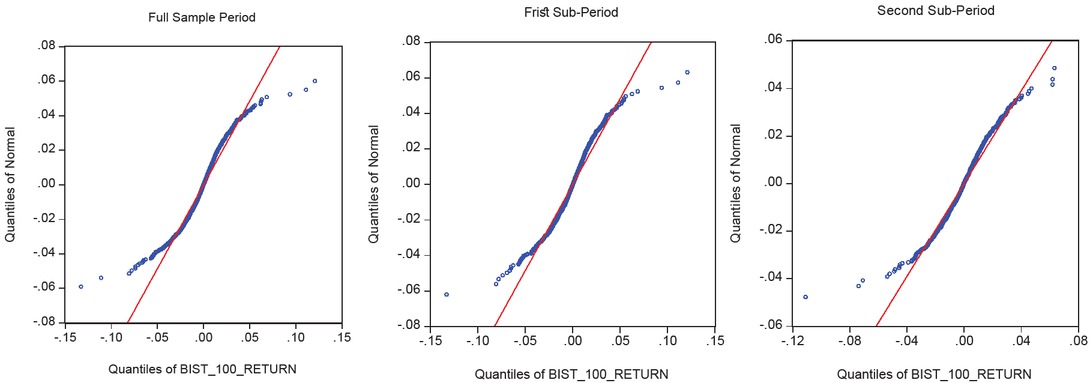
Figure 4
Quantile–Quantile (Q–Q) normal distribution plots.
Table 3
ADF unit root test for the BIST-100 return series
| Critical values | |||||
|---|---|---|---|---|---|
| Unit root test | ADF statistic | Prob.* | 1% | 5% | 10% |
| Full period | −48.34709 | 0.0001 | −3.433 | −2.862 | −2.567 |
| First subperiod | −34.458 | 0.0000 | −3.435 | −2.863 | −2.568 |
| Second subperiod | −36.152 | 0.0000 | −3.436 | −2.864 | −2.568 |
[i] ADF, augmented Dickey–Fuller.
Note: (1). MacKinnon [1996] one-sided p values. (2). Test equations include only constant term.
Table 4
ARCH–LM test for residuals of BIST-100 index returns
| Full sample | First subperiod | Second subperiod | |
|---|---|---|---|
| ARCH–LM test statistic | 160.20 | 96.011 | 38.601 |
| Prob. Chi-Square (5) | 0.0000 | 0.0000 | 0.0000 |
[i] Note: (1). The equations include up to five lags. (2). Null hypothesis: There is no ARCH effect in the residuals. (3). Null hypothesis rejected at 1%.
Table 5
Estimation of GARCH(1,1) and GARCH-M(1,1) for BIST-100 with political news
| Model | GARCH(1,1) | GARCH-M(1,1) | ||||
|---|---|---|---|---|---|---|
| Full sample | First subperiod | Second subperiod | Full sample | First subperiod | Second subperiod | |
| Mean equation | ||||||
| α0 | 0.001111*** | 0.001128** | 0.000948** | 0.001978* | 0.002472* | 0.002450 |
| α1 | −0.002174 | 0.031160 | −0.054024* | −0.002785 | 0.029342 | −0.055269* |
| α2 | −0.000760 | 0.002617** | −0.001916* | −0.000780 | 0.002426* | −0.001862* |
| α3 | −0.061635 | −0.091964 | −0.118868 | |||
| Variance equation | ||||||
| ω | 7.41E-06*** | 1.00E-05*** | 6.43E-07 | 7.36E-06*** | 9.94E-06*** | 6.57E-07 |
| α1 | 0.076551*** | 0.102251*** | 0.015308*** | 0.076102*** | 0.102292*** | 0.015462*** |
| β1 | 0.898723*** | 0.874146*** | 0.972044*** | 0.899766*** | 0.874655*** | 0.972123*** |
| α2 | −4.46E-06 | −2.31E05*** | 7.00E-06*** | −5.14E06 | −2.37E-05*** | 6.71E-06*** |
| α1 + β1 | 0.975274 | 0.976397 | 0.987352 | 0.975868 | 0.976947 | 0.987585 |
| AIC | −5.526698 | −5.393872 | −5.765890 | −5.526090 | −5.393065 | −5.764631 |
| SC | −5.510059 | −5.366623 | −5.734145 | −5.507075 | −5.361924 | −5.728350 |
| Standardized residuals (12) | ||||||
| AC | 0.050 | 0.062 | 0.030 | 0.048 | 0.060 | 0.029 |
| Standardized residuals squared (12) | ||||||
| AC | 0.012 | 0.012 | 0.052 | 0.012 | 0.012 | 0.051 |
| ARCH–LM Test (12) | ||||||
| Obs*R2 | 9.984522 | 9.742550 | 13.28401 | 9.960117 | 9.442707 | 13.38535 |
[i] AIC, Akaike Information Criterion; SC, Schwarz Criterion.
Note: The results in the table are derived based on the following symmetric GARCH(1,1) and GARCH-M(1,1) models:
Table 6
Estimation of EGARCH(1,1) and TGARCH(1,1) for BIST-100 with good news
| Model | EGARCH(1,1) | TGARCH(1,1) | ||||
|---|---|---|---|---|---|---|
| Full sample | First subperiod | Second subperiod | Full sample | First subperiod | Second subperiod | |
| Mean equation | ||||||
| α0 | 0.000724*** | 0.000906** | 0.000333 | 0.000729** | 0.000934** | 0.000522 |
| α1 | 0.005798 | 0.057195* | −0.040277 | 0.008394 | 0.043277 | −0.050734 |
| α2 | −0.000510 | −0.000947 | 0.000183 | −0.000632 | −0.000833 | 0.000335 |
| Variance equation | ||||||
| ω | −0.366020*** | −0.433170*** | −0.138736*** | 1.02E-05*** | 1.02E-05*** | 3.25E-06*** |
| α1 | 0.147939*** | 0.192757*** | 0.003007 | 0.035126*** | 0.053410*** | −0.008972* |
| γ | −0.07549*** | −0.084255*** | −0.058738*** | 0.092297*** | 0.105968*** | 0.040310*** |
| β1 | 0.969516*** | 0.965389*** | 0.984060*** | 0.881138*** | 0.863366*** | 0.970516*** |
| α2 | −0.047879 | 0.012282 | −0.071438** | −2.17E-05** | −2.13E-05 | −1.08E-05 |
| α1 + β1 | 1.117455 | 1.158146 | 0.987067 | 0.916264 | 0.916776 | 0.961544 |
| AIC | −5.540874 | −5.395254 | −5.785344 | −5.540191 | −5.400103 | −5.769109 |
| SC | −5.521858 | −5.364113 | −5.749063 | −5.521175 | −5.368962 | −5.732828 |
| Standardized residuals (12) | ||||||
| AC | 0.052 | 0.060 | 0.043 | 0.055 | 0.028 | 0.048 |
| Standardized residuals squared | (12) | |||||
| AC | 0.032 | 0.032 | 0.061 | 0.028 | 0.028 | 0.073 |
| ARCH–LM test (12) | ||||||
| Obs*R2 | 15.58045 | 18.11254 | 16.88094 | 12.18862 | 13.19092 | 13.47925 |
[i] AIC, Akaike Information Criterion; SC, Schwarz Criterion.
Note: The results in the table are derived based on the following asymmetric EGARCH(1,1) and TGARCH(1,1) models:
Table 7
Estimation of EGARCH(1,1) and TGARCH(1,1) for BIST-100 with bad news
| EGARCH(1,1) | TGARCH(1,1) | |||||
|---|---|---|---|---|---|---|
| Model | Full sample | First subperiod | Second subperiod | Full sample | First subperiod | Second subperiod |
| Mean equation | ||||||
| a0 | 0.000821*** | 0.000743* | 0.000744* | 0.000774** | 0.000716* | 0.000934** |
| a | 0.006147 | 0.059654** | −0.046279 | 0.008156 | 0.042385 | −0.054156* |
| 1a2 | −0.001054 | 0.003145** | −0.002748*** | −0.001045 | 0.003549** | −0.003142*** |
| Variance equation | ||||||
| w | −0.335437*** | −0.380741*** | −0.142205*** | 8.82E-06*** | 1.06E-05*** | 7.00E-07 |
| a1 | 0.139369*** | 0.184271*** | 0.013892 | 0.033089*** | 0.049834*** | −0.014458** |
| γ1 | −0.071022*** | −0.079453*** | −0.050282*** | 0.092487*** | 0.100430*** | 0.039582*** |
| b1 | 0.972227*** | 0.969907*** | 0.985540*** | 0.886495*** | 0.870900*** | 0.978532*** |
| a2 | −0.030995 | −0.145424*** | 0.034923** | −1.11E-06 | −2.82E-05*** | 1.18E-05*** |
| a1 + b1 | 1.111596 | 1.154178 | 0.999432 | 0.919584 | 0.920734 | 0.964074 |
| AIC | −5.541641 | −5.401561 | −5.789227 | −5.539515 | −5.406895 | −5.782023 |
| SC | −5.522625 | −5.370420 | −5.752947 | −5.520500 | −5.375754 | −5.745742 |
| Standardized residuals (12) | ||||||
| AC | 0.050 | 0.059 | 0.033 | 0.053 | 0.064 | 0.036 |
| Standardized residuals squared | (12) | |||||
| AC | 0.031 | 0.025 | 0.058 | 0.026 | 0.022 | 0.063 |
| ARCH–LM Test (12) | ||||||
| Obs*R2 | 15.72301 | 16.89227 | 13.51268 | 12.02281 | 12.06731 | 11.94038 |
[i] AIC, Akaike Information Criterion; SC, Schwarz Criterion.
Note: The results in the table are derived based on the following asymmetric EGARCH(1,1) and TGARCH(1,1) models: