
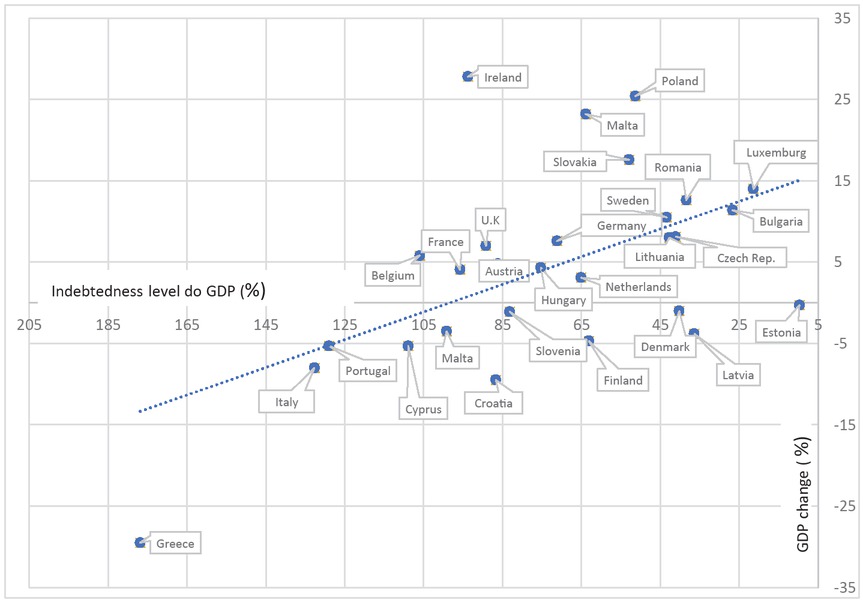
Figure 1
Indebtedness level (%) in relation to GDP in 2015 and GDP change in 2008–2015 in EU states.
Source: Own calculation based on Eurostat data [http://ec.europa.eu/Eurostat,access18/06/2018].
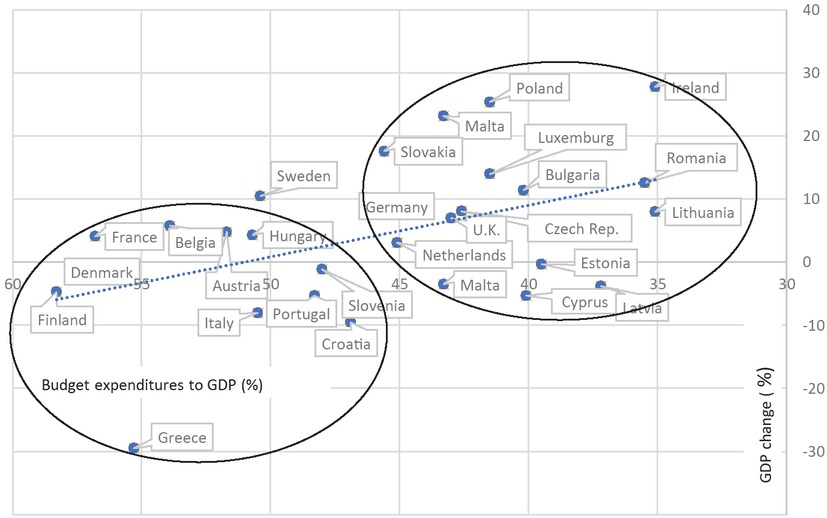
Figure 2
Budget expenditures (%) in relation to GDP in 2015 and GDP change in 2008-2015 in EU states.
Source: Own calculation based on Eurostat data [http://ec.europa.eu/Eurostat,access18/06/2018].
Table 1
The situation of member states in the context of the Macroeconomic Imbalance Procedure in 2017 (EU Commission opinion from March 2018)
| Procedure category | Member states |
|---|---|
| Lack of economic imbalance | Austria, Belgium, Denmark. Estonia, Lithuania, Luxemburg, Latvia, Malta, Poland, Czech |
| Republic, Romania, Slovakia, Hungary, United Kingdom, Finland, Slovenia | |
| Economic imbalance | Spain, Ireland, the Netherlands, Germany, Sweden, Bulgaria, France, Portugal |
| Excessive economic imbalance | Croatia, Cyprus, Italy |
Table 2
Changes in VAT, PIT, and CIT rates in 2008–2015 (data for EU member states)
| Country | VAT | PIT | CIT |
|---|---|---|---|
| Austria | − | − | − |
| Belgium | − | − | − |
| Bulgaria | − | − | − |
| Croatia | ↗ | ↘ | − |
| Cyprus | ↗ | ↗ | ↗ |
| Czech Rep. | ↗ | ↗ | ↘ |
| Denmark | − | ↘ | ↘ |
| Estonia | ↗ | ↘ | ↘ |
| Finland | ↗ | ↗ | ↘ |
| France | ↗ | ↗ | ↗ |
| Germany | − | − | − |
| Greece | ↗ | ↗ | ↘ |
| Hungary | ↗ | ↘ | ↘ |
| Ireland | ↗ | ↗ | − |
| Italy | ↗ | ↗ | − |
| Latvia | − | ↘ | − |
| Lithuania | ↗ | ↘ | − |
| Luxemburg | ↗ | ↗ | ↘ |
| Malta | − | − | − |
| Netherlands | ↗ | − | ↘ |
| Poland | ↗ | ↘ | − |
| Portugal | ↗ | ↗ | ↗ |
| Romania | ↗ | − | |
| Slovakia | ↗ | ↗ | ↗ |
| Slovenia | ↗ | ↗ | ↘ |
| Spain | ↗ | ↗ | ↘ |
| Sweden | − | ↗ | ↘ |
| UK | ↗ | ↗ | ↘ |
[i] Source: Own calculation based on Eurostat, Taxation trends in the European Union. Data for the EU member states, Iceland and Norway, DG Taxation and Customs Union, Luxemburg 2015.
Annex 1
Indebtedness level and government expenditures in relation to GDP in 2015 year and GDP change in 2008-2015 (data for EU member states in percentage)
| Country | Debt-to-GDP ratio in 2015 | Government expenditures as GDP percentage | GDP changes in 2008–2015 |
|---|---|---|---|
| Estonia | 9.7 | 39.5 | −0.3 |
| Luxemburg | 21.4 | 41.5 | 14.0 |
| Bulgaria | 26.7 | 40.2 | 11.4 |
| Latvia | 36.4 | 37.2 | −3.8 |
| Romania | 38.4 | 35.5 | 12.6 |
| Denmark | 40.2 | 55.7 | −1.0 |
| Czech Rep. | 41.1 | 42.6 | 8.1 |
| Lithuania | 42.7 | 35.1 | 8.0 |
| Sweden | 43.4 | 50.4 | 10.5 |
| Poland | 51.3 | 41.5 | 25.4 |
| Slovakia | 52.9 | 45.6 | 17.6 |
| Finland | 63.1 | 58.3 | −4.7 |
| Malta | 63.9 | 43.3 | 23.2 |
| Netherlands | 65.1 | 45.1 | 3.1 |
| Germany | 71.2 | 43.9 | 7.6 |
| Hungary | 75.3 | 50.7 | 4.3 |
| Slovenia | 83.2 | 48.0 | −1.1 |
| Austria | 86.2 | 51.7 | 4.8 |
| Croatia | 86.7 | 46.9 | −9.5 |
| United Kingdom | 89.2 | 43.0 | 7.0 |
| Ireland | 93.8 | 35.1 | 27.8 |
| France | 95.8 | 56.8 | 4.1 |
| Spain | 99.2 | 43.3 | −3.5 |
| Belgium | 106.0 | 53.9 | 5.8 |
| Cyprus | 108.9 | 40.1 | −5.3 |
| Portugal | 129.0 | 48.3 | −5.3 |
| Italy | 132.7 | 50.5 | −8.0 |
| Greece | 176.9 | 55.3 | −29.5 |
[i] Source: Own calculation based on Eurostat [http://ec.europa.eu/Eurostat,access18/04/2018].
Annex 2
Indebtedness level as a percentage of GDP in OECD countries (data for 2008 and 2014)
| Country | 2008 | 2014 | (%) |
|---|---|---|---|
| Old EU member states | |||
| Luxembourg | 18.0 | 27.3 | 52 |
| Sweden | 41.8 | 48.1 | 15 |
| Denmark | 32.3 | 49.4 | 53 |
| Germany | 41.8 | 53.5 | 28 |
| Finland | 32.5 | 59.9 | 85 |
| Netherland | 53.8 | 72.9 | 35 |
| Austria | 68.1 | 92.6 | 36 |
| France | 64.7 | 98.0 | 51 |
| Spain | 37.1 | 102.4 | 176 |
| United Kingdom | 55.4 | 108.0 | 95 |
| Belgium | 90.3 | 112.0 | 24 |
| Ireland | 46.7 | 122.4 | 162 |
| Italy | 103.1 | 146.7 | 42 |
| Portugal | 80.2 | 150.2 | 87 |
| Greece | 126.1 | 181.6 | 44 |
| Average value | 59.5 | 95.0 | 66 |
| New EU member states | |||
| Estonia | 5.1 | 10.1 | 96 |
| Latvia | 25.9 | 43.8 | 69 |
| Czech Republic | 30.5 | 52.0 | 70 |
| Poland | 50.2 | 53.0 | 6 |
| Slovakia | 32.8 | 58.0 | 77 |
| Slovenia | 26.7 | 94.0 | 253 |
| Hungary | 71.1 | 97.7 | 37 |
| Average value | 34.6 | 58.4 | 87 |
| OECD countries (no EU members) | |||
| Norway | 43.5 | 18.0 | −59 |
| Turkey** | 54.0 | 40.6 | −25 |
| Australia | 22.1 | 44.8 | 103 |
| Canada | 42.4 | 47.5 | 12 |
| Mexico | 44.0 | 49.9 | 13 |
| Israel | 103.4 | 92.9 | −10 |
| United States | 64.0 | 97.1 | 52 |
| Iceland*** | 85.7 | 103.2 | 20 |
| Japan | 147.3 | 207.4 | 41 |
| Average value | 67.4 | 77.9 | 16 |
[i] * OECD statistics are not available for Chile, South Korea, and Switzerland.
**For Turkey, the data are for 2009 instead of 2008.
***The last available data for Iceland are of 2013.
Source: OECD [http://stats.oecd.org/access:31/06/2018].
Annex 3
State aid in EU granted for enterprises in 2009-2012 (in billion EUR)
| Aid approved | Aid realized | |
|---|---|---|
| EU-27 | 82.9 | 36.4 |
| Germany | 29.6 | 17.7 |
| Austria | 10.2 | 1.8 |
| UK | 10.1 | 0.6 |
| Hungary | 9.7 | 0.3 |
| Belgium | 8.1 | 0.8 |
| Greece | 4 | 0.6 |
| Spain | 2.5 | 0.7 |
| Slovenia | 1.3 | 1.5 |
| Sweden | 1.3 | 1.1 |
| Czech Republic | 1.1 | 0.4 |
| Portugal | 0.8 | 0.8 |
| Latvia | 0.6 | 0.2 |
| France | 0.6 | 6.2 |
| Luxemburg | 0.5 | 0.6 |
| Finland | 0.5 | 0.9 |
| Romania | 0.4 | 0.4 |
| Slovakia | 0.4 | 0 |
| Italy | 0.4 | 1 |
| Ireland | 0.4 | 0.4 |
| Poland | 0.2 | 0 |
| Estonia | 0.2 | 0 |
| Lithuania | 0.1 | 0 |
| Malta | 0 | 0 |
| Bulgaria | 0 | 0 |
| Denmark | 0 | 0.2 |
| Netherlands | 0 | 0.1 |
| Cyprus | 0 | 0 |
[i] Source: EU Commission, State aid granted under the temporary framework [http://ec.europa.eu/competition/state_aid/scoreboard/financial_economic_crisis_aid_en.html].
Annex 4
CIT and VAT rates in EU countries (data for 2016 in %)
| Country | CIT | PIT | ||
|---|---|---|---|---|
| SME | Others | Maximum value | Minimum value | |
| New EU member states | ||||
| Bulgaria | 10 | 10 | 10 | |
| Lithuania | 5 | 15 | 15 | 15 |
| Latvia | 9 | 15 | 23 | 23 |
| Cyprus | 12.5 | 35 | 20 | |
| Romania | 16 | 16 | 16 | |
| Slovenia | 17 | 50 | 16 | |
| Czech Republic | 19 | 22 | 15 | |
| Poland | 19 | 32 | 18 | |
| Croatia | 20 | 40 | 12 | |
| Estonia | 20 | 20 | 20 | |
| Hungary | 16 | 20.6 | 16 | 16 |
| Slovakia | 22 | 25 | 19 | |
| Malta | 35 | 35 | 15 | |
| Average | 18.5 | 26.1 | 16.5 | |
| Median | 19 | 23 | 16 | |
| Old EU member states | ||||
| Ireland | 12.5 | 48 | 20 | |
| Finland | 20 | 51.6 | 6.5 | |
| U.K. | 20 | 45 | 20 | |
| Sweden | 22 | 57 | 20 | |
| Denmark | 23.5 | 55.8 | 8 | |
| Austria | 25 | 50 | 36.5 | |
| Netherlands | 25 | 52 | 36.5 | |
| Spain | 25 | 28 | 46 | 19.5 |
| Greece | 29 | 48 | 22 | |
| Luxemburg | 29.2 | 43.6 | 0 | |
| Portugal | 17 | 29.5 | 56.5 | 14.5 |
| Germany | 30.2 | 50.5 | 14 | |
| Italy | 31.4 | 48.9 | 23 | |
| Belgium | 34 | 53.8 | 25 | |
| France | 15 | 38 | 50.3 | 14 |
| Average | 26.5 | 50.5 | 18.6 | |
| Median | 28 | 50.3 | 20 | |
[i] Source: Own calculation based on Eutostat, Taxation trends in the European Union. Data for the EU member states, Iceland and Norway, DG Taxation and Customs Union, Luxemburg 2015.
Annex 5
Income of indirect taxes as a percentage of governmental budget income in EU countries (data for 2015 in %) and changes in VAT rates in 2008–2015
| Country | Indirect taxes as a % of governmental budget income | VAT as a % of governmental income | VAT rates before changes | VAT rates in 2016 | Δ |
|---|---|---|---|---|---|
| Bulgaria | 54.0 | 33.0 | 20.0 | 20.0 | 0.0 |
| Croatia | 52.0 | 35.0 | 23.0 | 25.0 | 2.0 |
| Hungary | 49.0 | 23.0 | 25.0 | 27.0 | 2.0 |
| Sweden | 49.0 | 20.0 | 25.0 | 25.0 | 0.0 |
| Romania | 47.0 | 30.0 | 19.0 | 20.0 | 1.0 |
| Cyprus | 44.0 | 24.0 | 17.0 | 19.0 | 2.0 |
| Latvia | 43.0 | 26.0 | 21.0 | 21.0 | 0.0 |
| Lithuania | 42.0 | 28.0 | 19.0 | 21.0 | 2.0 |
| Estonia | 42.0 | 26.0 | 18.0 | 20.0 | 2.0 |
| Slovenia | 40.0 | 23.0 | 20.0 | 22.0 | 2.0 |
| Poland | 39.0 | 21.0 | 22.0 | 23.0 | 1.0 |
| Malta | 39.0 | 23.0 | 18.0 | 18.0 | 0.0 |
| Portugal | 37.0 | 22.0 | 20.0 | 23.0 | 3.0 |
| Czech Republic | 37.0 | 21.0 | 19.0 | 21.0 | 2.0 |
| UK | 37.0 | 20.0 | 15.0 | 20.0 | 5.0 |
| Greece | 36.0 | 19.0 | 21.0 | 23.0 | 2.0 |
| Ireland | 36.0 | 19.0 | 21.5 | 23.0 | 1.5 |
| Denmark | 35.0 | 20.0 | 25.0 | 25.0 | 0.0 |
| Slovakia | 35.0 | 21.0 | 19.0 | 20.0 | 1.0 |
| Italy | 34.0 | 13.0 | 21.0 | 22.0 | 1.0 |
| Finland | 33.0 | 21.0 | 22.0 | 24.0 | 2.0 |
| Spain | 33.0 | 18.0 | 18.0 | 21.0 | 3.0 |
| Austria | 33.0 | 18.0 | 20.0 | 20.0 | 0.0 |
| France | 33.0 | 14.0 | 19.6 | 20.0 | 0.4 |
| Luxemburg | 33.0 | 19.0 | 15.0 | 17.0 | 2.0 |
| Netherlands | 31.0 | 18.0 | 19.0 | 21.0 | 2.0 |
| Belgium | 28.0 | 14.0 | 21.0 | 21.0 | 0.0 |
| Germany | 28.0 | 18.0 | 19.0 | 19.0 | 0.0 |
[i] Bruksela 2016, s. 1-24 oraz Eutostat, Taxation trends in the European Union. Data for the EU Member States, Iceland and Norway, DG Taxation and Customs Union, Luxemburg 2015.
* Latvia has changed the VAT rate for one year only in 2011 to the 22% level.
**In Romania, the VAT level during 2010–2015 was 24%.
Source: Own calculation based on: European Commision, “VAT Rates Applied in the Member States of the European Union”