
Figure 1

Figure 2
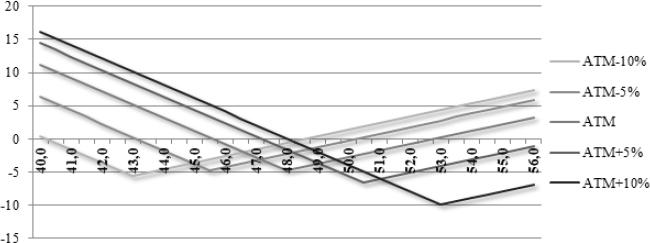
Figure 3

Percentage changes (MOM) of WTI crude oil prices in the construction of strategy during the period of activity of the options
| Change (month on month) | |||||
|---|---|---|---|---|---|
| Above 10% | 5%–10% | Less than 5% | |||
| Increase | Decrease | Increase | Decrease | Increase | Decrease |
| 02.2015 (11.52%) | 12.2014 | 05.2015 (6.59%) | 08.2014 | 09.2014 (0.45%) | 07.2014 |
| (–26.89%) | (–5.49%) | (–2.65%) | |||
| 04.2015 (19.39%) | 01.2015 | 08.2016 (5.15%) | 10.2014 | 10.2015 (4.22%) | 06.2015 |
| (–12.65%) | (–9.62%) | (–0.96%) | |||
| 09.2015 (15.80%) | 03.2015 | 10.2016 (9.76%) | 11.2014 | 02.2016 (3.93%) | 04.2016 |
| (–12.20%) | (–6.04%) | (–2.75%) | |||
| 03.2016 (20.19%) | 07.2015 | 12.2016 (7.16%) | 11.2015 | 02.2017 (0.21%) | 06.2016 |
| (–16.54%) | (–9.62%) | (–3.73%) | |||
| 05.2016 (12.35%) | 08.2015 | 04.2017 (9.69%) | 07.2016 | 08.2017 (2.37%) | 01.2017 |
| (–14.55%) | (–6.22%) | (–0.04%) | |||
| 01.2018 (10.29%) | 12.2015 | 07.2017 (8.28%) | 09.2016 | 09.2017 (2.87%) | 05.2017 |
| (–14.41%) | (–9.52%) | (–0.87%) | |||
| 01.2016 | 11.2017 (7.12%) | 03.2017 | 10.2017 (2.73%) | 03.2018 | |
| (–13.33%) | (–8.88%) | (–0.41%) | |||
| 11.2016 | 02.2018 | 12.2017 (1.86%) | |||
| (–10.18%) | (–5.18%) | ||||
| 06.2017 | |||||
| (–13.67%) |
The median values (USDs per barrel) achieved in crude oil price fluctuations exceeding 10% (Category 1)
| Strategies | Variant | USD/barrel | |
|---|---|---|---|
| Long position | Short position | ||
| Long strip | ATM+10% (C) + 2× ATM+10% (P) | 8.52 | |
| Long strip | ATM+5% (C) + 2× ATM+5% (P) | 7.09 | |
| Long strip | ATM (C)+ 2× ATM (P) | 4.35 | |
| Long strap | 2× ATM+10% (C) + ATM+10% (P) | 3.29 | |
| Long strip | ATM-5% (C)+ 2× ATM-5% (P) | 3.24 | |
| Short butterfly spread | 2× ATM+5% | ATM-10% + ATM+10% | 2.87 |
| Long strap | 2× ATM (C) + ATM (P) | 2.56 | |
| Long strap | 2× ATM+5% (C)+ ATM+5% (P) | 2.33 | |
| Short butterfly spread | 2× ATM | ATM-10% + ATM+5% | 1.73 |
| Short butterfly spread | 2× ATM | ATM-10% + ATM+10% | 1.65 |
| Short butterfly spread | 2× ATM+5% | ATM-5% + ATM+10% | 1.52 |
| Long strip | ATM-10% (C) + 2× ATM-10% (P) | 1.07 | |
| Short butterfly spread | 2× ATM | ATM-5% + ATM+5% | 0.45 |
| Short butterfly spread | 2× ATM+5% | ATM + ATM+10% | 0.40 |
| Short butterfly spread | 2× ATM-5% | ATM-10% + ATM | 0.29 |
| Short butterfly spread | 2× ATM | ATM-5% + ATM+10% | 0.13 |
| Short butterfly spread | 2× ATM-5% | ATM-10% + ATM+5% | –0.38 |
| Short butterfly spread | 2× ATM-5% | ATM-10% + ATM+10% | –0.93 |
| Long strap | 2× ATM-5% (C) + ATM-5% (P) | –1.33 | |
| Long strap | 2× ATM-10% (C) + ATM-10% (P) | –6.39 | |
The results (USDs per barrel) and statistics for the best long strip strategy in Category 1
| Month | Changes (MoM, %) | Options | ||
|---|---|---|---|---|
| ATM+10% | ATM+5% | ATM | ||
| 12.2014 | –26.89% | 40.58 | 38.93 | 35.08 |
| 01.2015 | –12.65% | 10.86 | 8.77 | 5.02 |
| 02.2015 | 11.52% | –15.09 | –8.63 | –3.19 |
| 03.2015 | –12.20% | 8.52 | 5.93 | 2.62 |
| 04.2015 | 19.39% | –8.64 | –2.41 | 2.74 |
| 07.2015 | –16.54% | 18.88 | 17.00 | 13.75 |
| 08.2015 | –14.55% | 14.12 | 11.99 | 8.36 |
| 09.2015 | 15.80% | –5.79 | –1.23 | 2.16 |
| 12.2015 | –14.41% | 10.96 | 9.30 | 6.74 |
| 01.2016 | –13.33% | 8.23 | 7.27 | 5.11 |
| 03.2016 | 20.19% | –7.86 | –5.10 | –2.71 |
| 05.2016 | 12.35% | –9.10 | –3.81 | –0.64 |
| 11.2016 | –10.18% | 8.61 | 7.09 | 4.35 |
| 06.2017 | –13.67% | 13.08 | 11.84 | 9.50 |
| 01.2018 | 10.29% | –12.02 | –4.15 | 2.10 |
| Median | 8.52 | 7.09 | 4.35 | |
| Mean | 5.02 | 6.19 | 6.07 | |
| Standard deviation | 14.82 | 11.82 | 9.20 | |
| Number of losses | 6 | 6 | 3 | |
| Number of profits | 9 | 9 | 12 | |
| Pearson correlation coefficient for changes and results | –0.91 | –0.85 | –0.71 | |
The results achieved in short butterfly spread, depending on the price level of the underlying instrument on the expiry date of the option
| Interval | Short call butterfly spread | Short put butterfly spread |
|---|---|---|
| [0;K1) | −c(K1 ) + 2c(K0 ) − c(K2 ) | K2 − 2K0 + K1 − p(K1 ) + 2 p(K0 ) − p(K2 ) |
| [K1 ;K0 ) | K1 − f T − c ( K1 ) + 2 c ( K0 ) − c ( K2 ) | K2 + f T − 2 K0 − p ( K1 ) + 2 p ( K0 ) − p ( K2 ) |
| [K0 ;K2 ) | 2 K0 − f T − K1 − c ( K1 ) + 2 c ( K0 ) − c ( K2 ) | K2 − f T − p ( K1 ) + 2 p ( K0 ) − p ( K2 ) |
| [K2 ;∞) | −K2 + 2K0 − K1 − c(K1 ) + 2c(K0 ) − c(K2 ) | − p(K1 ) + 2 p(K0 ) − p(K2 ) |
Median values (USDs per barrel) achieved in crude oil price changes ranging from 5% to 10% (Category 2)
| Strategy | Variant | USD/ barrel | |
|---|---|---|---|
| Long positionn | Short position | ||
| Long strip | ATM+10% (C) + 2× ATM+10% (P) | 6.25 | |
| Long strip | ATM+5% (C) + 2× ATM+5% (P) | 5.10 | |
| Long strap | 2× ATM+10% (C) + ATM+10% (P) | 2.85 | |
| Short butterfly spread | 2× ATM+5% | ATM-10% + ATM+10% | 2.46 |
| Short butterfly spread | 2× ATM+5% | ATM-5% + ATM+10% | 1.76 |
| Long strip | 2× ATM (P) + ATM (C) | 1.68 | |
| Long strap | 2× ATM (C) + ATM (P) | 1.50 | |
| Short butterfly spread | 2× ATM | ATM-10% + ATM+10% | 1.31 |
| Long strap | 2× ATM+5% (C) + ATM+5% (P) | 1.21 | |
| Short butterfly spread | 2× ATM | ATM-5% + ATM+10% | 1.18 |
| Short butterfly spread | 2× ATM | ATM-10% + ATM+5% | 0.56 |
| Short butterfly spread | 2× ATM | ATM-5% + ATM+5% | 0.53 |
| Short butterfly spread | 2× ATM-5% | ATM-10% + ATM | 0.45 |
| Short butterfly spread | 2× ATM +5% | ATM + ATM+10% | 0.38 |
| Short butterfly spread | 2× ATM-5% | ATM-10% + ATM+5% | –0.39 |
| Short butterfly spread | 2× ATM-5% | ATM-10% + ATM+10% | –0.59 |
| Long strip | ATM-5% (C) + 2× ATM-5% (P) | –0.90 | |
| Long strip | ATM-10% (C) + 2× ATM-10% (P) | –3.43 | |
| Long strap | 2× ATM-5% (C) + ATM-5% (P) | –3.48 | |
| Long strap | 2× ATM-10% (C) + ATM-10% (P) | –6.62 | |
Median values (USDs per barrel) achieved in crude oil price changes below 5% (Category 3)
| Strategies | Variant | USD/barrel | |
|---|---|---|---|
| Long position | Short position | ||
| Short butterfly spread | 2× ATM-5% | ATM-10% + ATM | 0.37 |
| Short butterfly spread | 2× ATM+5% | ATM + ATM+10% | 0.12 |
| Short butterfly spread | 2× ATM-5% | ATM-10% + ATM+5% | –0.02 |
| Short butterfly spread | 2× ATM-5% | ATM-10% + ATM+10% | –0.46 |
| Long strip | ATM-10% (C) + 2× ATM-10% (P) | –0.66 | |
| Short butterfly spread | 2× ATM | ATM-5% + ATM+5% | –0.80 |
| Short butterfly spread | 2× ATM+5% | ATM-5% + ATM+10% | –0.81 |
| Long strap | 2× ATM-10% (C) + ATM-10% (P) | –0.99 | |
| Short butterfly spread | 2× ATM | ATM-5% + ATM+10% | –1.13 |
| Short butterfly spread | 2× ATM | ATM-10% + ATM+5% | –1.17 |
| Long strap | 2× ATM+10% (C) + ATM+10% (P) | –1.23 | |
| Long strip | ATM-5% (C) + 2× ATM-5% (P) | –1.25 | |
| Short butterfly spread | 2× ATM+5% | ATM-10% + ATM+10% | –1.26 |
| Short butterfly spread | 2× ATM | ATM-10% + ATM+10% | –1.63 |
| Long strap | 2× ATM-5% (C) + ATM-5% (P) | –1.67 | |
| Long strip | ATM+10% (C) + 2× ATM+10% (P) | –1.75 | |
| Long strap | 2× ATM+5% (C) + ATM+5% (P) | –2.34 | |
| Long strip | ATM+5% (C) + 2× ATM+5% (P) | –2.59 | |
| Long strap | 2× ATM (C) + ATM (P) | –3.48 | |
| Long strip | ATM (C) + 2× ATM (P) | –3.72 | |