
Table 1
Quantitative assessment of solution accuracy.
| Value of ℨ | Analytical solution | Numerical solution | Absolute Error |
|---|---|---|---|
| 0 | 0 | 0 | 0 |
| 0.001 | 6.4999929583425E-03 | 6.4995747258827E-03 | 4.18232459840732E-07 |
| 0.002 | 1.2999943666960E-02 | 1.2999132552942E-02 | 8.11114018119466E-07 |
| 0.003 | 1.9499809877224E-02 | 1.9498656582726E-02 | 1.15329449833571E-06 |
| 0.004 | 2.5999549342707E-02 | 2.5998129917533E-02 | 1.41942517404431E-06 |
| 0.005 | 3.2499119820273E-02 | 3.2497535660779E-02 | 1.58415949379903E-06 |
| 0.006 | 3.8998479071179E-02 | 3.8996856917374E-02 | 1.62215380586361E-06 |
| 0.007 | 4.5497584862178E-02 | 4.5496076794095E-02 | 1.50806808276588E-06 |
| 0.008 | 5.1996394966605E-02 | 5.1995178399960E-02 | 1.21656664561764E-06 |
| 0.009 | 5.8494867165487E-02 | 5.8494144846599E-02 | 7.22318888091156E-07 |
| 0.01 | 6.4992959248630E-02 | 6.4992959248630E-02 | 1.38777878078145E-17 |
Table 2
Quantitative assessment of solution accuracy.
| Value of ℨ | Analytical solution | Numerical solution | Absolute Error |
|---|---|---|---|
| 0 | 0 | 0 | 0 |
| 0.001 | 9.99999666666800E-04 | 9.99979867286439E-04 | 1.97993803609242E-08 |
| 0.002 | 1.99999733333760E-03 | 1.99995893459001E-03 | 3.83987475887151E-08 |
| 0.003 | 2.99999100003240E-03 | 2.99993640193329E-03 | 5.45980991108024E-08 |
| 0.004 | 3.99997866680320E-03 | 3.99991146934972E-03 | 6.71974534757411E-08 |
| 0.005 | 4.99995833375000E-03 | 4.99988333688908E-03 | 7.49968609116067E-08 |
| 0.006 | 5.99992800103679E-03 | 5.99985120462290E-03 | 7.67964138817870E-08 |
| 0.007 | 6.99988566890756E-03 | 6.99981427264991E-03 | 7.13962576490146E-08 |
| 0.008 | 7.99982933770229E-03 | 7.99977174110146E-03 | 5.75966008307255E-08 |
| 0.009 | 8.99975700787294E-03 | 8.99972281014699E-03 | 3.41977259531168E-08 |
| 0.01 | 9.99966667999946E-03 | 9.99966667999946E-03 | 0 |
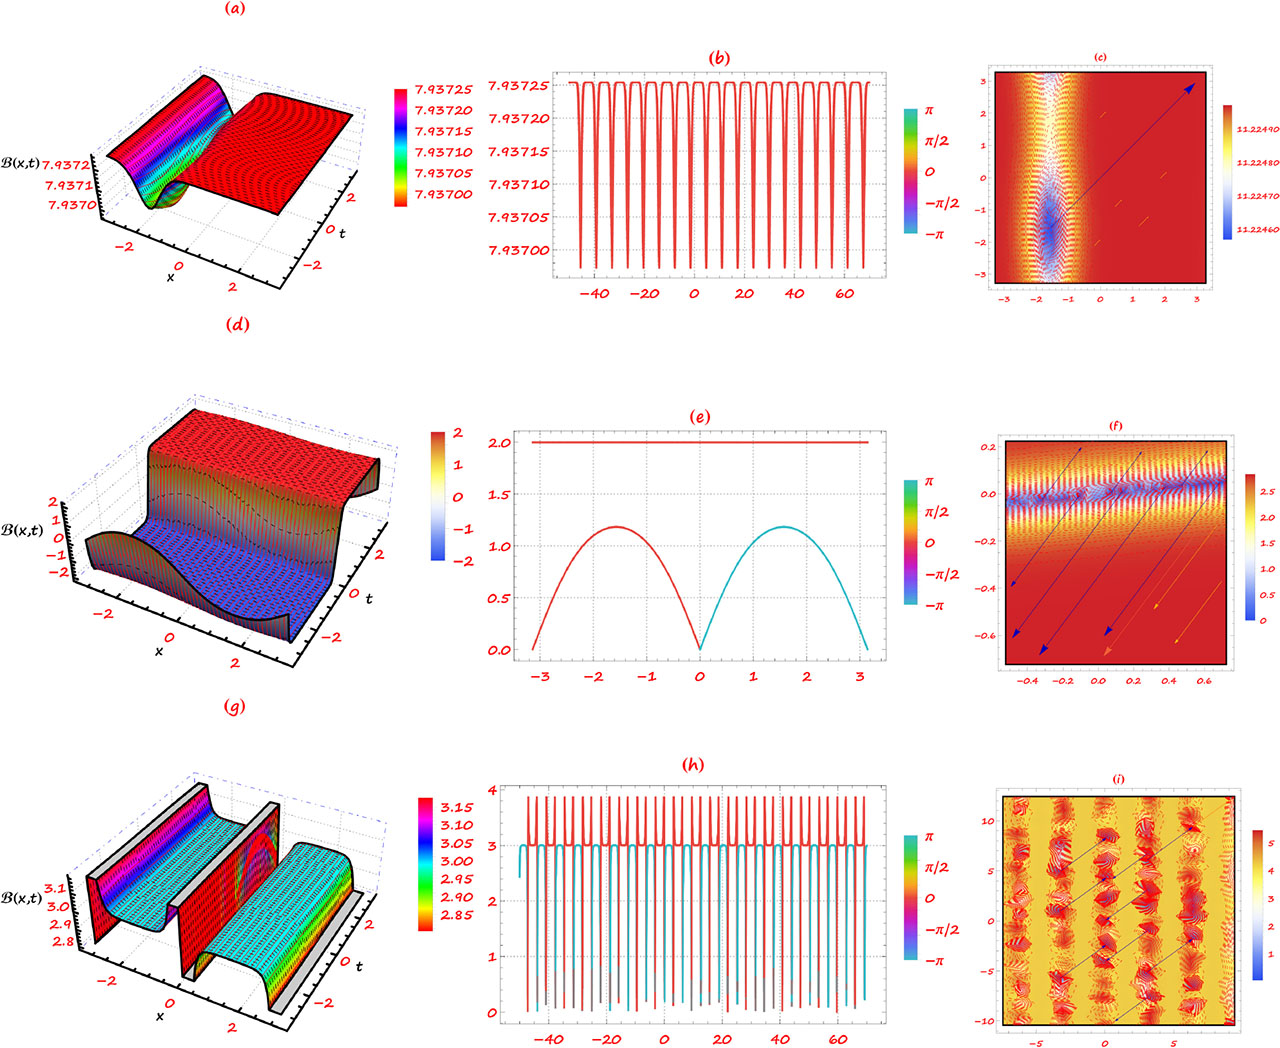
Fig. 1
Analytical solitary wave solutions of the mBBM equation represented through diverse graphical techniques via 3D, 2D and contour plots for equations (11), (13), (15).
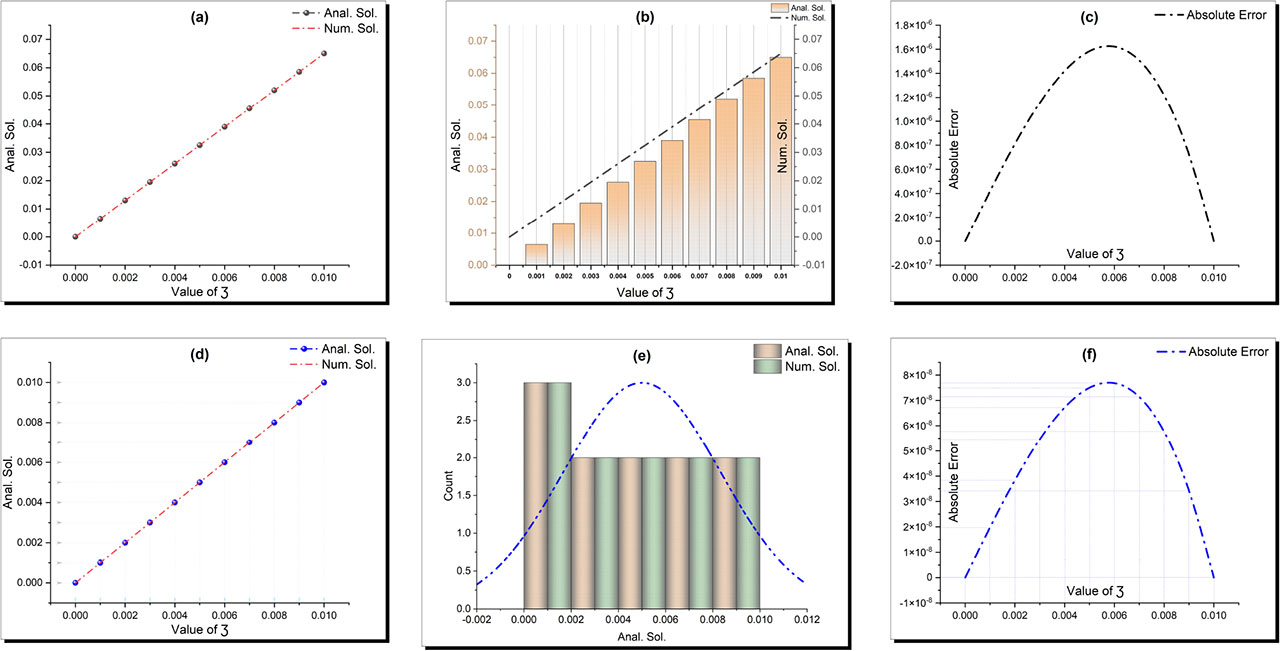
Fig. 2
Quantitative validation of analytical solutions against numerical solutions through absolute error analysis. (a–c) Absolute error between solutions obtained via the EAE method and the ECBS numerical method at defined intervals. (d–f) Absolute error comparison between solutions derived from the IKud method and ECBS numerical solutions at specified intervals.
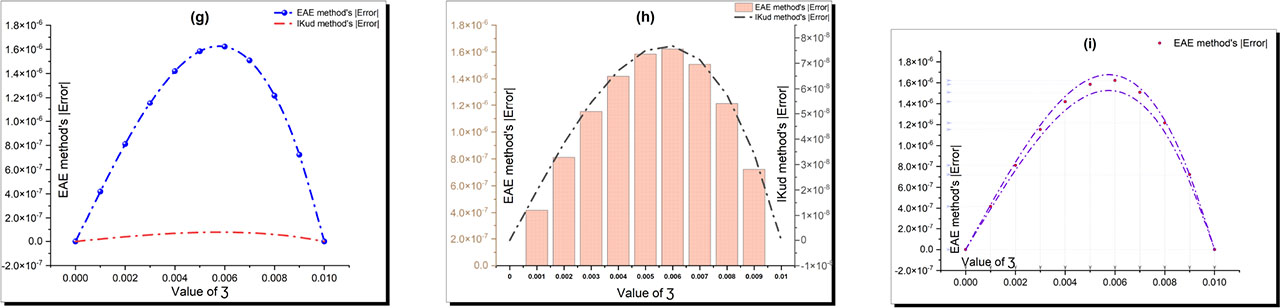
Fig. 3
Comparative assessment of solution accuracy for the IKud and EAE analytical techniques, benchmarked against ECBS numerical solutions.
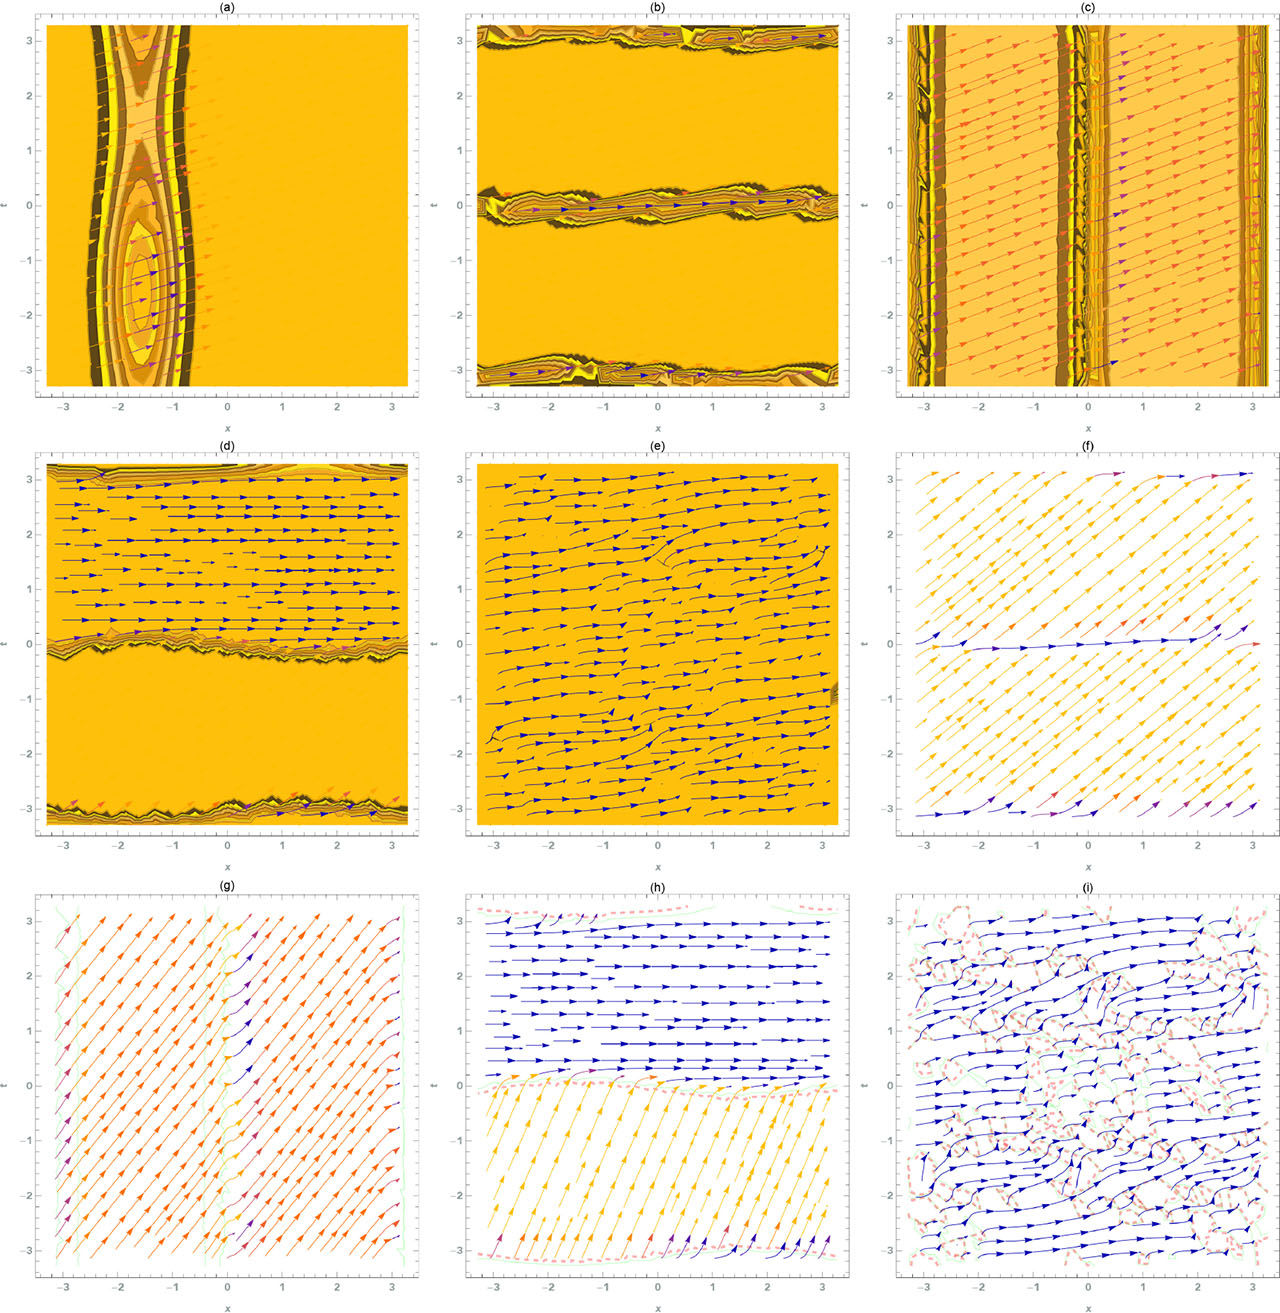
Fig. 4
Stream plot illustrating the propagation of solitary wave solutions in the mBBM model.
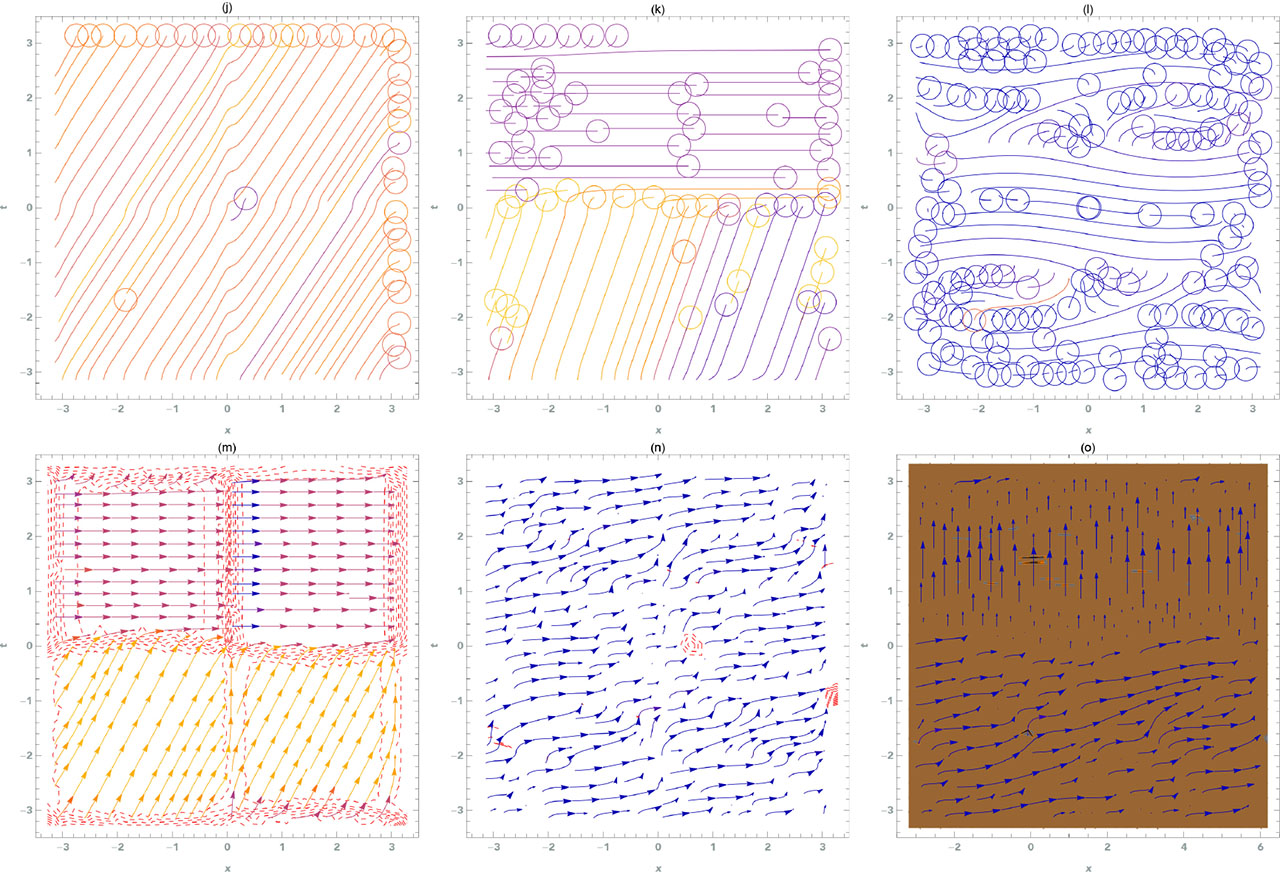
Fig. 5
Comparative stream plots demonstrating the influence of parameter modifications on the propagation behavior of solitary waves in the mBBM model.