
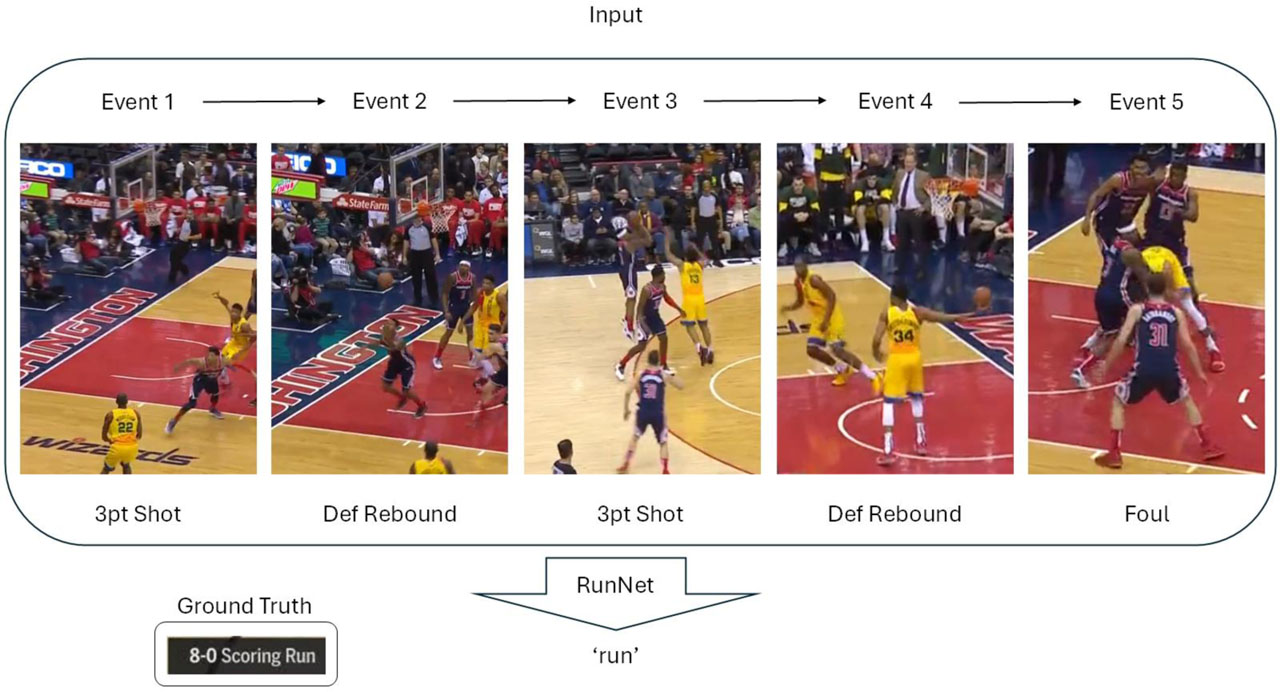
Fig 1.
A sequence of five events leading to a scoring run
Table 1.
Full Data Sample
| Feature | Value | Feature | Value |
|---|---|---|---|
| URL | /boxscores/201910240GSW.html | FoulType | N/A |
| GameType | regular | Fouler | N/A |
| Location | Chase Center San Francisco California | Fouled | N/A |
| Date | October 24 2019 | Rebounder | N/A |
| Time | 10:30 PM | ReboundType | N/A |
| WinningTeam | LAC | ViolationPlayer | N/A |
| Quarter | 1 | ViolationType | N/A |
| SecLeft | 297 | TimeoutTeam | N/A |
| AwayTeam | LAC | FreeThrowShooter | N/A |
| AwayPlay | N/A | FreeThrowOutcome | N/A |
| AwayScore | 20 | FreeThrowNum | N/A |
| HomeTeam | GSW | EnterGame | N/A |
| HomePlay | S. Curry makes 2-pt jump shot from 21 ft | LeaveGame | N/A |
| HomeScore | 14 | TurnoverPlayer | N/A |
| Shooter | S. Curry - curryst01 | TurnoverType | N/A |
| ShotType | 2-pt jump shot | TurnoverCause | N/A |
| ShotOutcome | make | TurnoverCauser | N/A |
| ShotDist | 21 | JumpballAwayPlayer | N/A |
| Assister | N/A | JumpballHomePlayer | N/A |
| Blocker | N/A | JumpballPoss | N/A |
Table 2.
Features
| Shooting | Violations | Defense | Rebounding | Misc |
|---|---|---|---|---|
| Shooter | Violation Player | Blocker | Rebounder | Timeout Team |
| Free Throw Shooter | Rebound Type | Substitution | ||
| Shot Distance |
Table 3.
Transformed Data Example
| ShotDist1 | Shooter1 | Rebounder1 | Fouler1 |
|---|---|---|---|
| … | … | … | … |
| NaN | NaN | NaN | fouler_away |
| NaN | NaN | rebounder_away | NaN |
| close | shooter_home | NaN | NaN |
| 3pt | shooter_away | NaN | NaN |
| NaN | NaN | NaN | NaN |
| … | … | … | … |
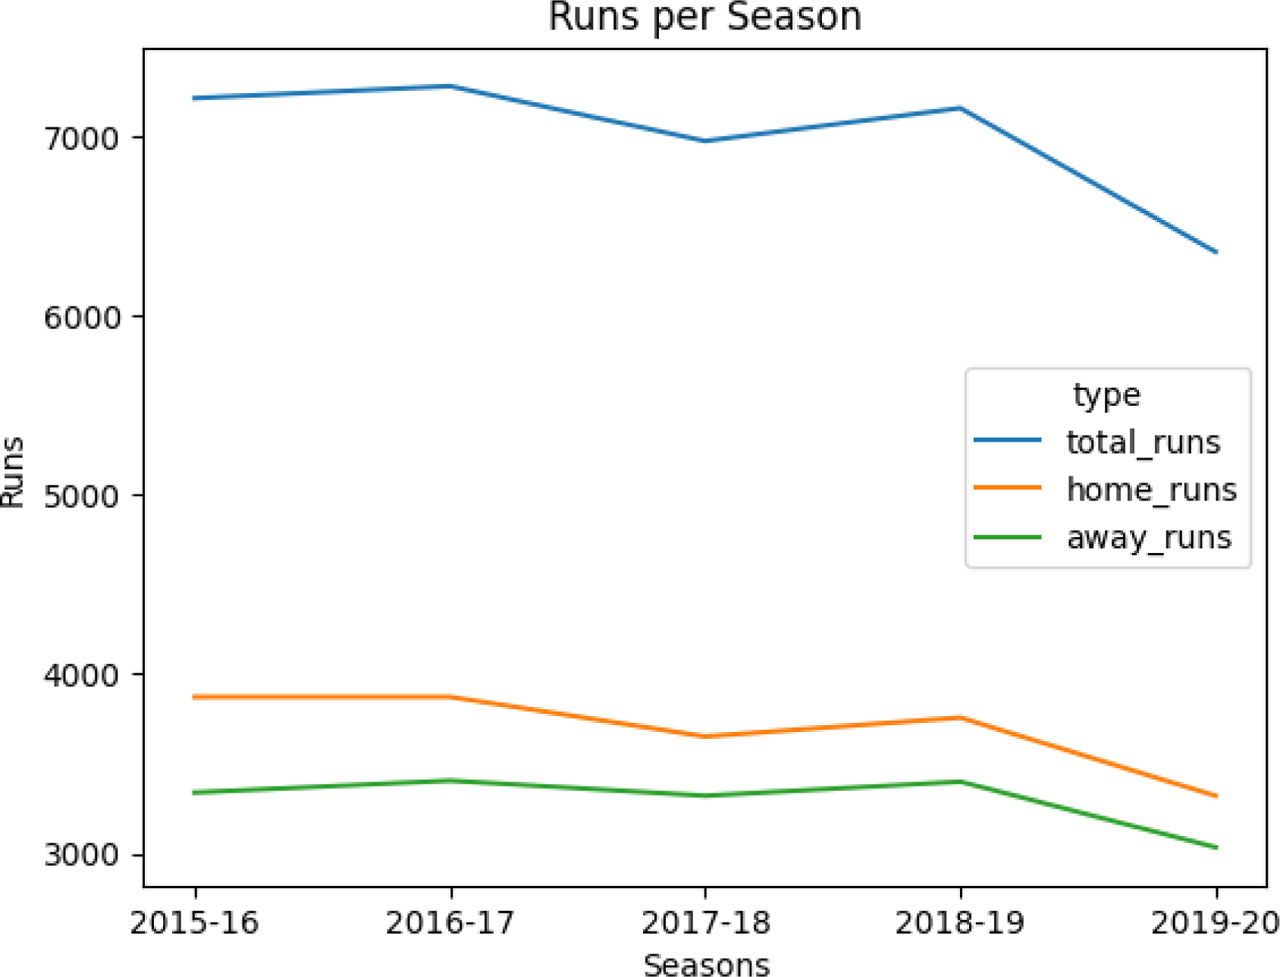
Fig 2.
Runs Recorded per Season
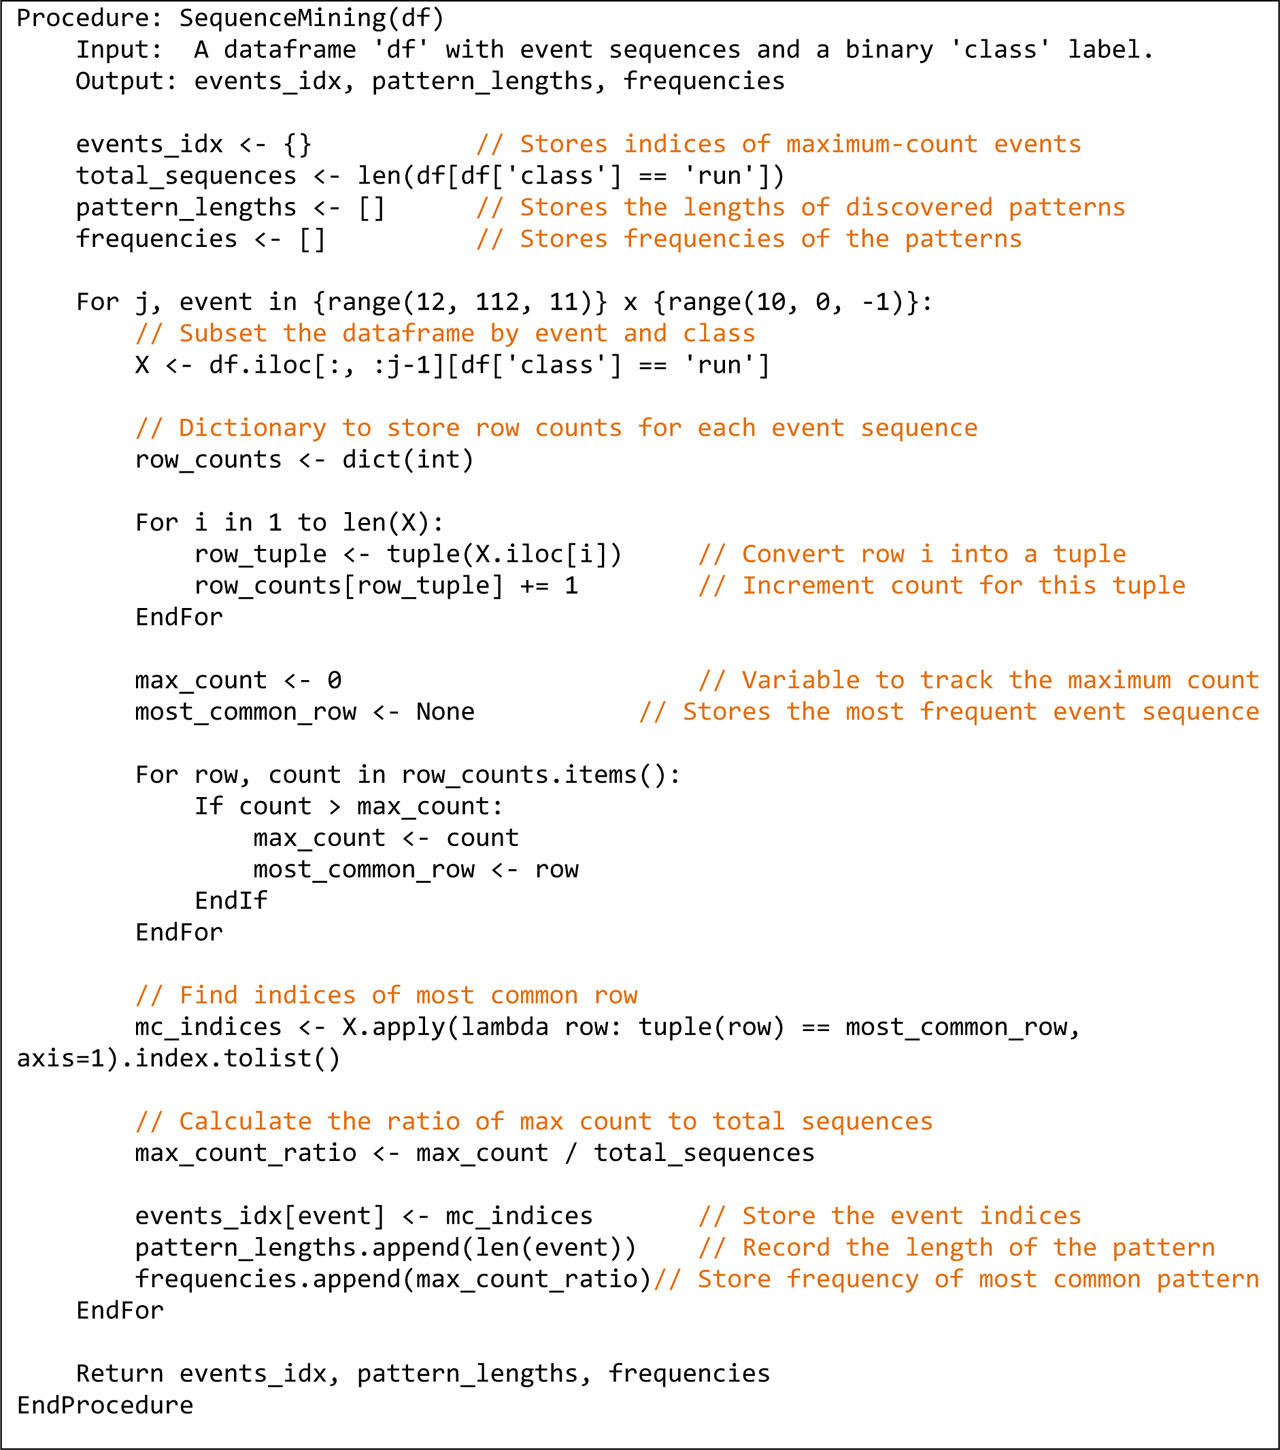
Algorithm 1.
A step-by-step representation of the proposed sequence mining workflow.

Fig 3.
Model Architecture
Table 4.
Home Rules: The table demonstrates the frequency of the most common sequences mined per length. Sequence length indicates how many events are contained in the sequence. ‘Freq’ and ‘2nd Freq’ indicate the number of occurrences of the most common and second most common sequence per length. Similarly, ‘Ratio’ and ‘2nd Ratio’ present their relative frequency. Finally, ‘Rules’ demonstrate the specific events that the most common sequence is comprised of.
| Sequence Length | Freq | 2nd Freq | Ratio | 2nd Ratio | Rules |
|---|---|---|---|---|---|
| Last | 4737 | 2577 | 42.1% | 23.1% | DefFoul(S)→run |
| Last 2 | 566 | 438 | 10.6% | 8.2% | CloseShot(O)→DefFoul(S)→run |
| Last 3 | 142 | 104 | 5.0% | 3.7% | DefReb(O)→3ptShot(O)→DefReb(S)→run |
| Last 4 | 61 | 42 | 3.3% | 2.3% | 3ptShot(S)→DefReb(O)→3ptShot(O)→DefFoul(S)→run |
| Last 5 | 19 | 16 | 1.3% | 1.1% | 3ptShot(S)→DefReb(S)→3ptShot(O)→DefReb(S)→OffFoul(S)→run |
Table 5.
Away Rules: The table demonstrates the frequency of the most common sequences mined per length. Sequence length indicates how many events are contained in the sequence. ‘Freq’ and ‘2nd Freq’ indicate the number of occurrences of the most common and second most common sequence per length. Similarly, ‘Ratio’ and ‘2nd Ratio’ present their relative frequency. Finally, ‘Rules’ demonstrate the specific events that the most common sequence is comprised of.
| Events | Freq | 2nd Freq | Ratio | 2nd Ratio | Rules |
|---|---|---|---|---|---|
| Last | 4135 | 2304 | 41% | 22.7% | DefFoul(S)→run |
| Last 2 | 107 | 88 | 2.2% | 1.9% | 3ptShot(O)→DefReb(S)→run |
| Last 3 | 84 | 65 | 3.1% | 2.4% | DefFoul(O)→FTShot(S)→OffReb(S)→run |
| Last 4 | 3 | 2 | 0.15% | 0.1% | 3ptShot(S)→DefReb(O)→MidShot(O)→DefFoul(S)→run |
| Last 5 | 2 | 2 | 0.17% | 0.17% | 3ptShot(S)→DefReb(S)→CloseShot(S)→OffReb(S)→DefFoul(O)→run |
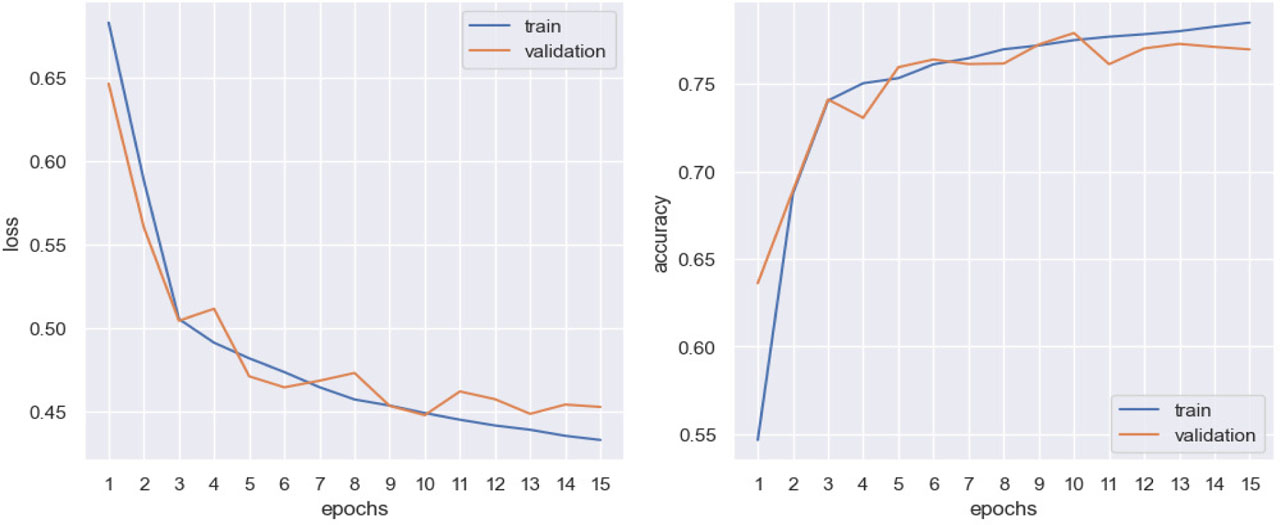
Fig 4.
Calculated Loss & Accuracy
Table 6.
Traditional Classifiers Performance
| Classifier | Accuracy | Precision | Recall | ft-score |
|---|---|---|---|---|
| RunNet | 0.81 | 0.86 | 0.81 | 0.81 |
| Random Forest | 0.79 | 0.78 | 0.78 | 0.78 |
| Support Vector | 0.76 | 0.73 | 0.73 | 0.73 |
| Decision Tree | 0.73 | 0.73 | 0.73 | 0.73 |
| k-Nearest Neighbors | 0.59 | 0.59 | 0.59 | 0.59 |
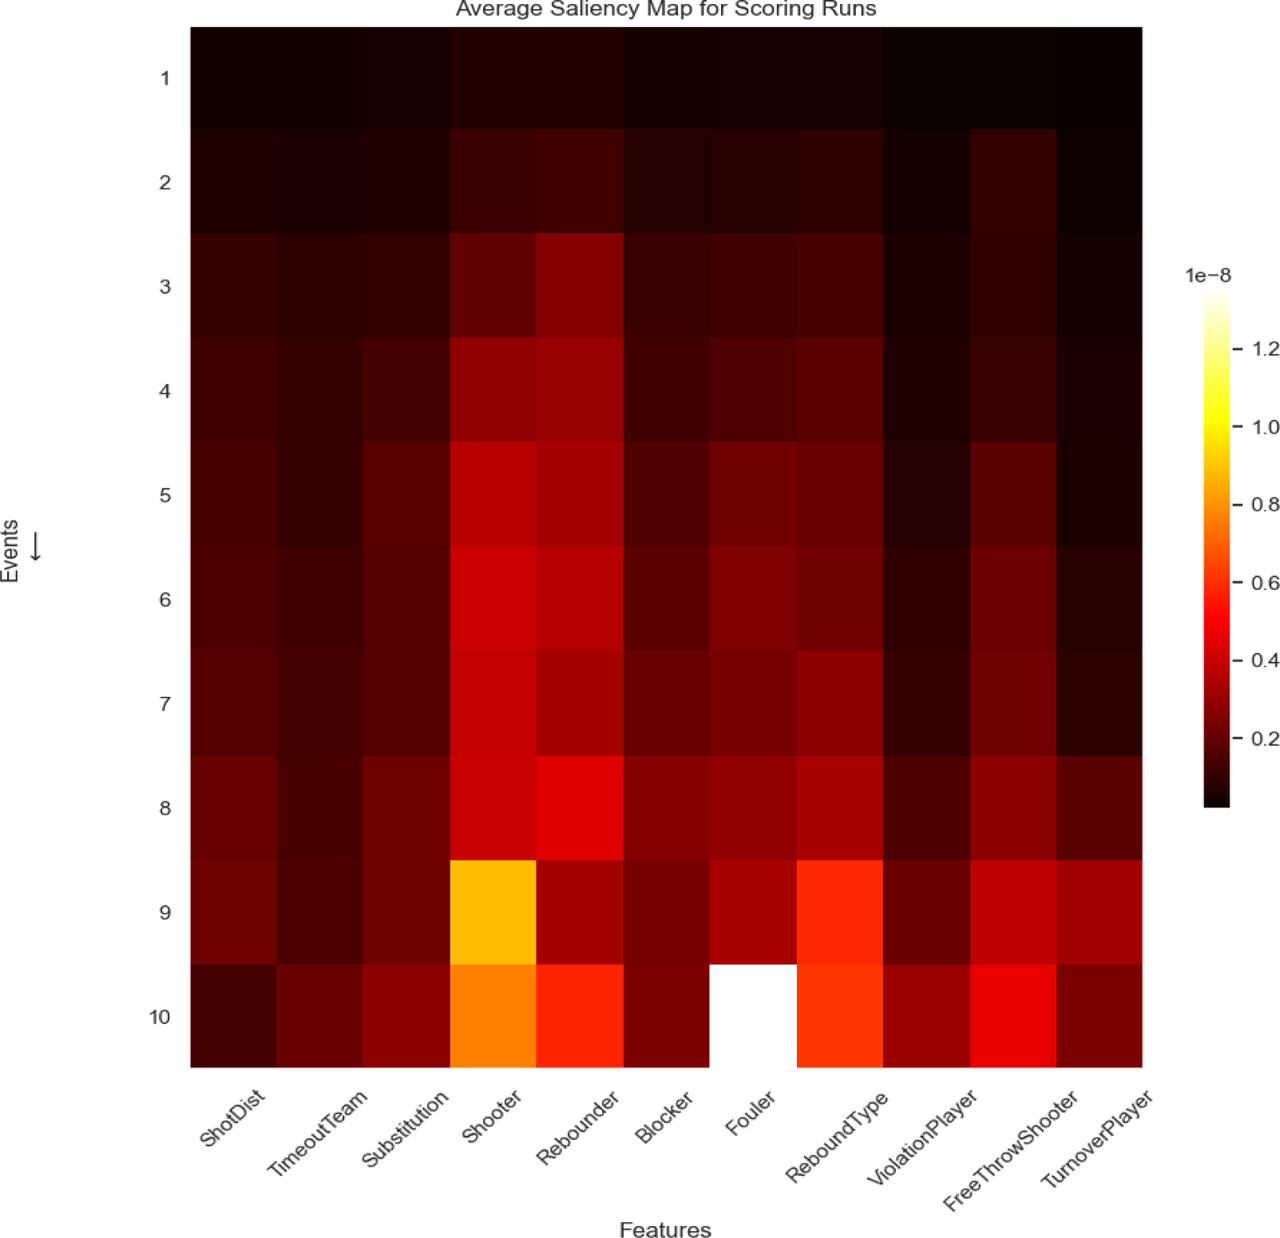
Fig 5.
Saliency Map of RunNet’s focus on input features. Event 1 indicates the event at the start of the pre-run sequence, while Event 10 indicates the event right before the run.