
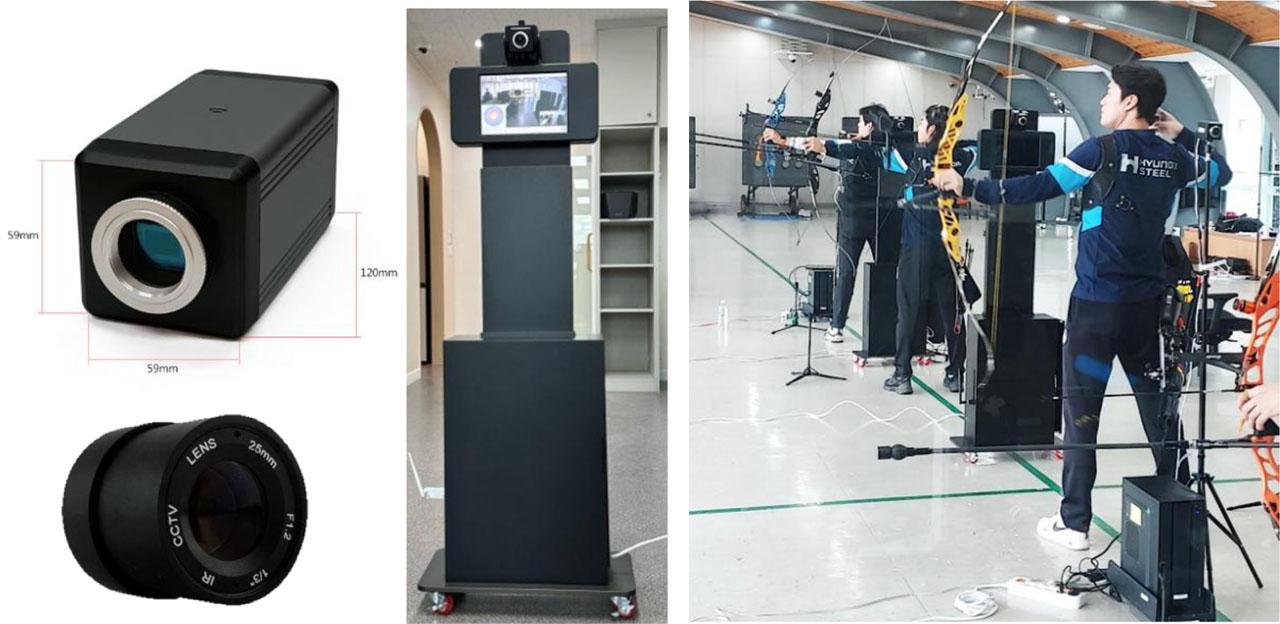
Figure 1.
Environment Experimental Setup and Recording Environment Used for Video Analysis
Table 1.
RTMO Joint Extraction Key Points
| Index | Joint | Index | Joint |
|---|---|---|---|
| 1 | Nose | 10 | Left wrist |
| 2 | Left eye | 11 | Right wrist |
| 3 | Right eye | 12 | Left hip |
| 4 | Left ear | 13 | Right hip |
| 5 | Right ear | 14 | Left knee |
| 6 | Left shoulder | 15 | Right knee |
| 7 | Right shoulder | 16 | Left ankle |
| 8 | Left elbow | 17 | Right ankle |
| 9 | Right elbow |
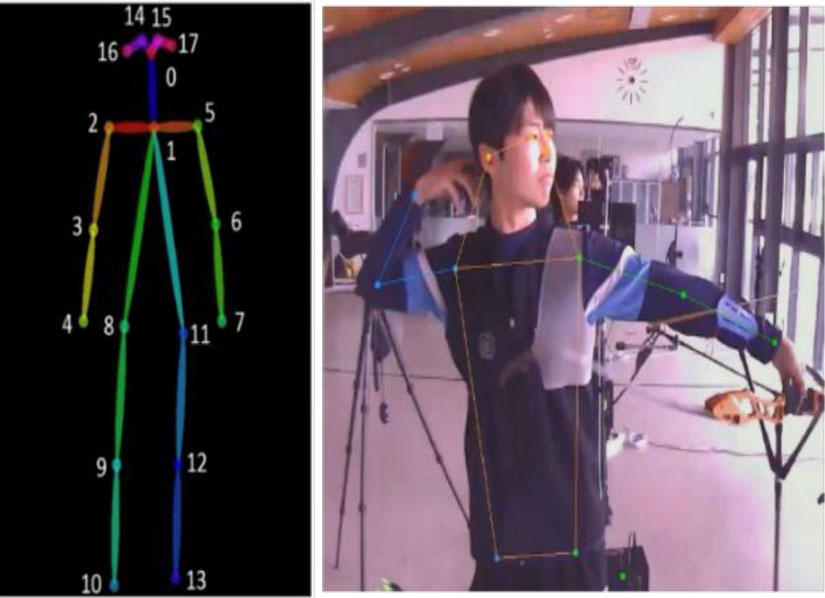
Figure 2.
Example of Joint Extraction in Archery Shooting
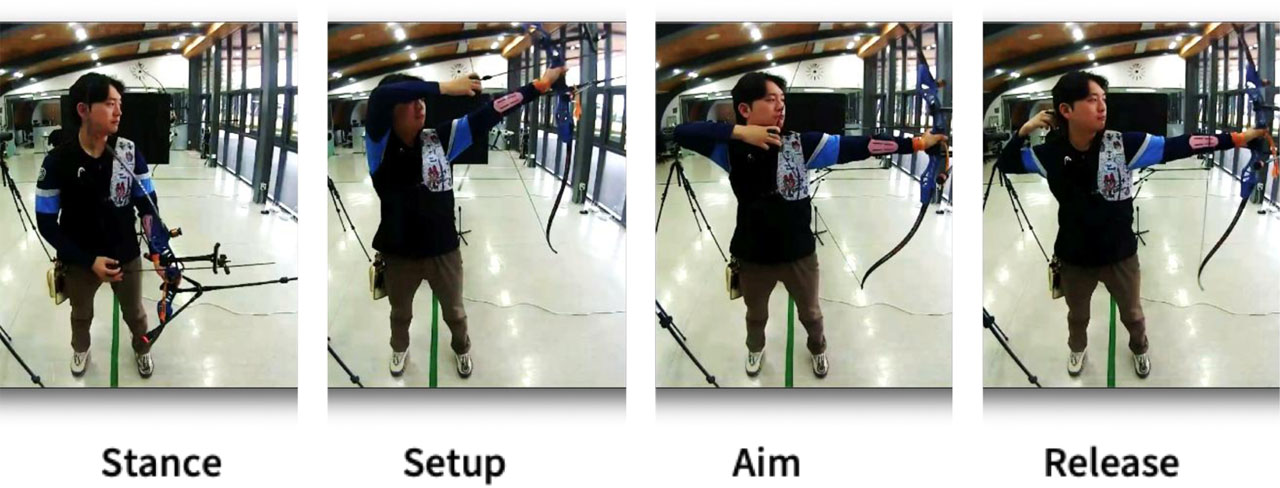
Figure 3.
Shooting Process from Actual Video Clips Used
Table 2.
Architecture of Sequence Models for Archery Motion Analysis.
| Layer | Attribute | Description |
|---|---|---|
| Input Layer 1 | Unit | 128 |
| Return sequences | True | |
| Activation | Tanh | |
| Input shape | (None, 900, 12) | |
| Dropout | Rate | 0.3 |
| Input Layer 2 | Unit | 32 |
| Return sequences | True | |
| Activation | Tanh | |
| Dropout | Rate | 0.3 |
| Pooling Layer | Global Average Pooling | 1D |
| Dense Layer 1 | Unit | 16 |
| Activation | ReLU | |
| Dense Layer 2 | Unit | y_train.shape[1] |
| Activation | Softmax |
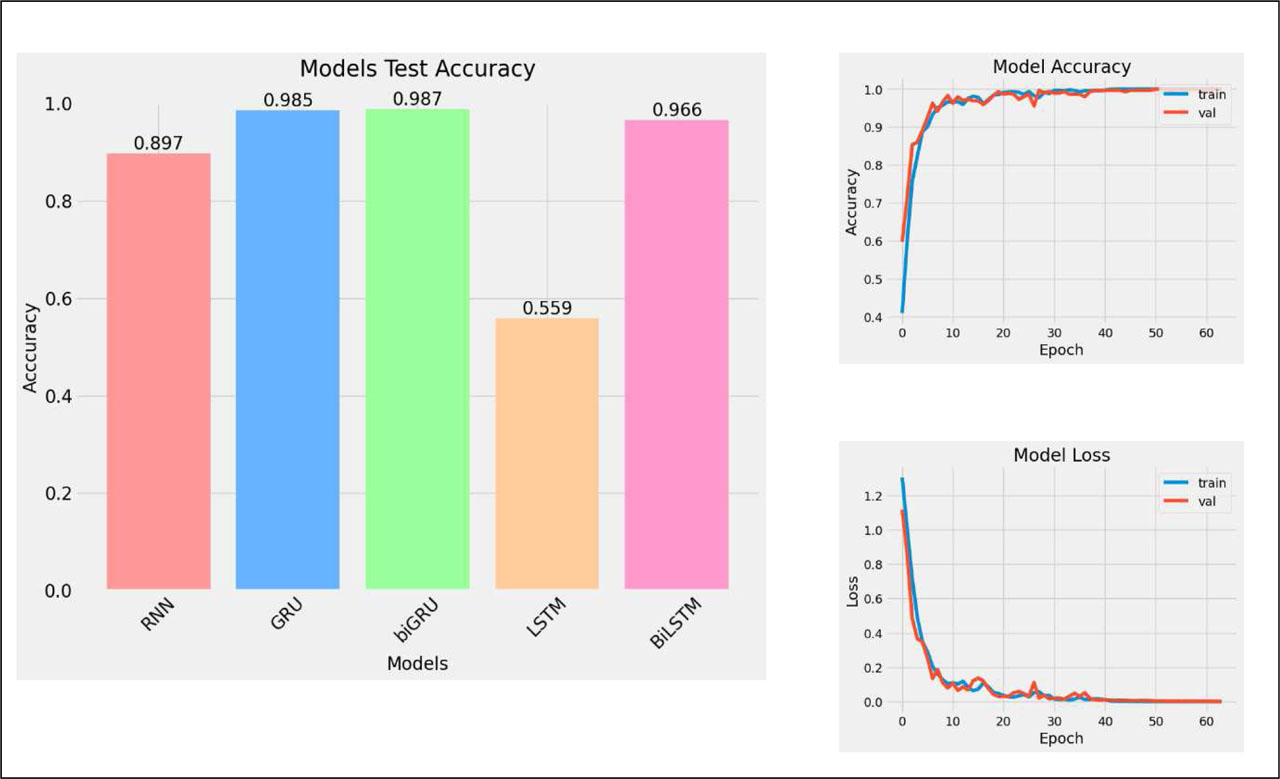
Figure 4.
Sequence Model Training Accuracy
Table 3.
Performance Evaluation Metrics of Sequence Models
| Model | Accuracy | Precision | Recall | F1-score |
|---|---|---|---|---|
| RNN | 89.7 | 90.1 | 89.7 | 89.8 |
| GRU | 98.5 | 98.5 | 98.5 | 98.5 |
| Bi-GRU | 98.7 | 98.7 | 98.7 | 98.7 |
| LSTM | 55.9 | 60.5 | 55.9 | 49.3 |
| Bi-LSTM | 96.6 | 96.6 | 96.6 | 96.6 |
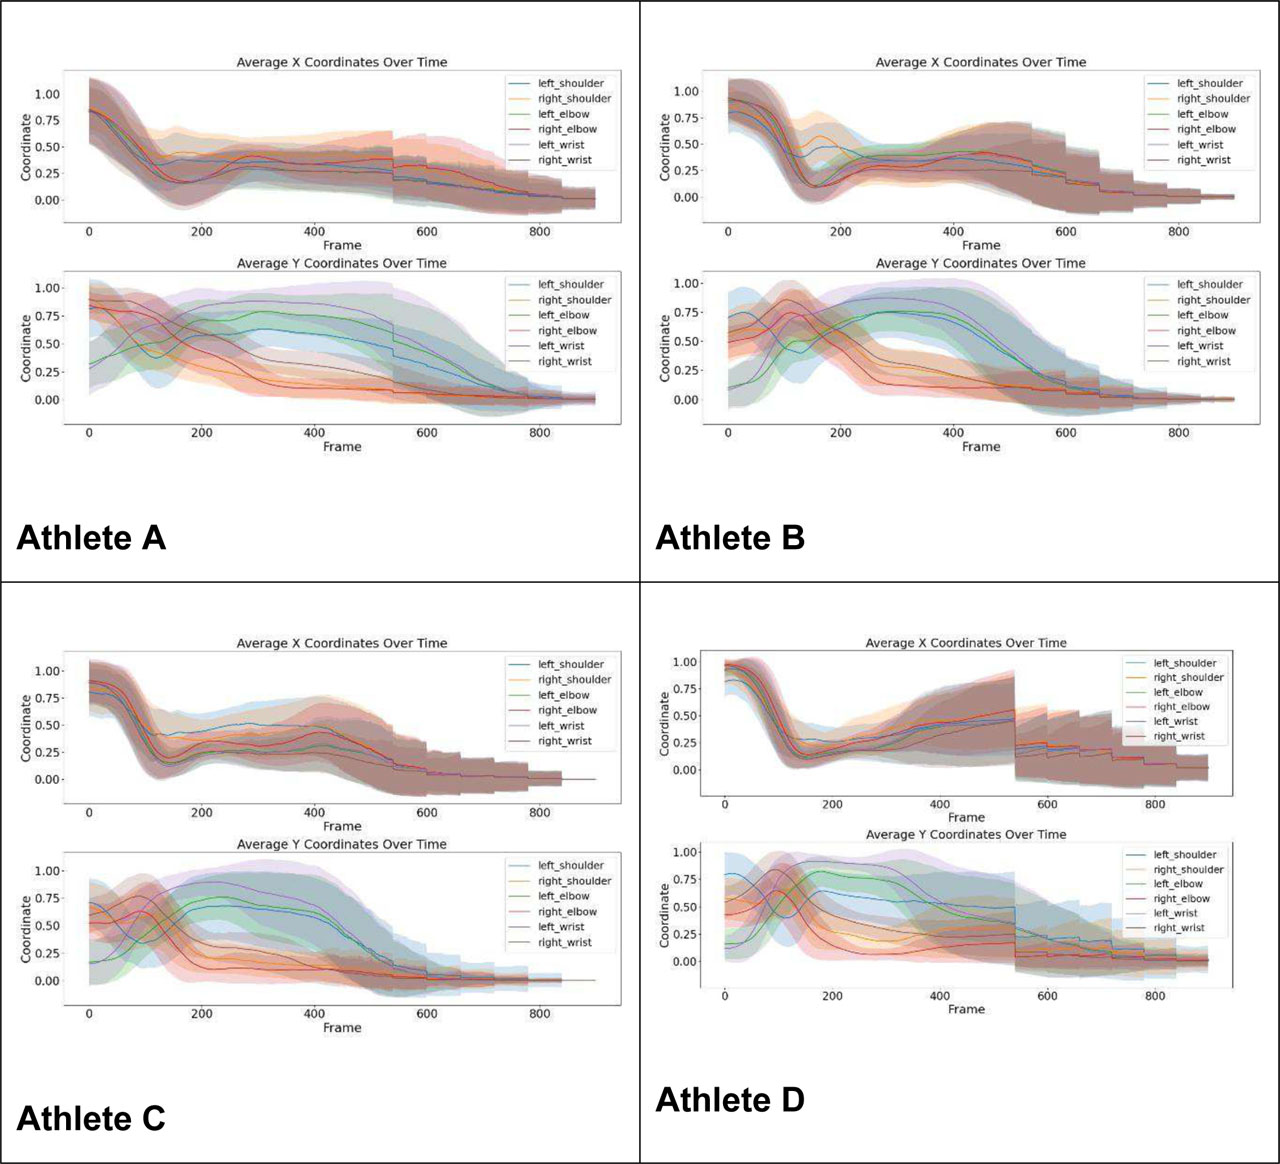
Figure 5.
Visualization of Athletes' Shooting Patterns.
Note: Normalized x- and y-coordinate trajectories for four athletes across complete shooting sequences. Narrow variance indicates higher motion consistency.
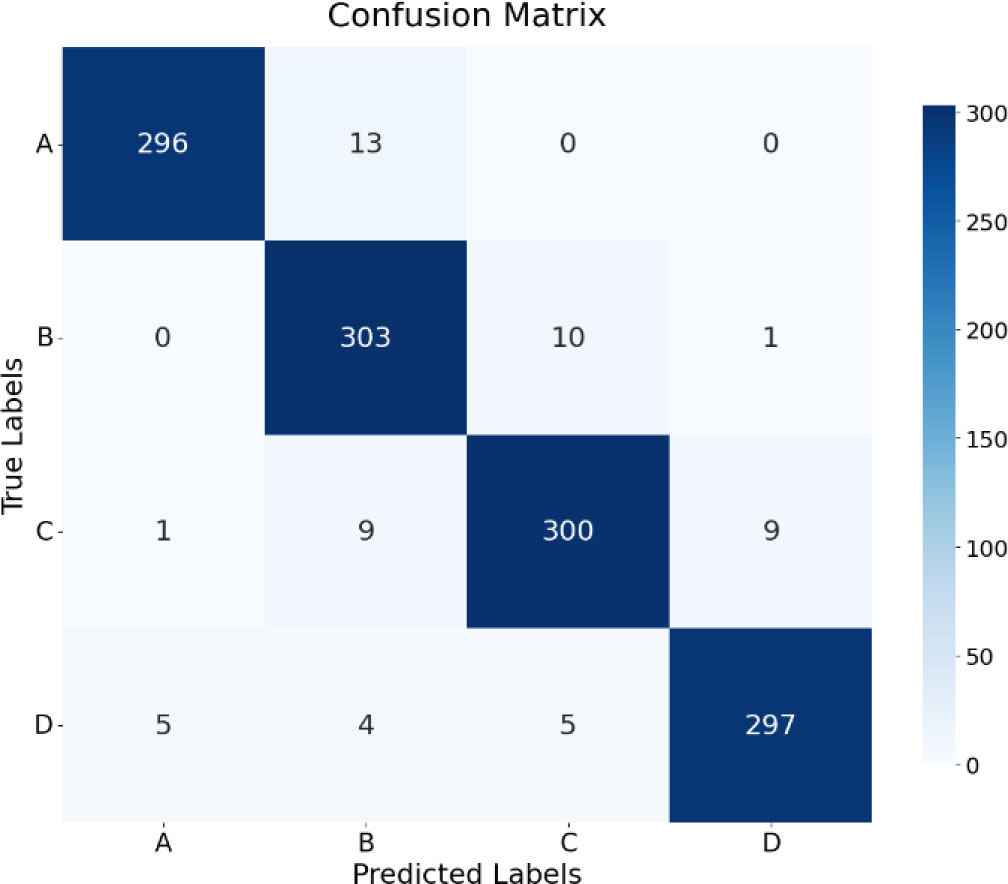
Figure 6.
Confusion Matrix of the Bi-GRU Model.
Note: X-axis = predicted classes (A D), Y-axis = actual classes. Overall accuracy reached 98%.
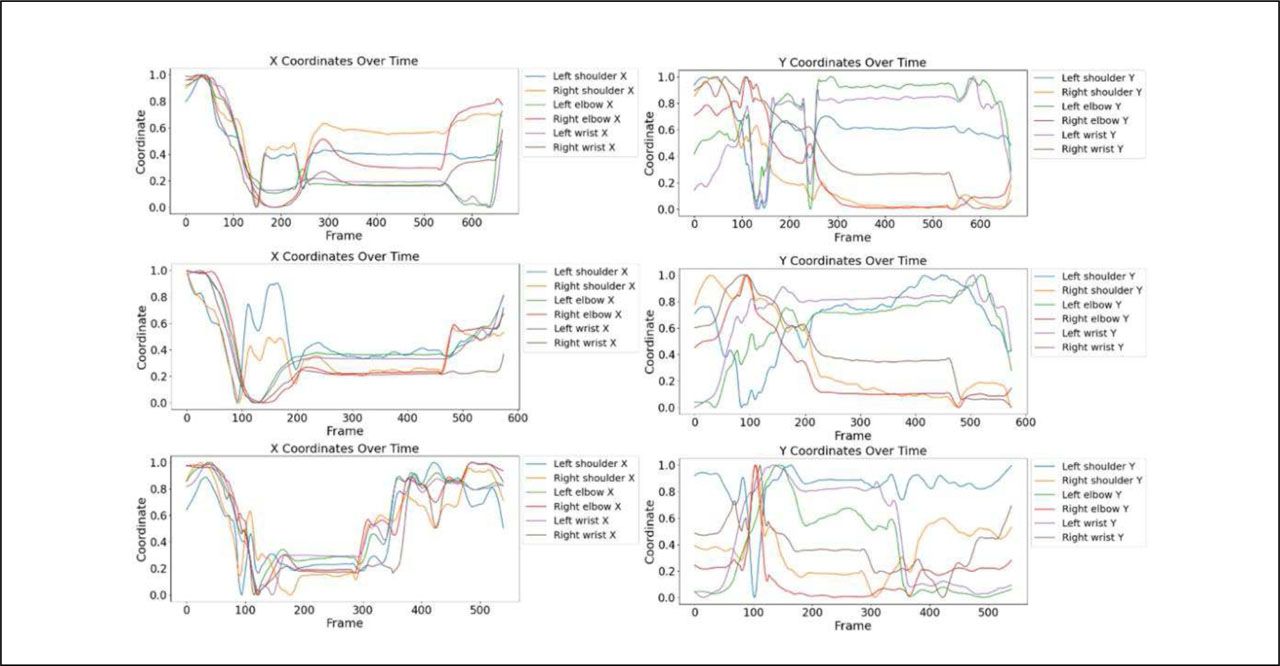
Figure 7.
Joint Variation Graphs for Three Shooting Instances of Athlete A.
Note: Left panel shows x-coordinate trajectories; right panel shows y-coordinate trajectories for key joints across three shooting instances.
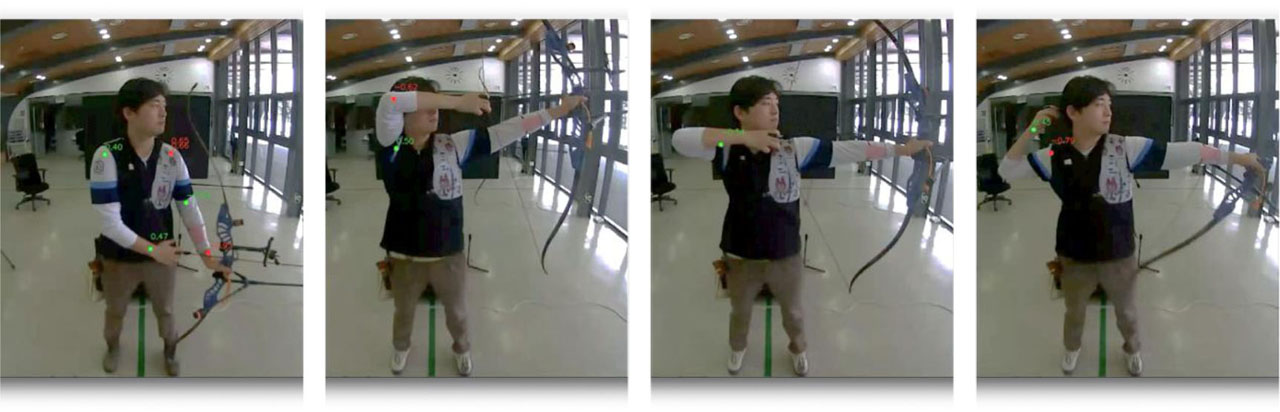
Figure 8.
Field Application Example of Feedback for Consistent Shooting Motion
Note: Error rates for each joint are overlaid on actual shooting video frames. Joints exceeding a standard error threshold of 0.4 are highlighted for corrective training.