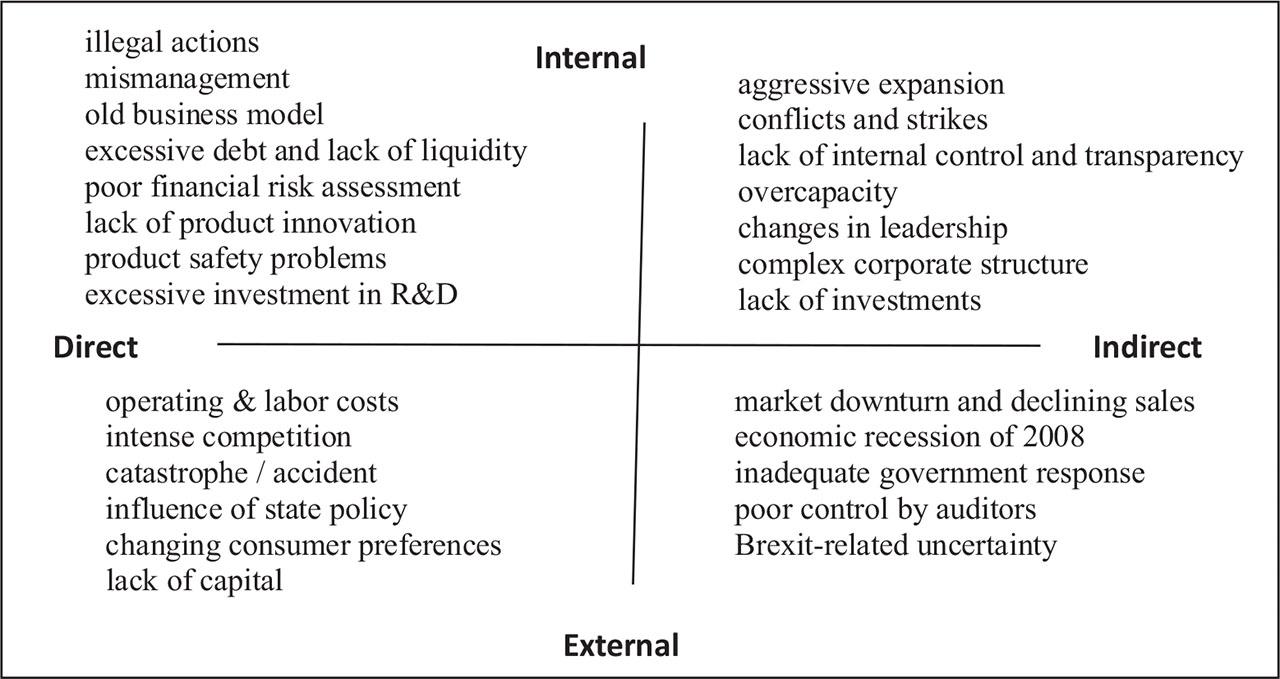
Figure 1.

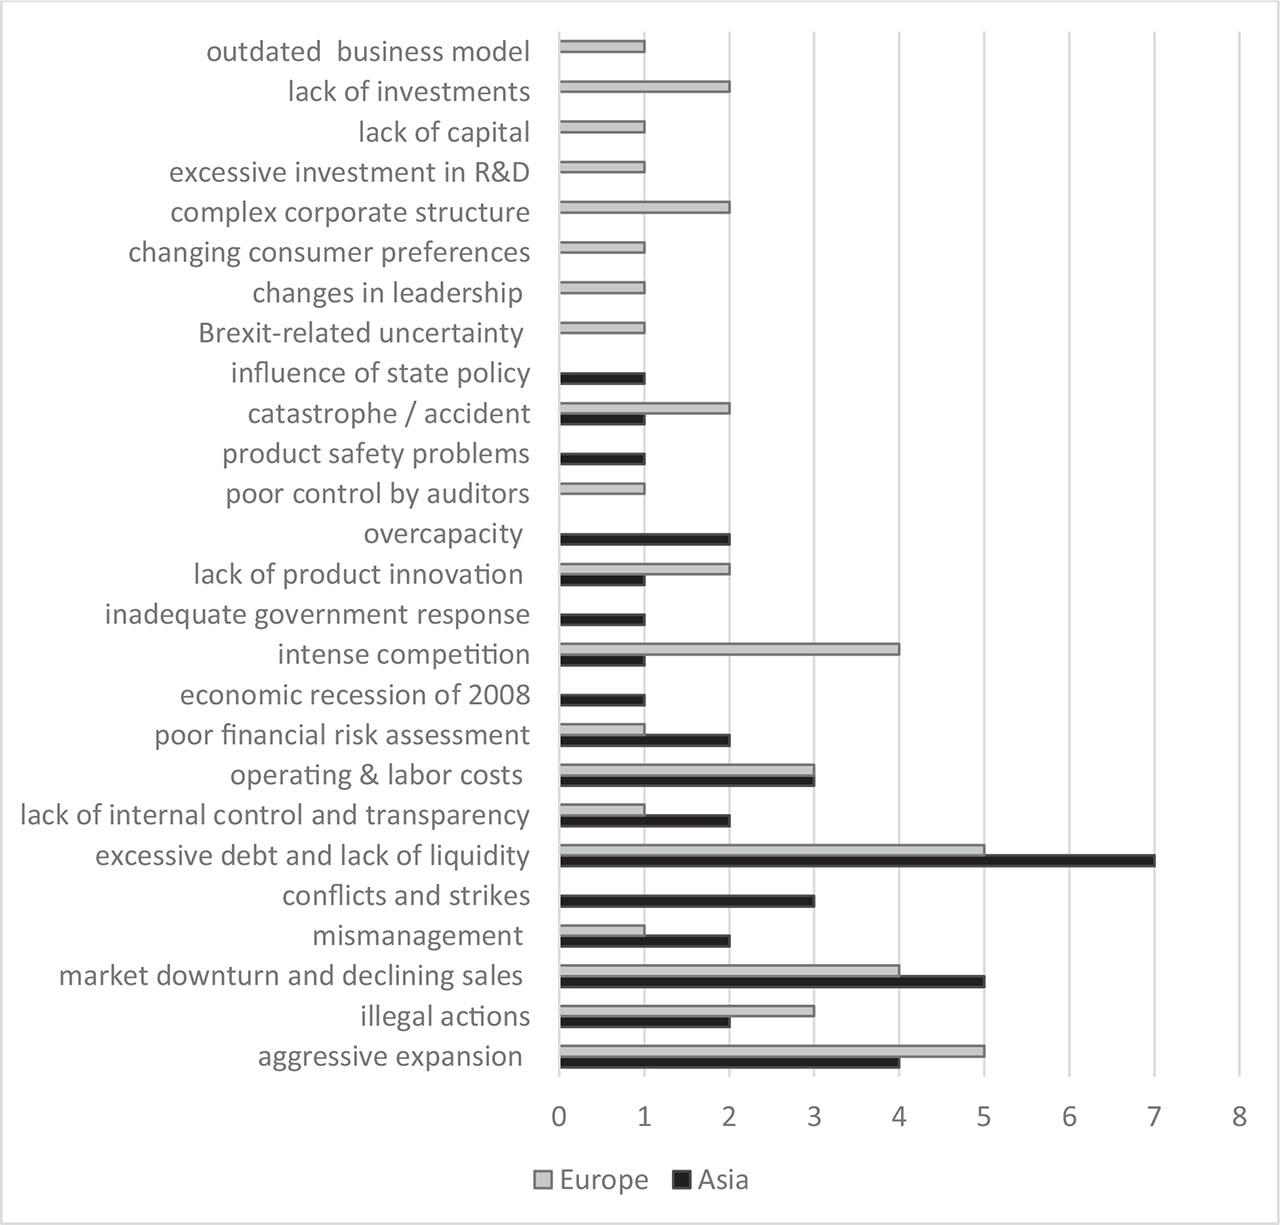
Figure 2.

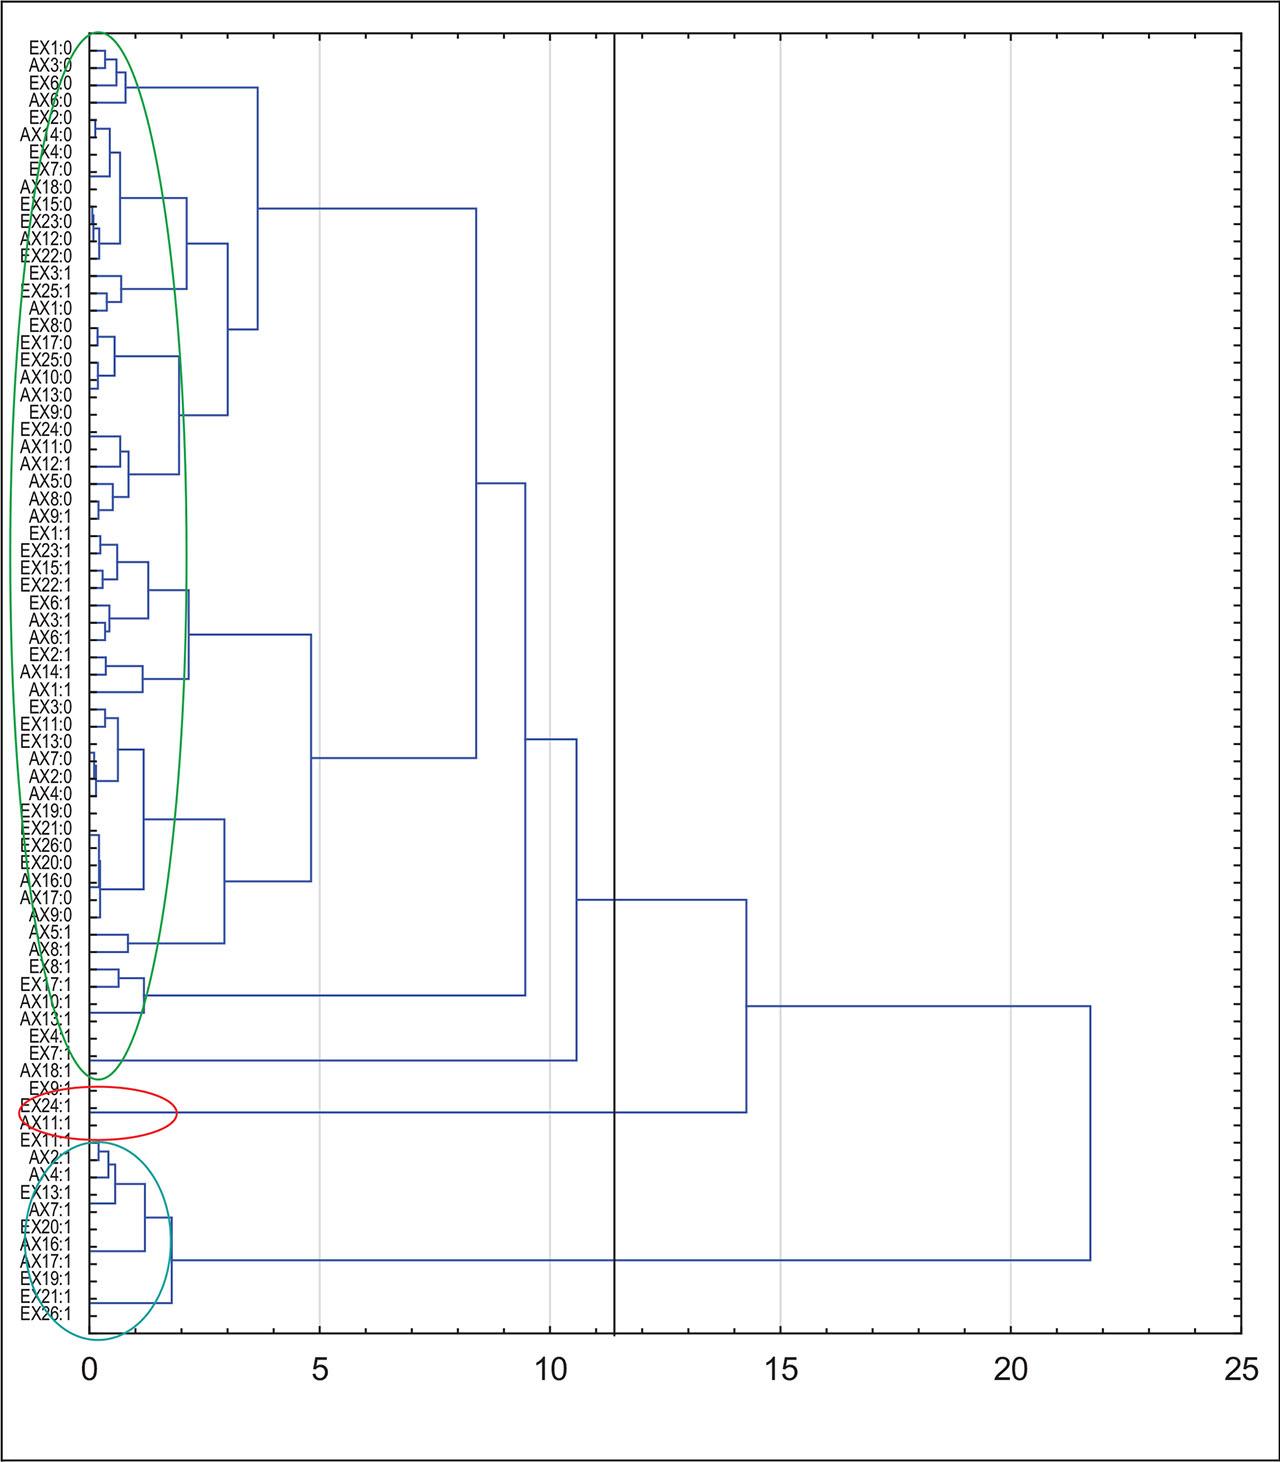
Figure 3.

Description of selected crises of European companies
| Company | Dates and key events |
|---|---|
| Swissair |
|
| Parmalat |
|
| Rover Group |
|
| Siemens AG |
|
| Spanair |
|
| Nokia |
|
| Banco Popular |
|
| Thomas Cook Group |
|
| Wirecard |
|
| Abengoa |
|
Variables Used in the Analysis
| Categorization | Direct causes of crises | |
|---|---|---|
| Europe | Asia | |
| EX1 | AX1 | aggressive expansion |
| EX2 | AX2 | illegal actions |
| EX3 | AX3 | market downturn and declining sales |
| EX4 | AX4 | mismanagement |
| EX5 | AX5 | conflicts and strikes |
| EX6 | AX6 | excessive debt and lack of liquidity |
| EX7 | AX7 | lack of internal control and transparency |
| EX8 | AX8 | operating & labor costs |
| EX9 | AX9 | poor financial risk assessment |
| EX10 | AX10 | economic recession of 2008 |
| EX11 | AX11 | intense competition |
| EX12 | AX12 | inadequate government response |
| EX13 | AX13 | lack of product innovation |
| EX14 | AX14 | overcapacity |
| EX15 | AX15 | poor control by auditors |
| EX16 | AX16 | product safety problems |
| EX17 | AX17 | catastrophe / accident |
| EX18 | AX18 | influence of state policy |
| EX19 | AX19 | Brexit-related uncertainty |
| EX20 | AX20 | changes in leadership |
| EX21 | AX21 | changing consumer preferences |
| EX22 | AX22 | complex corporate structure |
| EX23 | AX23 | excessive investment in R&D |
| EX24 | AX24 | lack of capital |
| EX25 | AX25 | lack of investments |
| EX26 | AX26 | outdated business model |
Singular values and eigenvalues with the degree of explained total inertia in the original and modified versions
| Number of dimensions, K | Singular values, γk | Eigenvalues, λk | λk / λ | τk |
|
|
|
|---|---|---|---|---|---|---|---|
| 1 | 0.5113 | 0.2615 | 26.1475 | 26.1475 | 0.2478 | 27.5831 | 27.5831 |
| 2 | 0.3844 | 0.1478 | 14.7757 | 40.9232 | 0.1349 | 15.0177 | 42.6008 |
| 3 | 0.3716 | 0.1381 | 13.8083 | 54.7316 | 0.1254 | 13.9615 | 56.5623 |
| 4 | 0.3398 | 0.1154 | 11.5444 | 66.2759 | 0.1033 | 11.5015 | 68.0638 |
| 5 | 0.3073 | 0.0944 | 9.4419 | 75.7179 | 0.0830 | 9.2357 | 77.2996 |
| 6 | 0.2944 | 0.0867 | 8.6663 | 84.3841 | 0.0755 | 8.4055 | 85.7051 |
| 7 | 0.2551 | 0.0651 | 6.5082 | 90.8924 | 0.0550 | 6.1175 | 91.8226 |
| 8 | 0.2297 | 0.0527 | 5.2740 | 96.1664 | 0.0434 | 4.8280 | 96.6506 |
| 9 | 0.1958 | 0.0383 | 3.8336 | 100.0000 | 0.0301 | 3.3494 | 100.0000 |
|
|
Description of selected crises of Asian companies
| Company | Dates and key events |
|---|---|
| China Aviation Oil |
|
| PT Bank Century |
|
| SsangYong Motor |
|
| AirAsia Japan |
|
| Hanjin Shipping |
|
| Toyota |
|
| LDK Solar |
|
| Kingfisher Airlines |
|
| Satyam Computer Services |
|
| Jet Airways |
|
Homogeneous typological groups according to the occurrence of direct causes of the crisis
| Variable | Group | Variable | Group | Variable | Group |
|---|---|---|---|---|---|
| EX9:1 | 1 | EX11:1 | 2 | EX1:1 | 3 |
| EX24:1 | 1 | EX13:1 | 2 | EX2:1 | 3 |
| AX11:1 | 1 | EX19:1 | 2 | EX3:1 | 3 |
| EX20:1 | 2 | EX4:1 | 3 | ||
| EX21:1 | 2 | EX6:1 | 3 | ||
| EX26:1 | 2 | EX7:1 | 3 | ||
| AX2:1 | 2 | EX8:1 | 3 | ||
| AX4:1 | 2 | EX15:1 | 3 | ||
| AX7:1 | 2 | EX17:1 | 3 | ||
| AX16:1 | 2 | EX22:1 | 3 | ||
| AX17:1 | 2 | EX23:1 | 3 | ||
| 2 | EX25:1 | 3 | |||
| AX1:1 | 3 | ||||
| AX3:1 | 3 | ||||
| AX5:1 | 3 | ||||
| AX6:1 | 3 | ||||
| AX8:1 | 3 | ||||
| AX9:1 | 3 | ||||
| AX10:1 | 3 | ||||
| AX12:1 | 3 | ||||
| AX13:1 | 3 | ||||
| AX14:1 | 3 | ||||
| AX18:1 | 3 |