
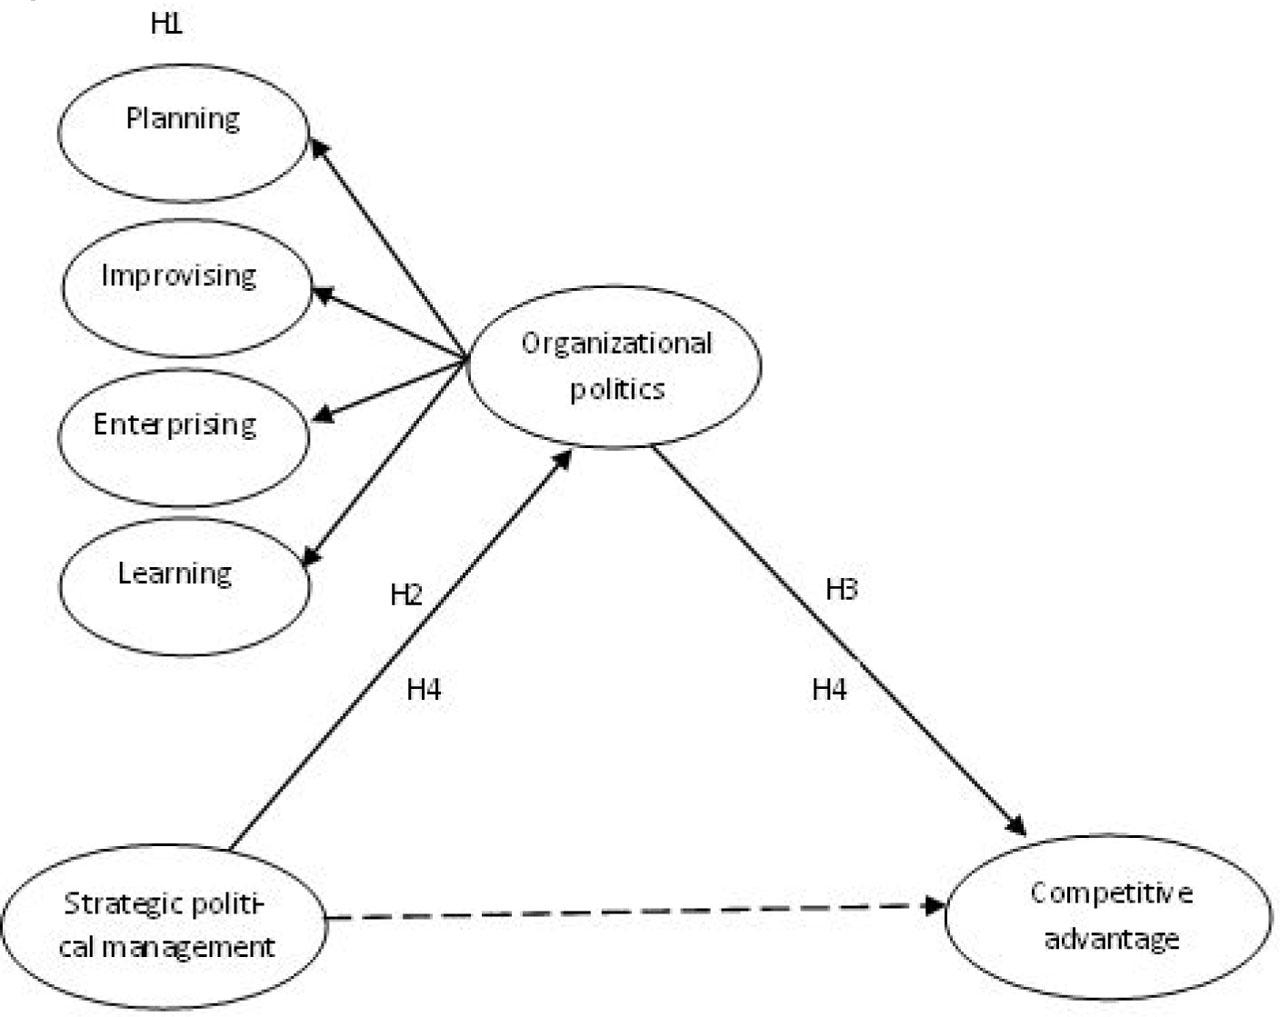
Figure 1
Types and characteristics of political strategies
| Type of political strategy | Characteristics of political strategy |
|---|---|
| Reactive strategy | Strategic measures are taken to effectively adapt the company's internal processes to political requirements, e.g., effective data processing systems for determining compliance with legal regulations, timely provision of information on compliance with supervisory authorities, and improved structures and processes that directly reduce compliance costs. |
| Anticipation strategy | Strategic measures are undertaken to achieve a competitive advantage that gives priority rent by anticipating future public policy (e.g., merging and reconfiguring internal and external resources to increase the frequency and scope of monitoring the political environment and the timely acquisition of knowledge about the inevitable or potential changes in law or public policy). |
| Defensive strategy | Strategic measures are taken to prevent undesirable political amendments and maintain the status quo (e.g., efforts to maintain current regulations and current policies, in the absence of sufficient flexibility, to take advantage of the change or loss of strategic value of resources and capabilities held; improving relations with authorities and/or intermediate networks with those who influence decision-makers to protect the interests of the company). |
| Proactive strategy | Strategic measures are endeavored to influence public norms and policies (e.g., creating practices that others will follow; active involvement in industry associations and media activities; building a coalition of supporters). |
U Mann Whitney dependency test scores between particular dimensions of the political management strategy and the dimensions of OP
| Reactive strategy (n = 114) as independent value; Number of observations when the reactive strategy was not present n = 241 | ||||
|---|---|---|---|---|
| Average rank when the reactive strategy was not present | Average rank when the reactive strategy was present | U Mann Whitney statistics value | p | |
| Dominant coalition | 175.5 | 183.2 | −0.65 | 0.513 |
| Exerting the influence | 172.6 | 189.5 | −1.45 | 0.146 |
| Making organizational changes | 175.1 | 184.2 | −0.78 | 0.433 |
| Openness to information | 178.3 | 177.4 | 0.08 | 0.936 |
Factors for organizational politics
| Factor 1 | Factor 2 | Factor 3 | Factor 4 | |
|---|---|---|---|---|
| Factor loadings a) | ||||
| Employees build ties with influential groups inside and outside the company to influence strategic plans and directions of activities. | 0.718 | 0.215 | 0.128 | 0.285 |
| Employees make alliances and form coalitions or a collective front of a group of people, resulting in a highly influential part of the enterprise that no one will ever be able to oppose. | 0.739 | 0.021 | 0.230 | 0.292 |
| Employees seek rational justifications: they refer to facts, figures, figures, and the resulting logical arguments to increase the strength of their request or to justify a given point of view. | 0.200 | 0.664 | 0.273 | 0.014 |
| Employees try to gain control of important resources to strengthen their position. | 0.684 | 0.155 | 0.367 | −0.092 |
| Employees perceive conflict as a characteristic feature of the situation and assume that the conflict can be resolved through the involvement of interested persons (e.g., through negotiation). | 0.121 | 0.636 | 0.321 | −0.217 |
| Employees subtly maneuver, trying to hide their true intentions. | 0.711 | 0.217 | 0.097 | −0.223 |
| Employees perceive power relations as natural. | 0.168 | 0.778 | −0.109 | 0.096 |
| Employees use co-optation that relies on connecting with influential people or groups of people or including them in their sphere of influence to increase control over the opponent or to silence the opponent. | 0.696 | 0.205 | 0.238 | −0.151 |
| Managers set a deadline for acceptance or action to ensure a sense of necessity to take action. | 0.292 | 0.601 | 0.076 | 0.267 |
| Employees express their opinions honestly, even when they are critical of the dominant ideas. | −0.041 | 0.204 | 0.243 | 0.785 |
| Employees do favors each other for their mutual benefit. | −0.016 | 0.676 | 0.300 | 0.229 |
| Employees use key managers to support initiatives taken, and mobilize support for or opposition to organizational strategies, policies, and practices. | 0.352 | 0.274 | 0.660 | −0.087 |
| Employees strive to obtain their autonomy of actions allowing for experimentation and stimulation of bottom-up change. | 0.272 | 0.180 | 0.748 | 0.094 |
| Employees refer to the entity's goals, common values, and ideals to induce specific behaviors of other people. | 0.122 | 0.342 | 0.542 | 0.189 |
| Employees strive to determine what meaning should be attributed to new events. | 0.117 | 0.073 | 0.698 | 0.269 |
| Employees contest the current understanding of the organizational reality to move beyond the status quo. | 0.463 | −0.013 | 0.571 | 0.008 |
| Explained value | 3.130 | 2.700 | 2.717 | 1.168 |
| Contribution | 0.196 | 0.169 | 0.170 | 0.073 |
Correlation analysis scores between particular dimensions of OP and the competitive advantage (n = 355)
| Correlation coefficient | Dominant coalition | Exerting the influence | Making organizational changes | Openness to information |
|---|---|---|---|---|
| r Pearson | 0.08 | 0.07 | 0.23*** | 0.15** |
| tau Kendall | 0.10** | 0.09** | 0.18*** | 0.12*** |
Sobel and Aroian test scores for mediating effect of OP on political management strategy and competitive advantage
| organizational politics | ||||||||
|---|---|---|---|---|---|---|---|---|
| Dominant coalition | Exerting the influence | Making organizational changes | Openness to information | |||||
| Sobel statistics | Aroian statistics | Sobel statistics | Aroian statistics | Sobel statistics | Aroian statistics | Sobel statistics | Aroian statistics | |
| Political management strategy (defensive strategy) | 0.721 | 0.600 | −0.051 | −0.049 | 1.249 | 1.193 | 0.613 | 0.548 |
U Mann Whitney dependency test scores between particular dimensions of the political management strategy and competitive advantage
| Average rank | Average rank | U Mann | p | n No | n Yes | |
|---|---|---|---|---|---|---|
| Reactive strategy as an independent variable | 172.6 | 189.4 | −1.45 | 0.148 | 241 | 114 |
| Anticipation strategy as an independent variable | 173.8 | 186.9 | −1.13 | 0.258 | 241 | 114 |
| Defensive strategy as an independent variable | 185.7 | 151.9 | 2.61 | 0.009 | 274 | 81 |
| Proactive strategy as an independent variable | 178.7 | 173.5 | 0.32 | 0.748 | 309 | 46 |