

Figure 1.
YOLO algorithm implementation flow
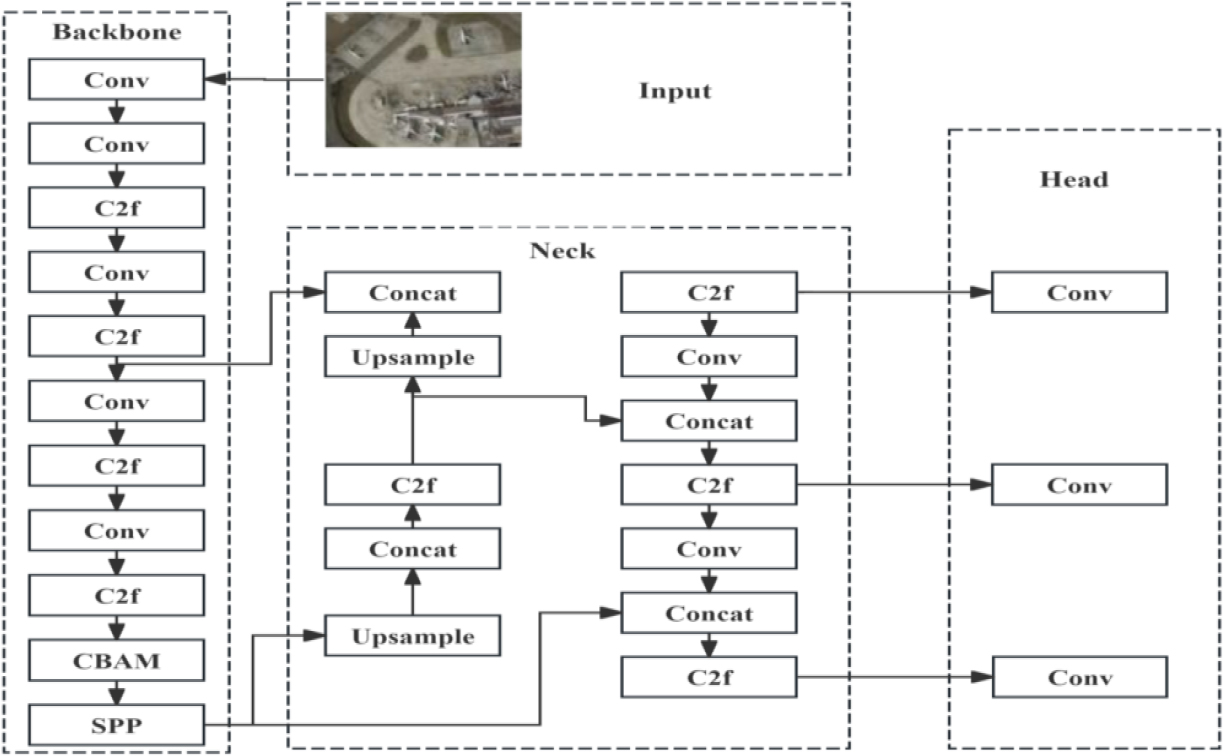
Figure 2.
Improved YOLOv8 network structure diagram
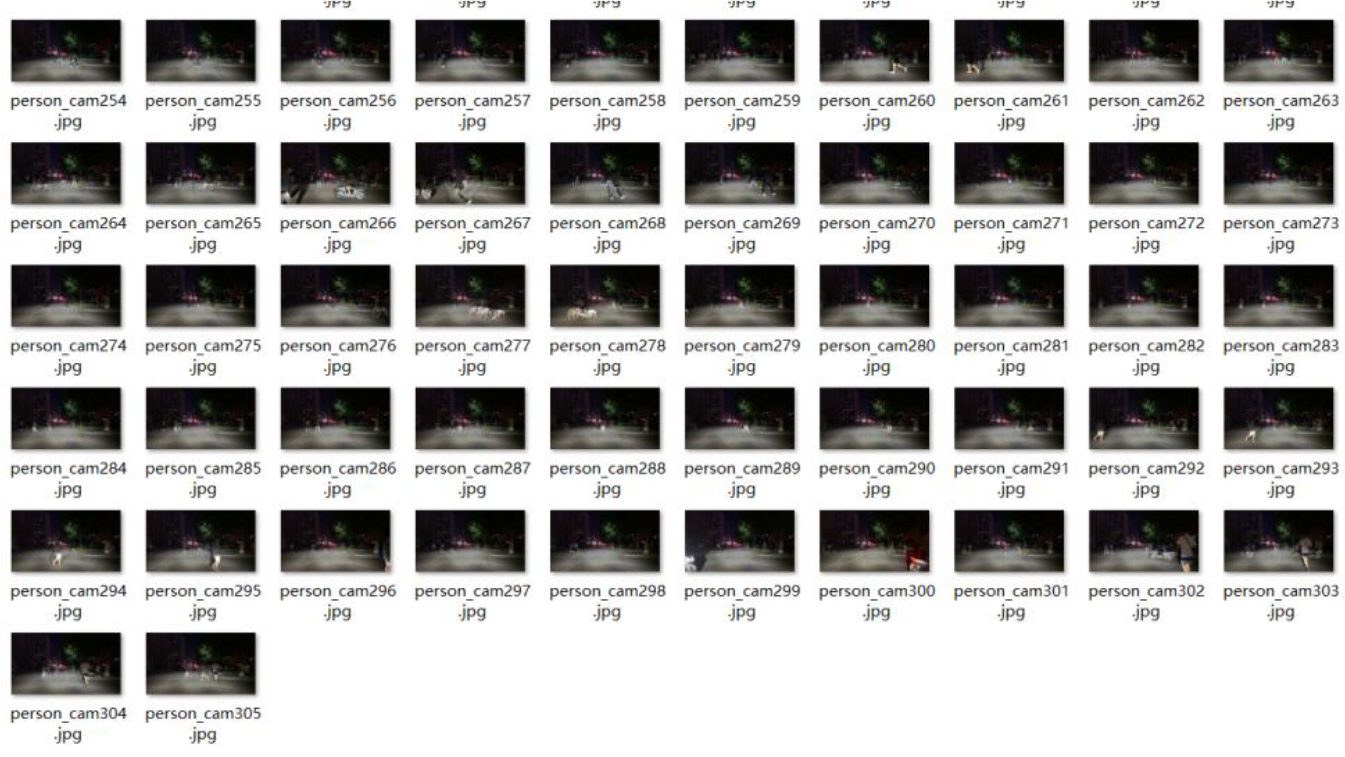
Figure 3.
Partial data display of self-built night vision pedestrian data set
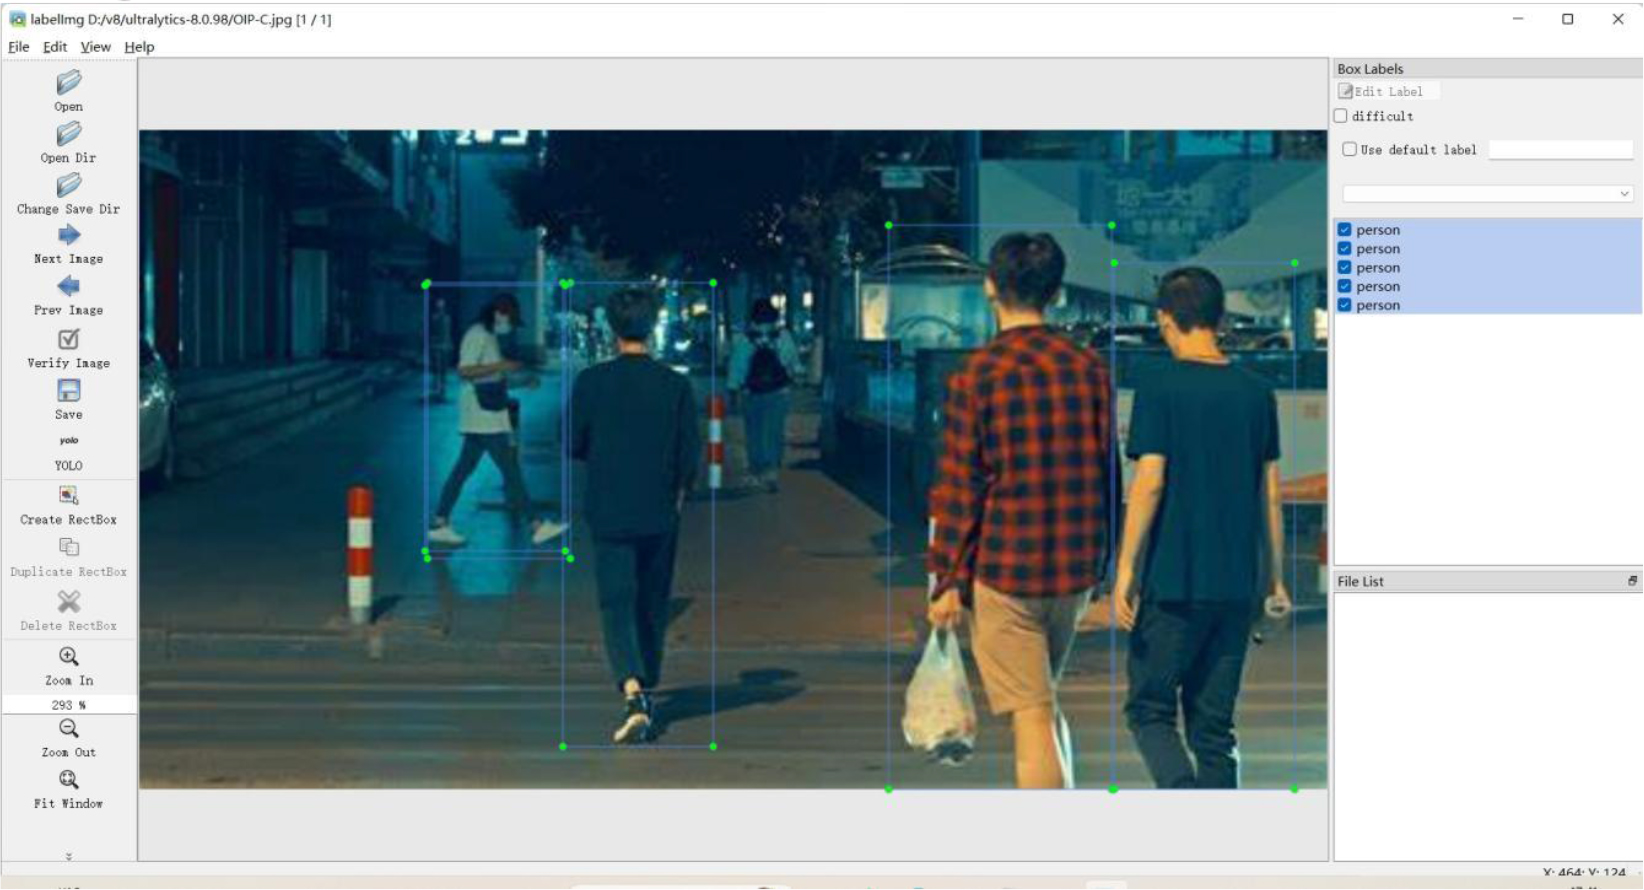
Figure 4.
LabelImg User Interface
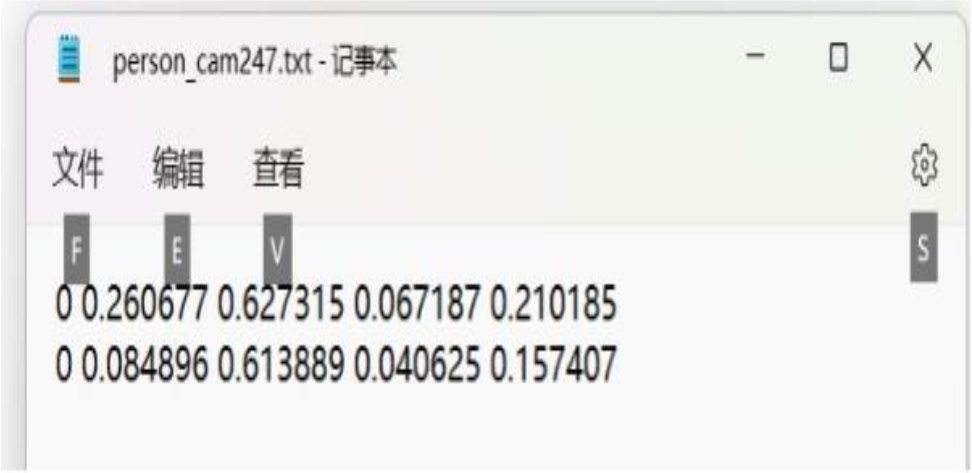
Figure 5.
Content of the YOLO-formatted annotation txt file
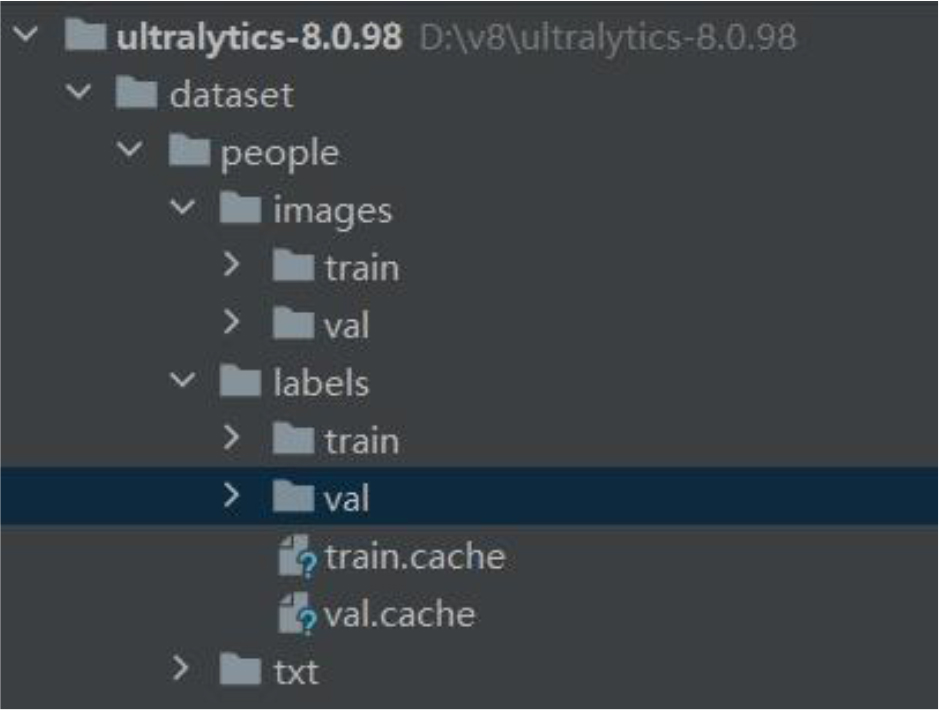
Figure 6.
TXT Format Structure of YOLOv8
TABLE I.
EXPERIMENTAL PLATFORM HARDWARE CONFIGURATION
| Name | Related Configuration |
|---|---|
| Operating System | Windows11 |
| Processor | 11th Gen Intel(R) Core(TM) i7-11800H @ 2.30GHz 2.30 GHz |
| Memory | 16G |
| GPU | NVIDIA GeForce RTX 3050 |
| Deep Learning | Pytorch |
| Framework |
TABLE II.
EXPERIMENTAL PARAMETER SETTINGS
| Parameter | Parameter Setting |
|---|---|
| Number of training iterations | 50 |
| Learning rate | 0.001 |
| Batch size | 16 |
| Image size | 640 |
| Optimizer | Lion |
TABLE III.
COMPARISON OF ORIGINAL AND IMPROVED ALGORITHMS
| Algorithm | Precision | Recall | mAP@0.5:0.95 | mAP@0.5 | F1 Score |
|---|---|---|---|---|---|
| YOLOv8 | 85.3 | 89.3 | 88.9 | 57.8 | 87.2 |
| YOLOv8+CBAM | 87.3 | 84.4 | 88.94 | 58.2 | 87.84 |
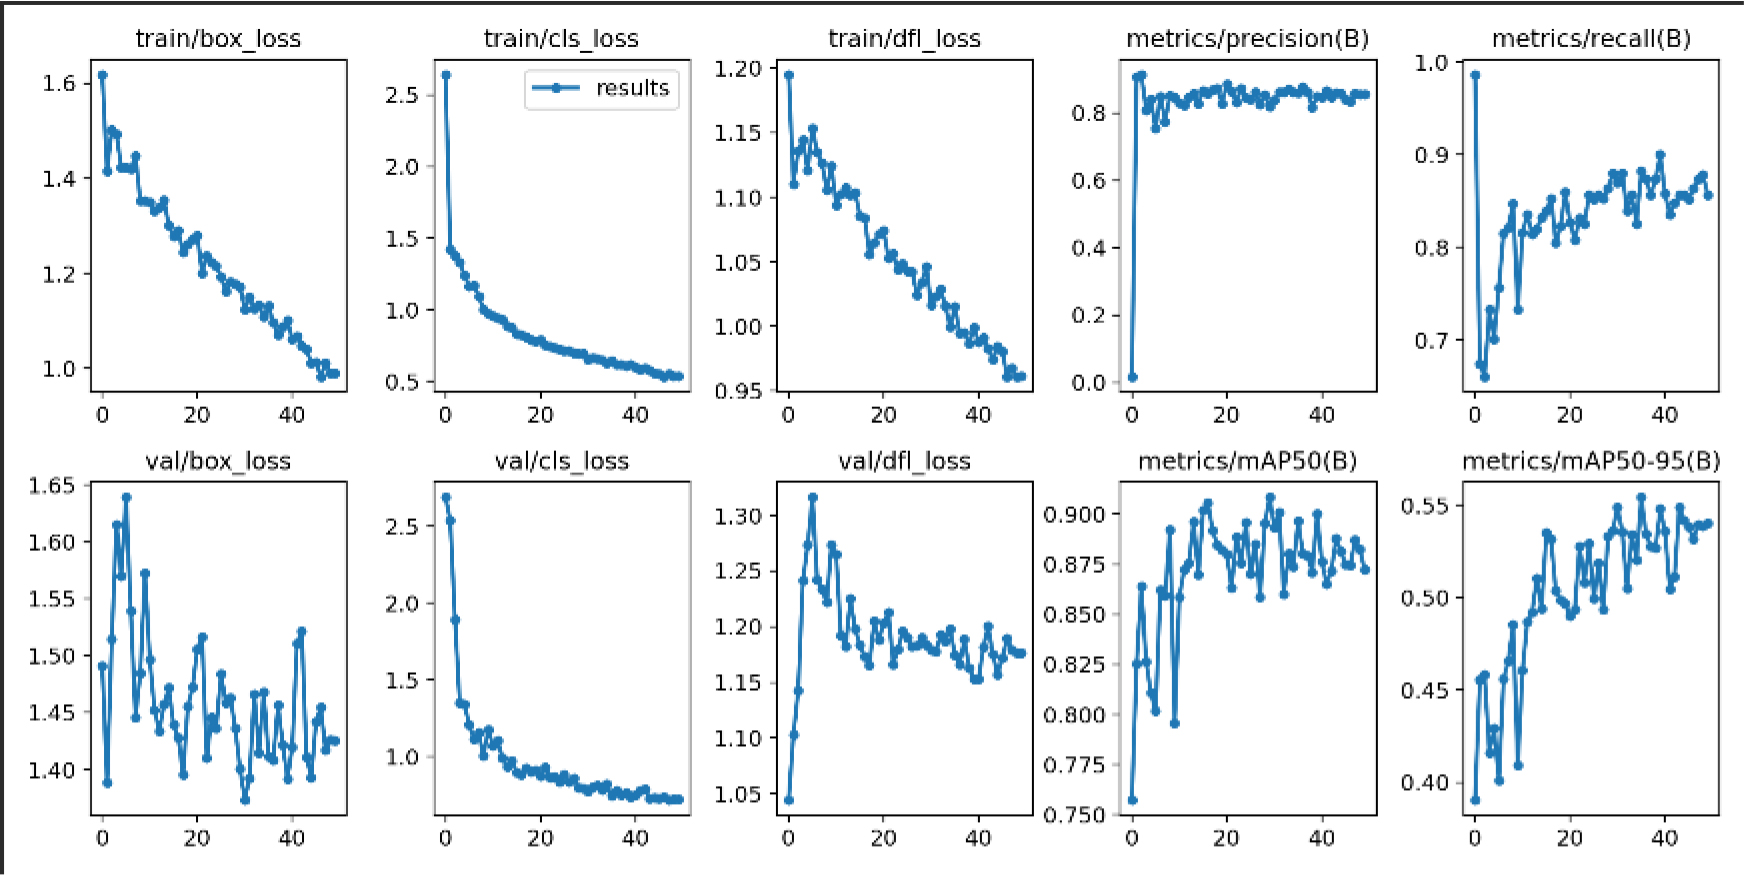
Figure 7.
Training results prior to model optimization
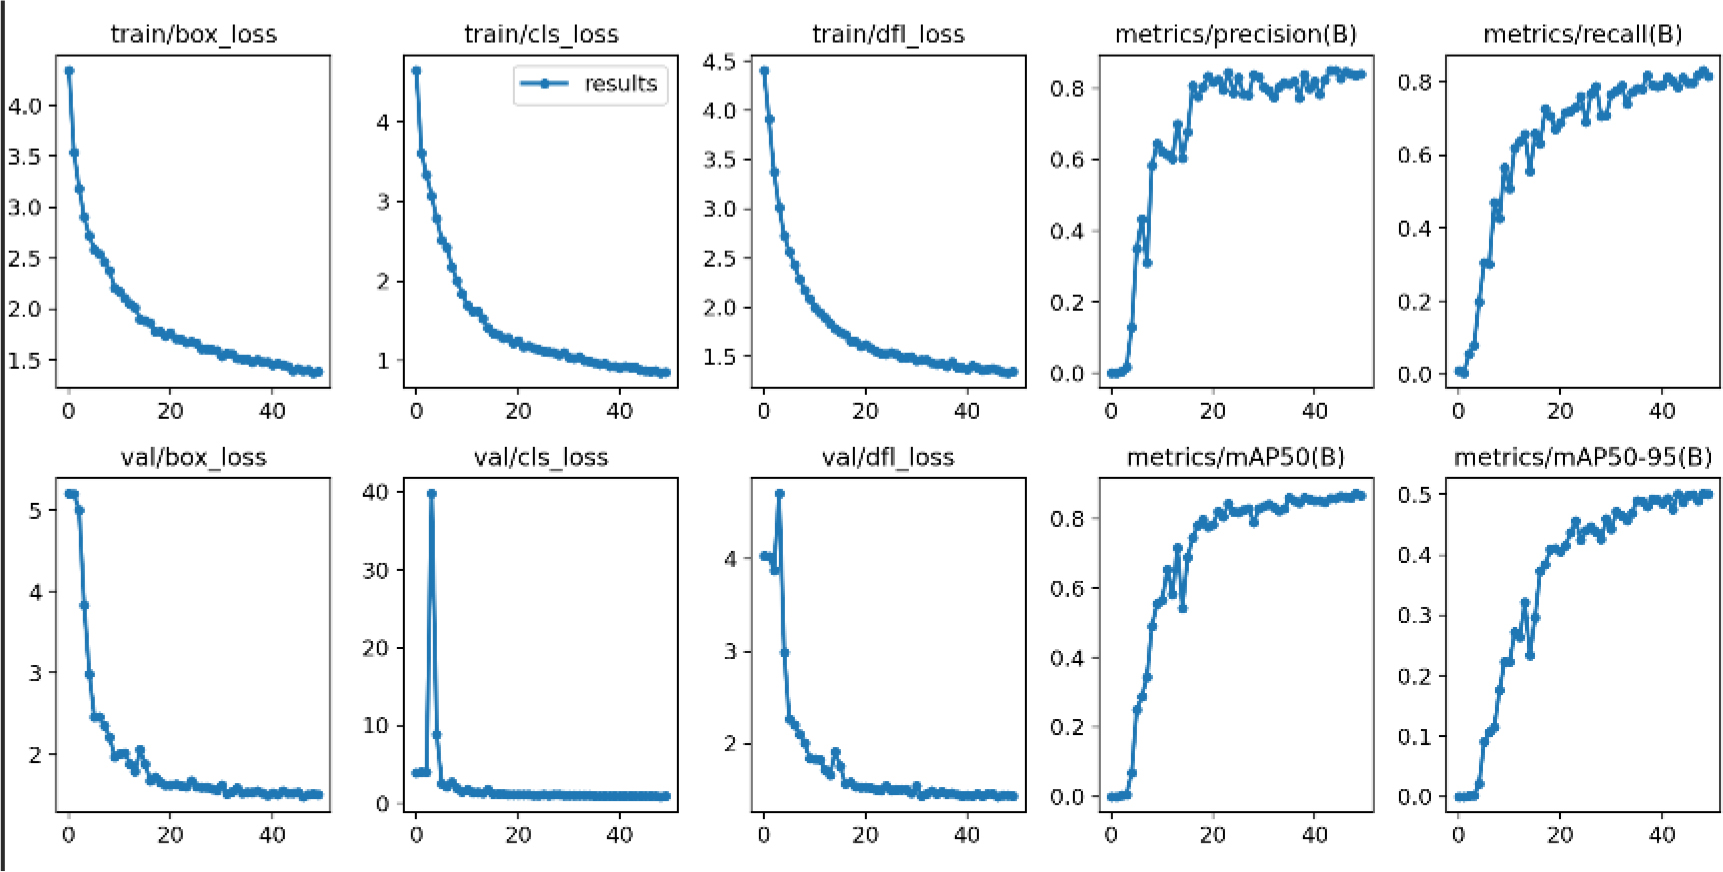
Figure 8.
Training results after model optimization
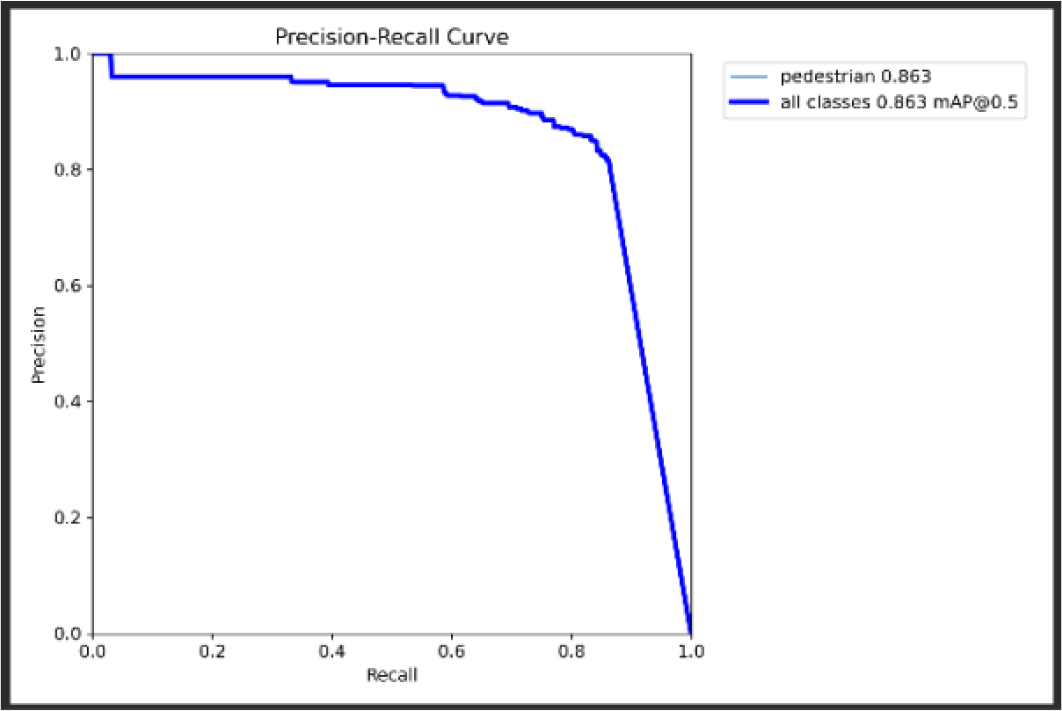
Figure 9.
PR curve before algorithm improvement
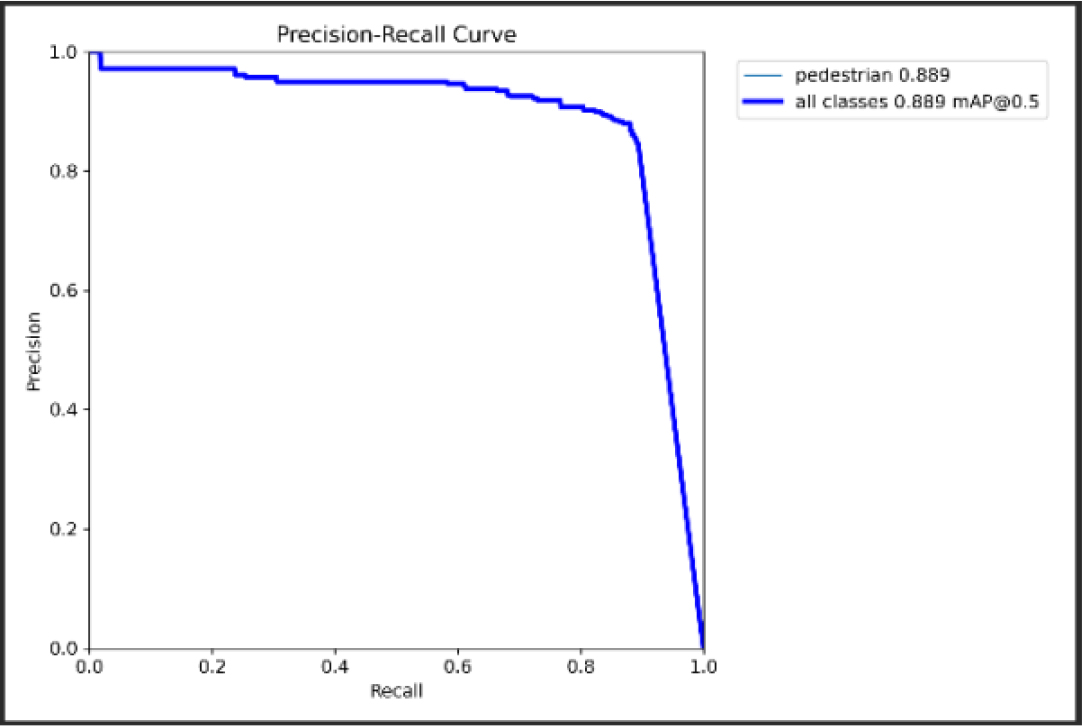
Figure 10.
PR curve after algorithm improvement
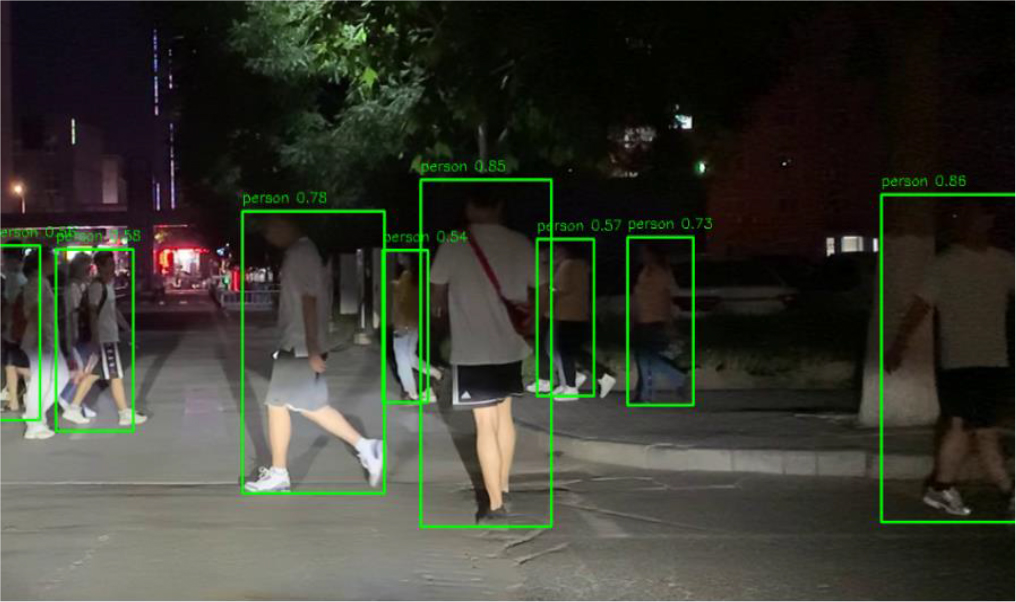
Figure 11.
Image Detection Interface
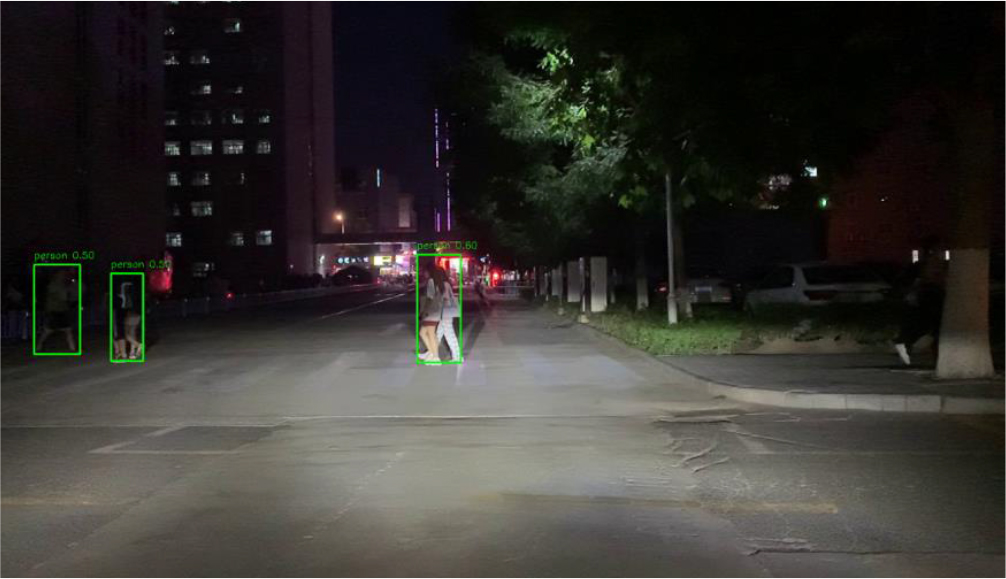
Figure 12.
Image Detection Interface
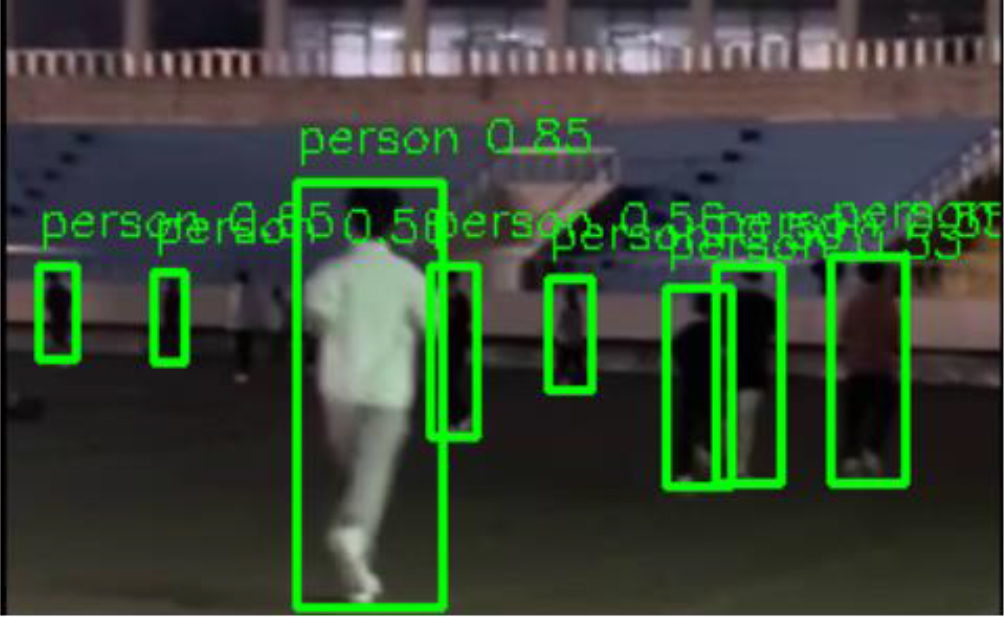
Figure 13.
Video Detection Interface