
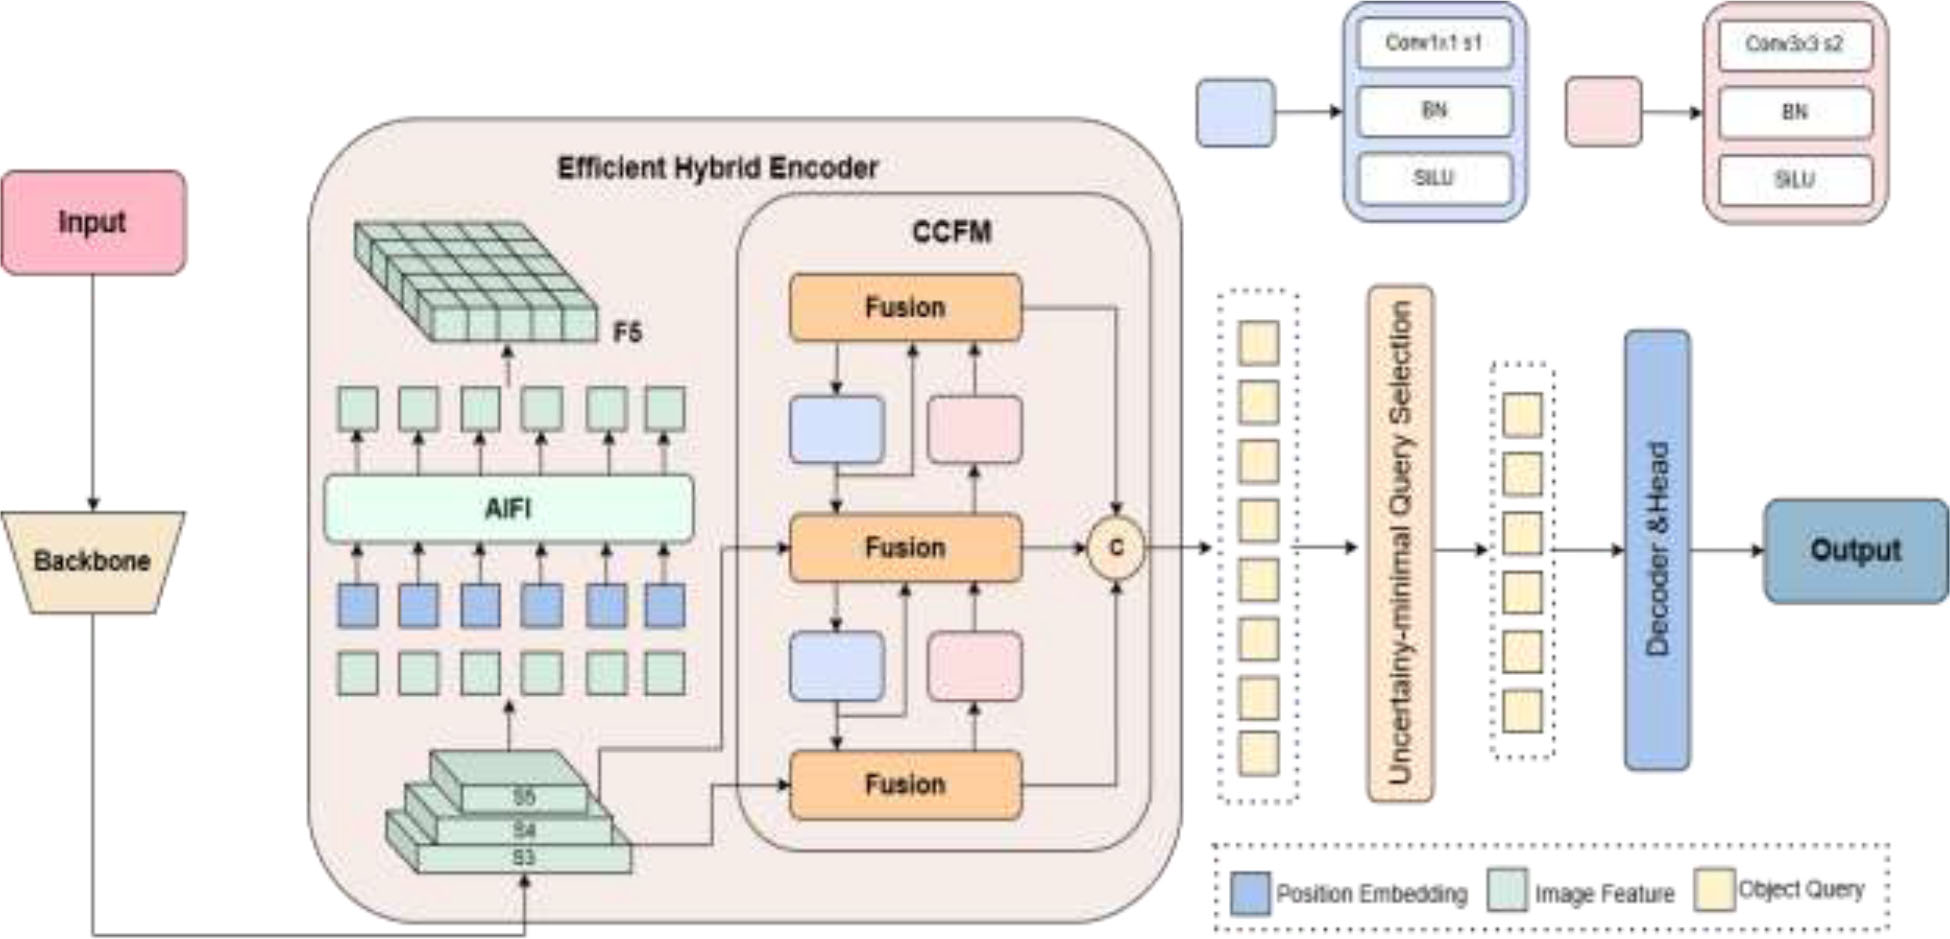
Figure 1.
Network architecture of RT-DETR
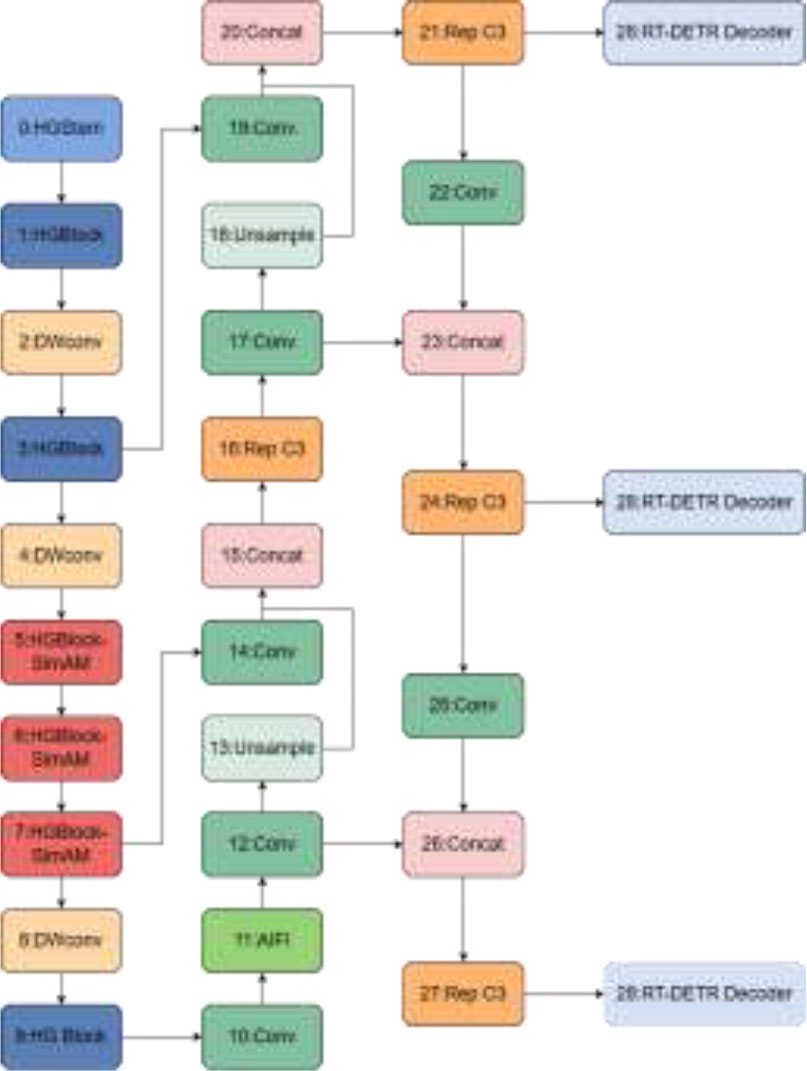
Figure 2.
Network architecture of improved RT-DETR
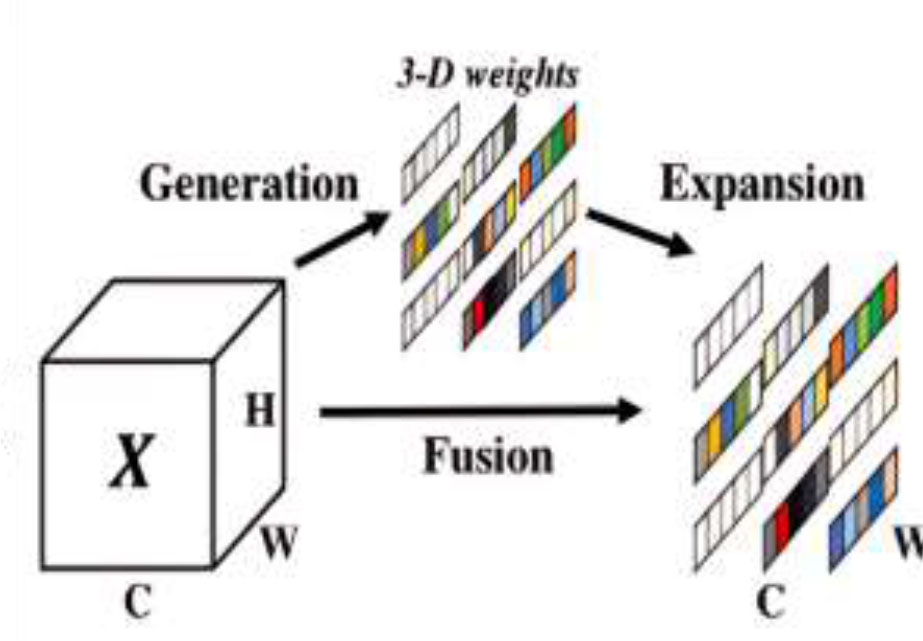
Figure 3.
Full 3-D weights for attention
TABLE I.
EXPERIMENTAL PLATFORM
| Hyper-parameters | Value |
|---|---|
| Inputs | 640×640 |
| Epochs | 100 |
| Batchsize | 16 |
| Lr0 | 0.001 |
| Lrf | 0.0001 |
| Momentum | 0.9 |
| Warmup-decay | 0.0005 |
| Warmup-epochs | 5 |
TABLE II.
DATASER SAMPLING SITUATION
| Content | Detailed information |
|---|---|
| Dataset size | 69534 valid training samples |
| Sample method | Randomly select samples |
| Sample quantity | Sampling 3000 samples |
| Tag filtering | Filter other category tags |
| Division ratio | 8:2 |
| Training | 2400 training images |
| Verify | 600 verification images |
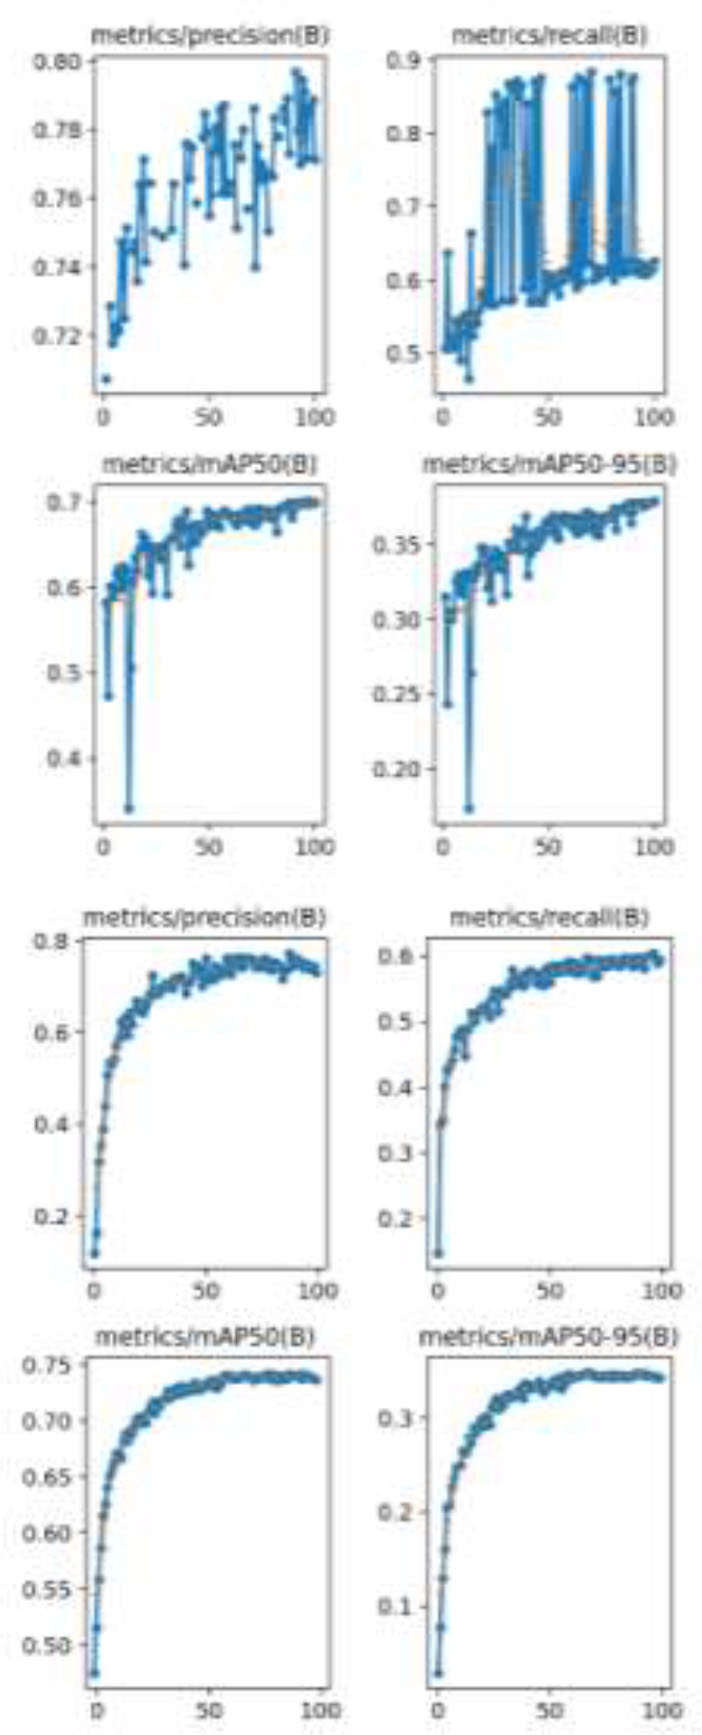
Figure 4.
Comparison before and after improvement
TABLE III.
EXPERIMENTAL RESULTS
| RT-DETR | Without SimAM | Added SimAM |
|---|---|---|
| Precision | 0.779 | 0.793 |
| Recall | 0.621 | 0.624 |
| mAP@50 | 0.699 | 0.736 |
| mAP@50:59 | 0.379 | 0.383 |
TABLE IV.
CAMPARISON RESULTS
| Model | YOLOv8 | Ours |
|---|---|---|
| Precision | 0.721 | 0.793 |
| Recall | 0.645 | 0.624 |
| mAP@50 | 0.692 | 0.736 |
| mAP@50:59 | 0.372 | 0.383 |
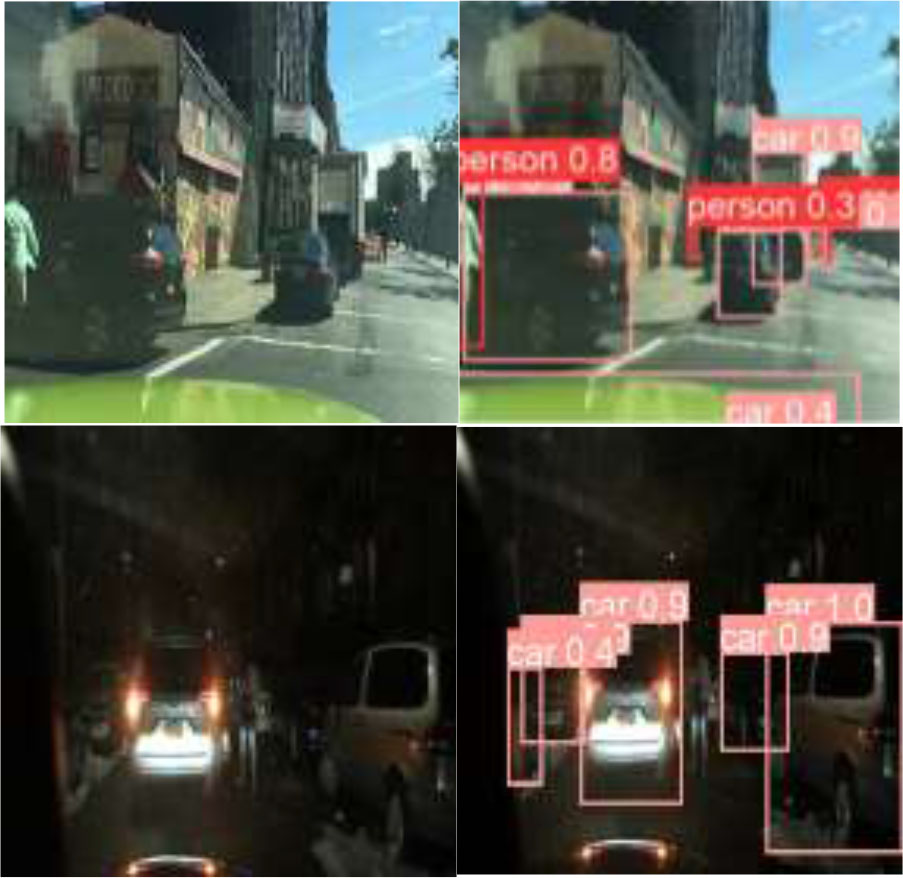
Figure 5.
Visualization results