
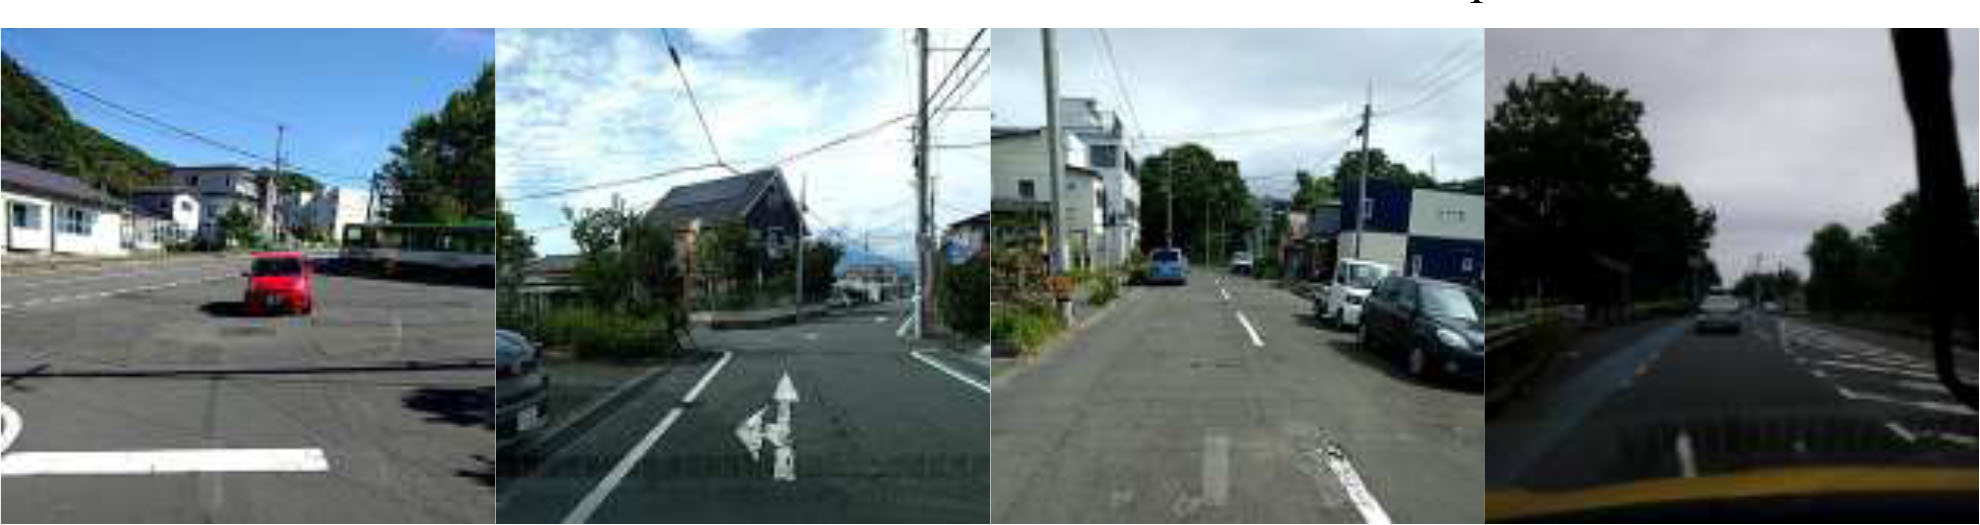
Figure 1.
Road surface damage dataset under different conditions
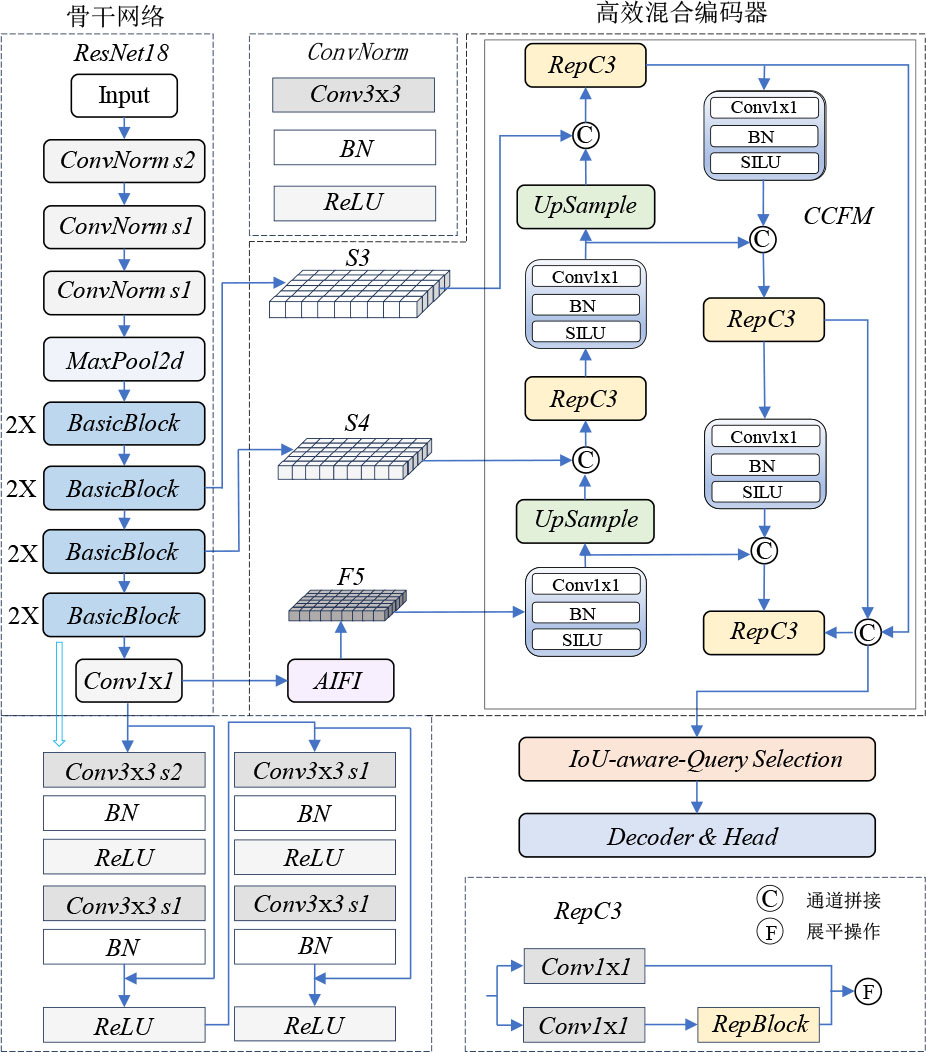
Figure 2.
RT-DETR-r18 model structure
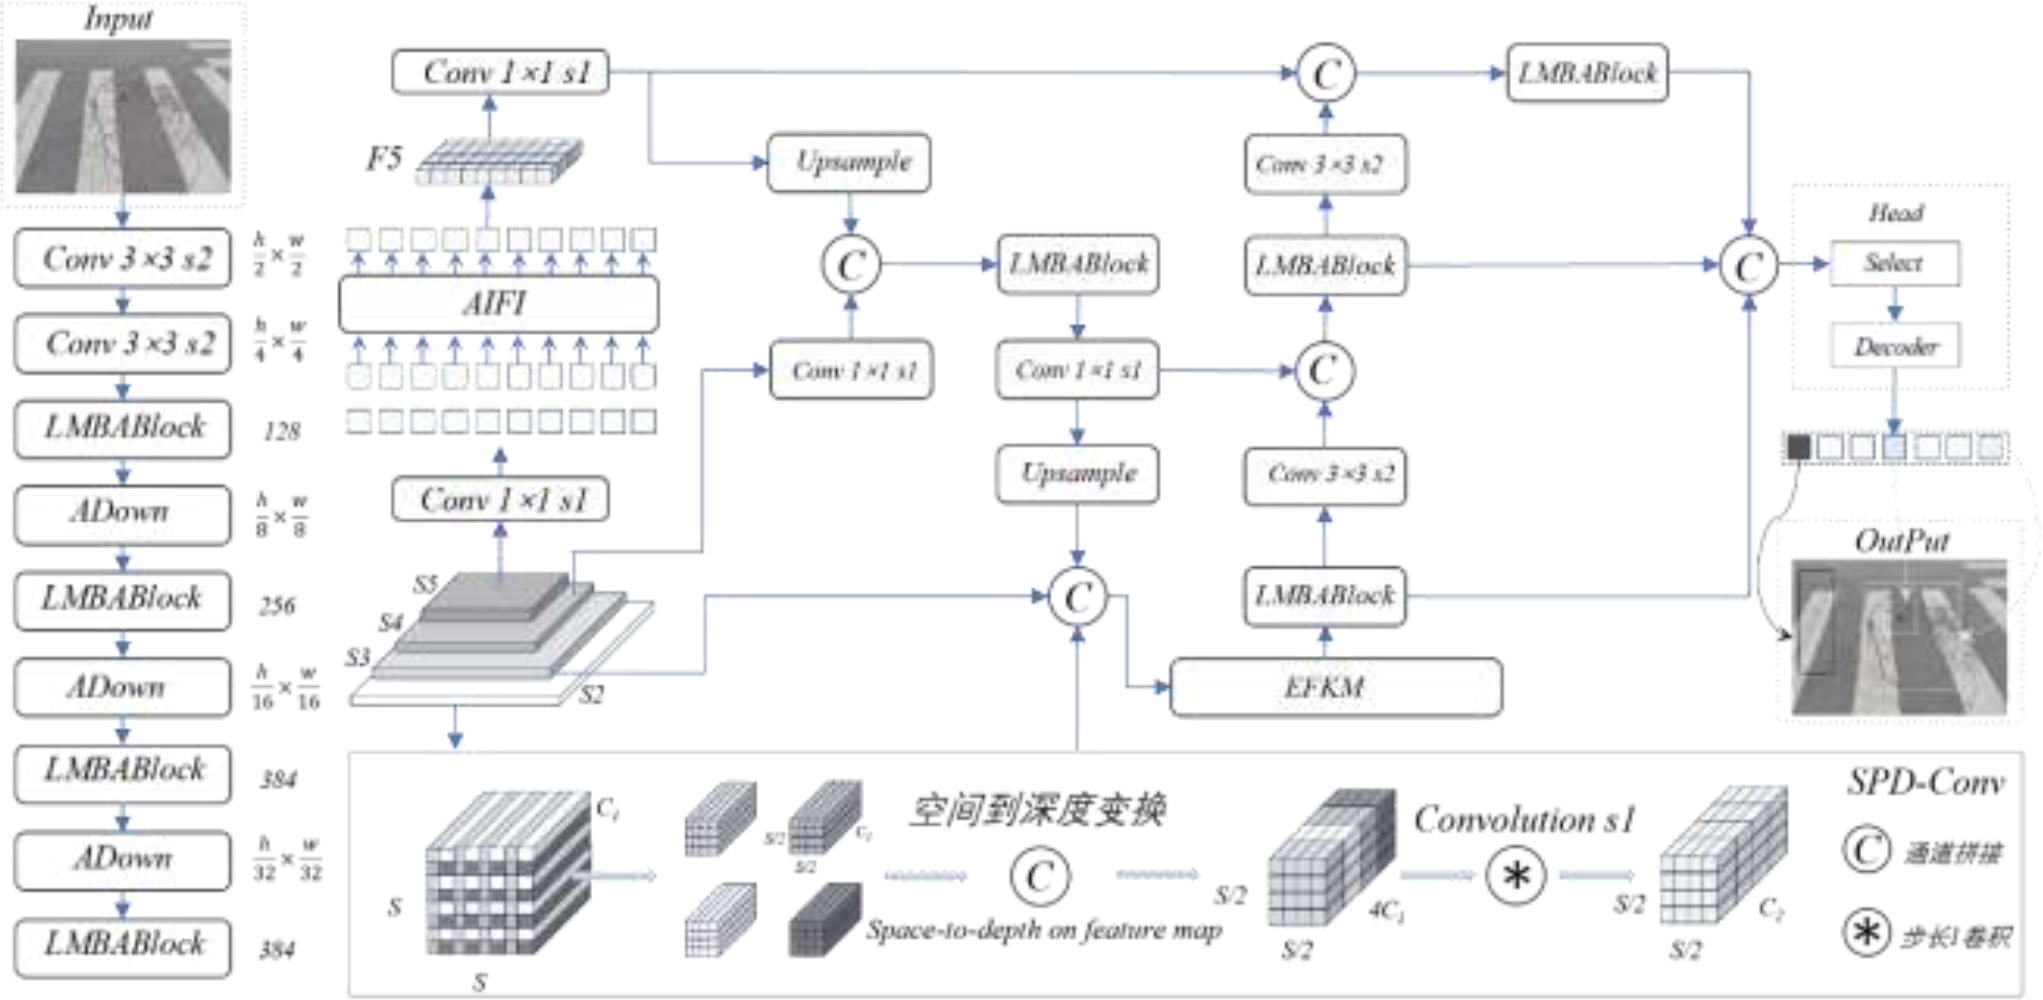
Figure 3.
Improved RT-DETR model structure
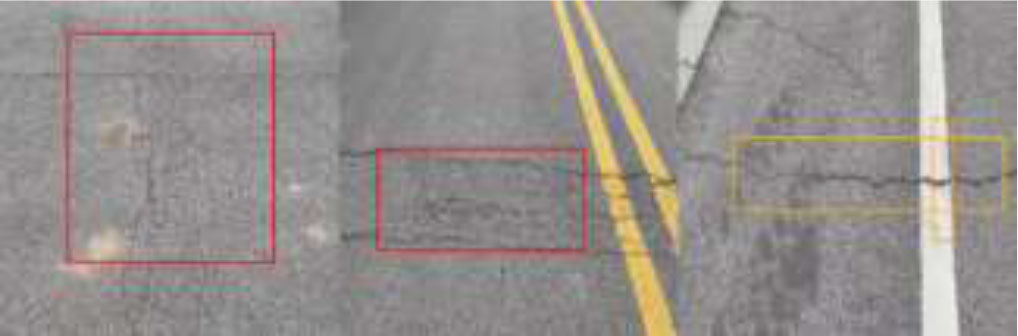
Figure 4.
Diagrams of different types of cracks
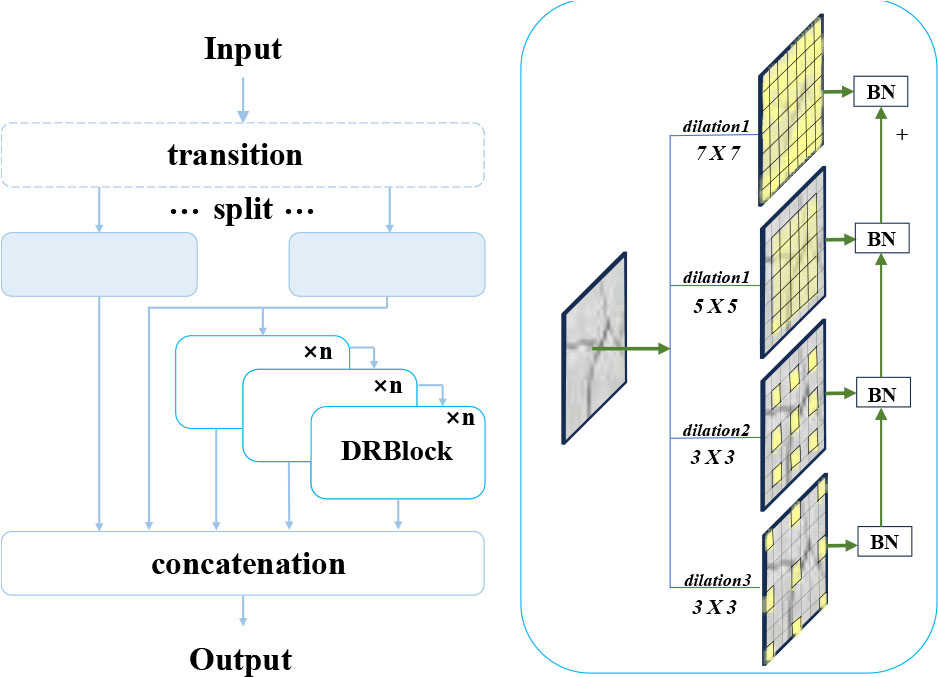
Figure 5.
Structure of LMBA module
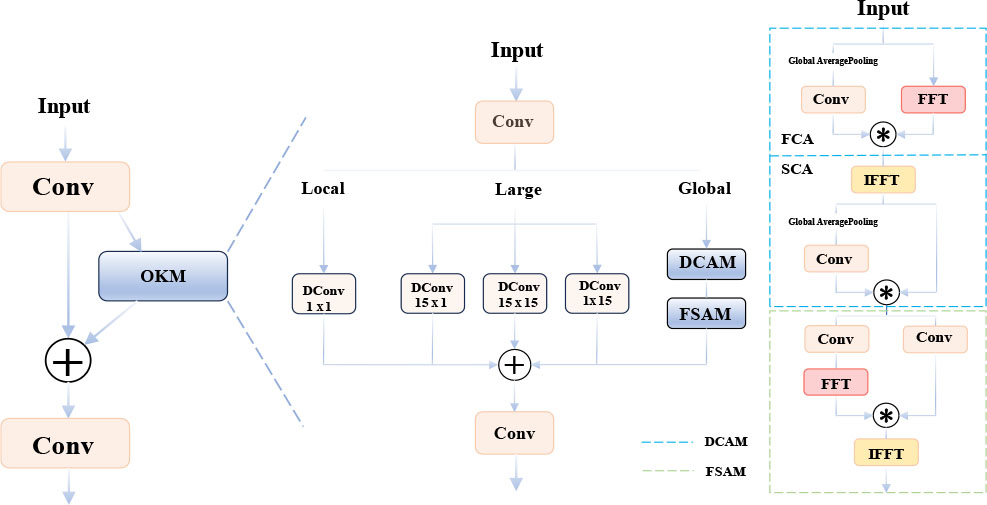
Figure 7.
Structure of EFKM module
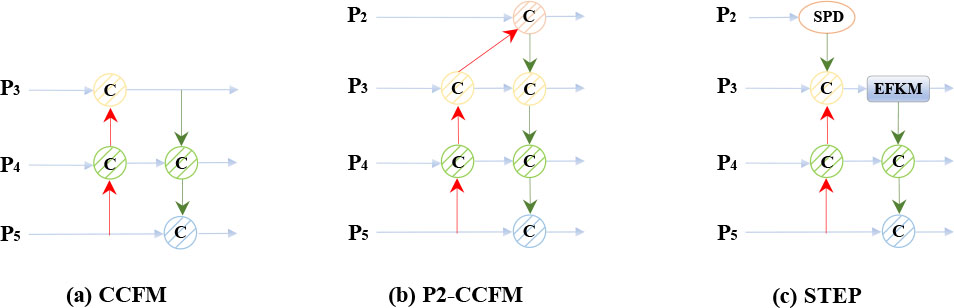
Figure 6.
Comparison of feature Pyramid net
TABLE I.
EXPERIMENTAL ENVIRONMENT
| Experimental environment | Version |
|---|---|
| CPU | Intel Xeon Platinum 8352V |
| GPU | NVIDIA GeForce RTX4090D |
| Language | Python3.9 |
| Deep Learning Framework | Pytorch1.13.1 |
| CUDA | 11.6.0 |
TABLE II.
DISEASE CATEGORY
| Category | Train Set | Test Set |
|---|---|---|
| D00(Longitudinal cracks) | 7419 | 876 |
| D10(Transverse cracks) | 5702 | 636 |
| D20(Alligator cracks) | 6244 | 689 |
| D40(Potholes) | 2316 | 248 |
TABLE III.
COMPARISON BEFORE AND AFTER IMPROVEMENT
| Algorithm | Pars/M | FLOPS/G | FPS/f/s | mAP/% |
|---|---|---|---|---|
| RT-DETR | 19.8 | 57.3 | 69 | 67.1 |
| Improved RT-DETR | 14.6 | 45.2 | 60 | 69.2 |
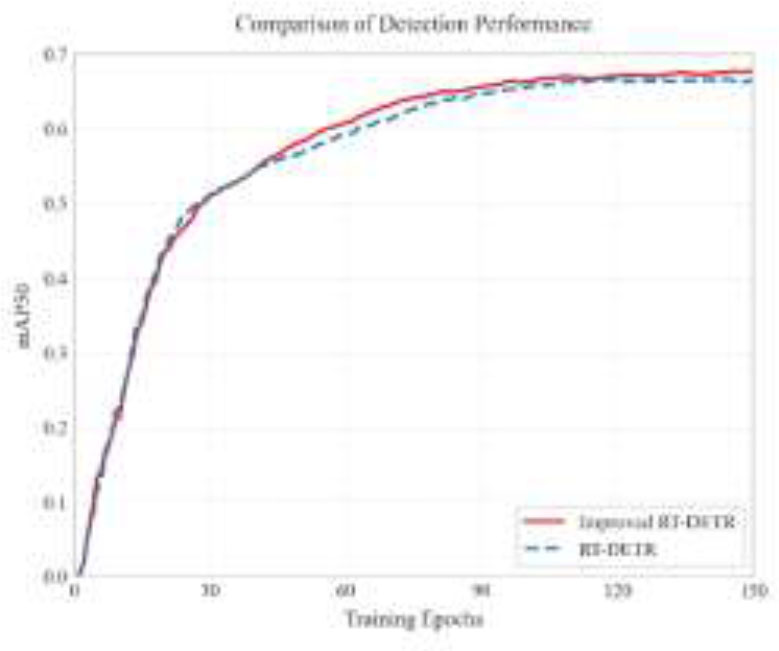
Figure 8.
Comparison chart of mAP during training
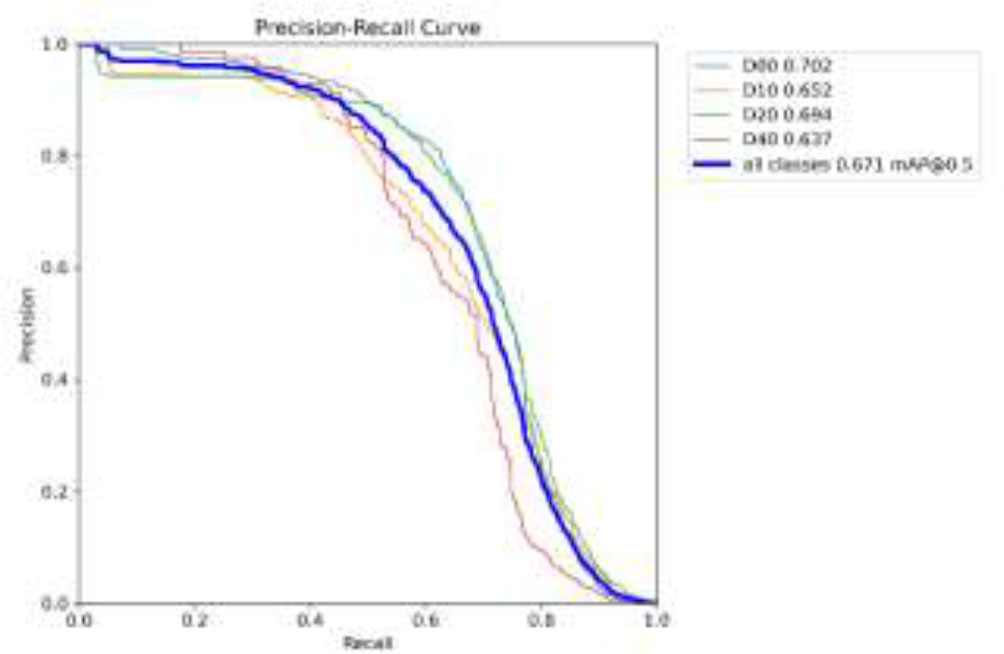
Figure 9.
Average precision of each label in RT-DETR
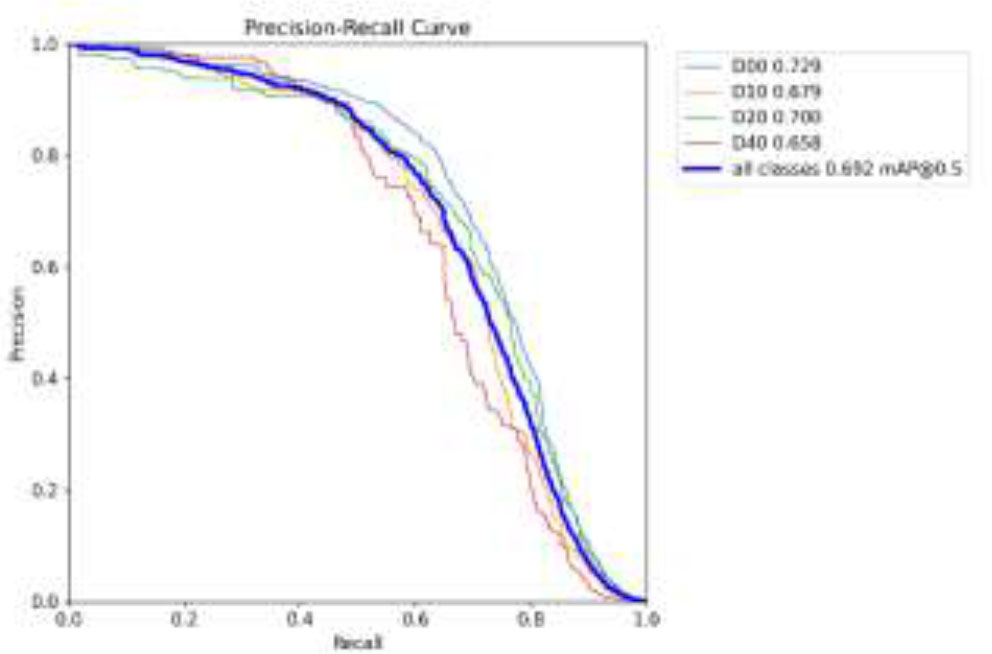
Figure 10.
Average precision of each label in Improved RT-DETR
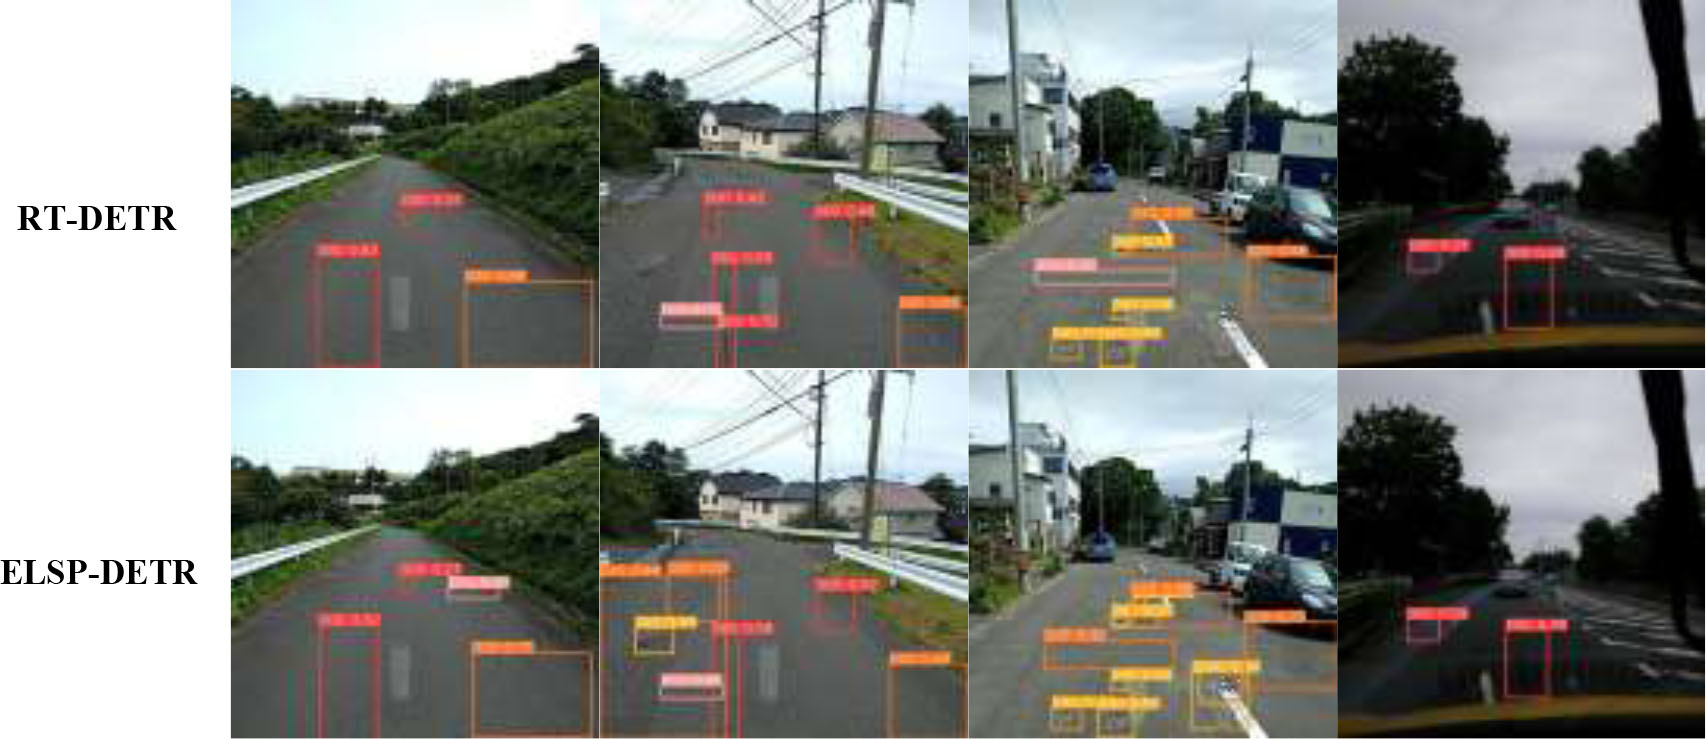
Figure 11.
Visual comparison of test results