
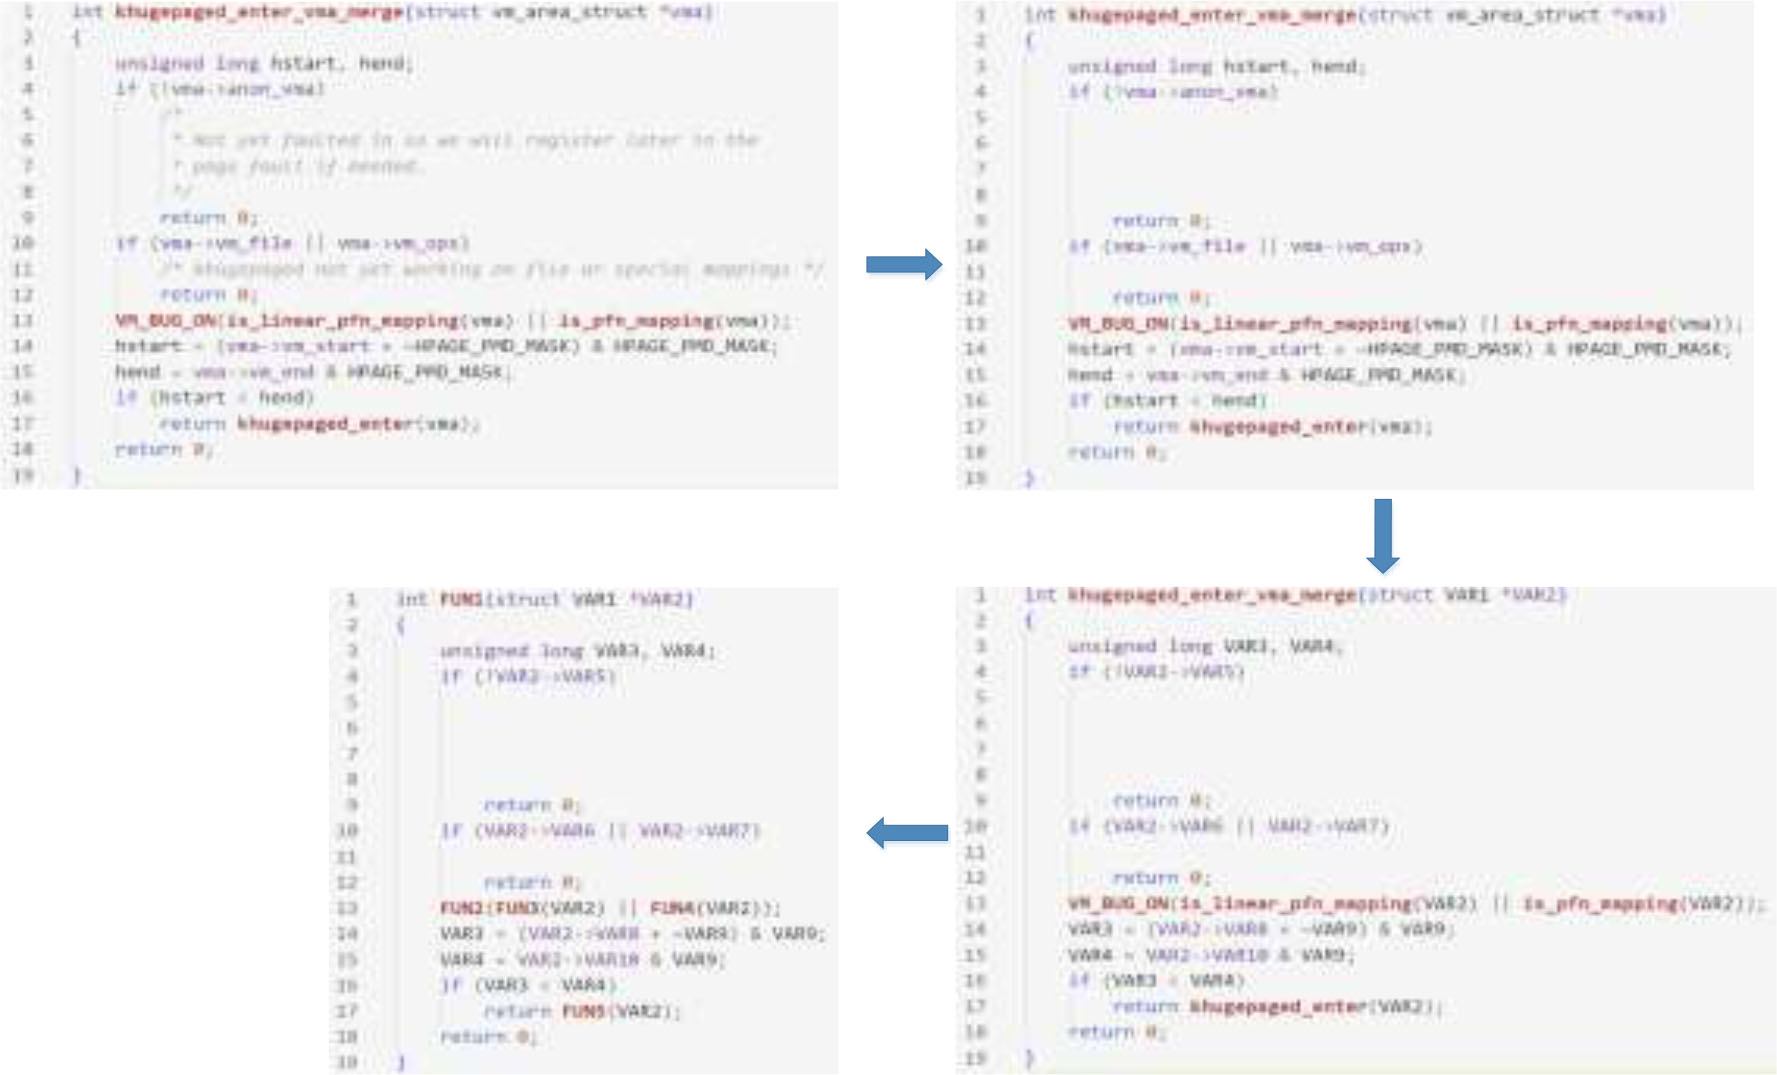
Figure 1.
The Process of Code Standardization
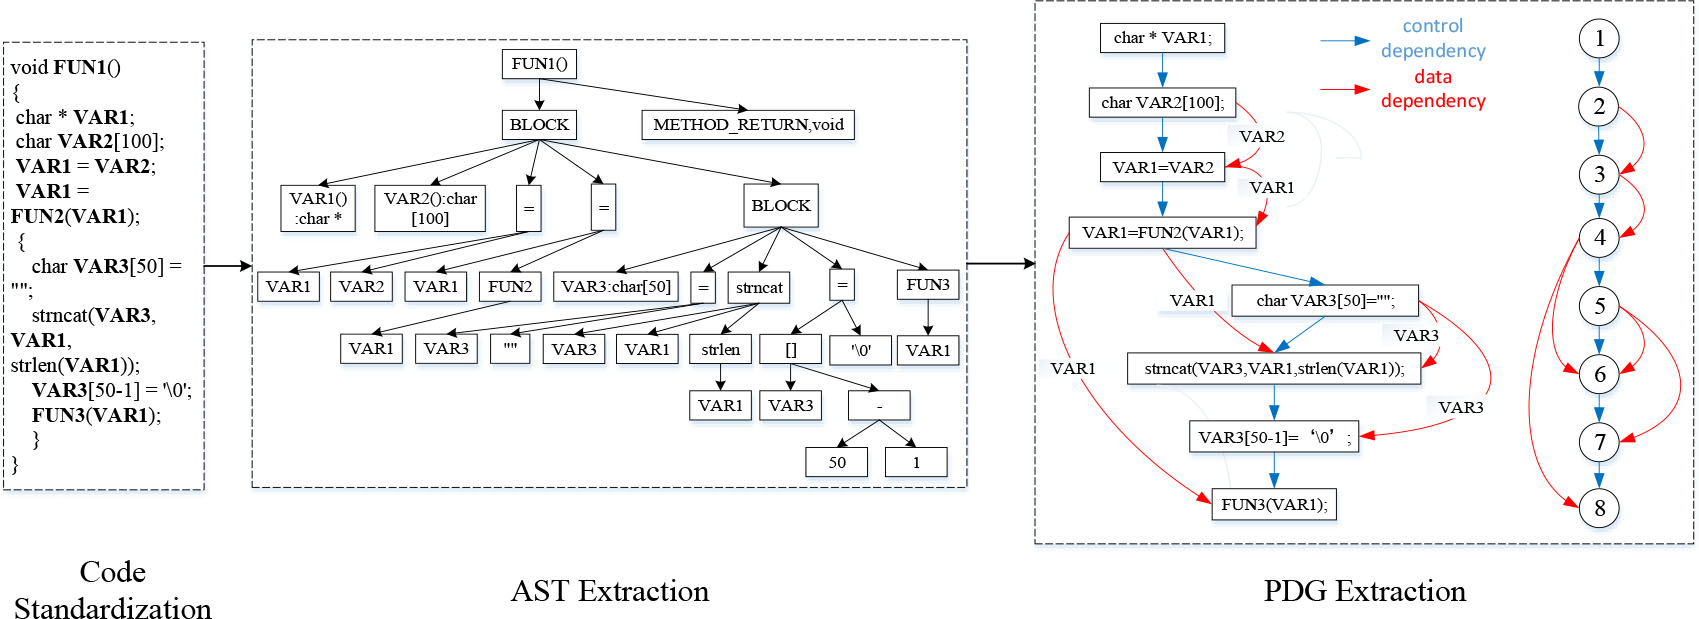
Figure 2.
The Process of Generating the PDG
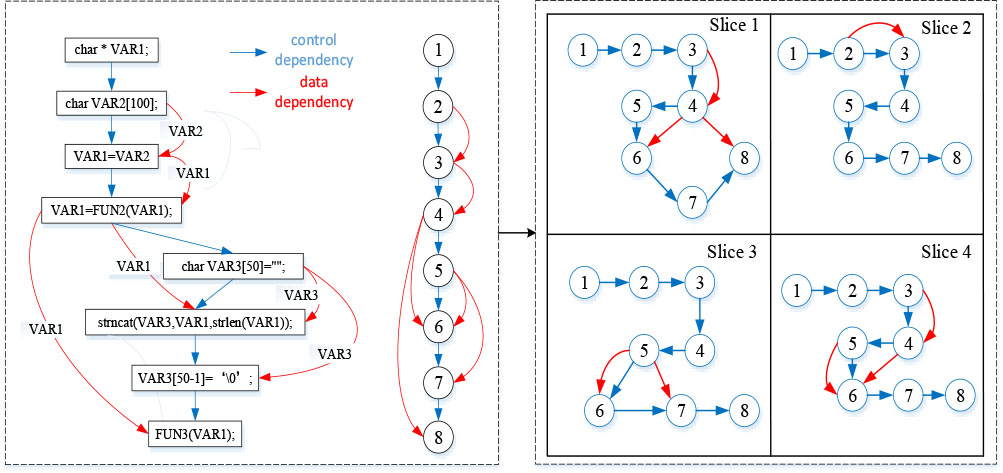
Figure 3.
The Process of Slicing PDG
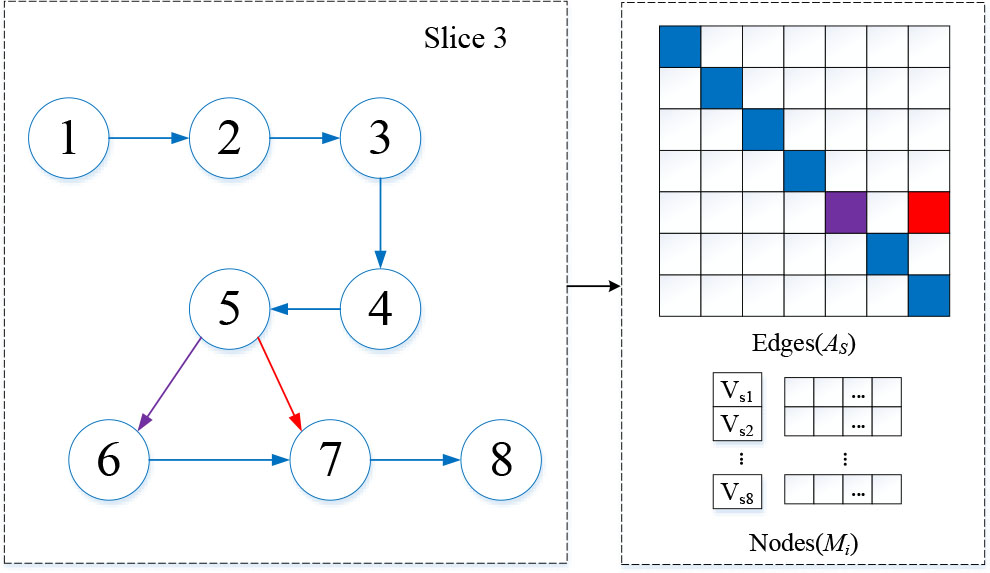
Figure 4.
The Process of Extracting Features from the Slice Graph
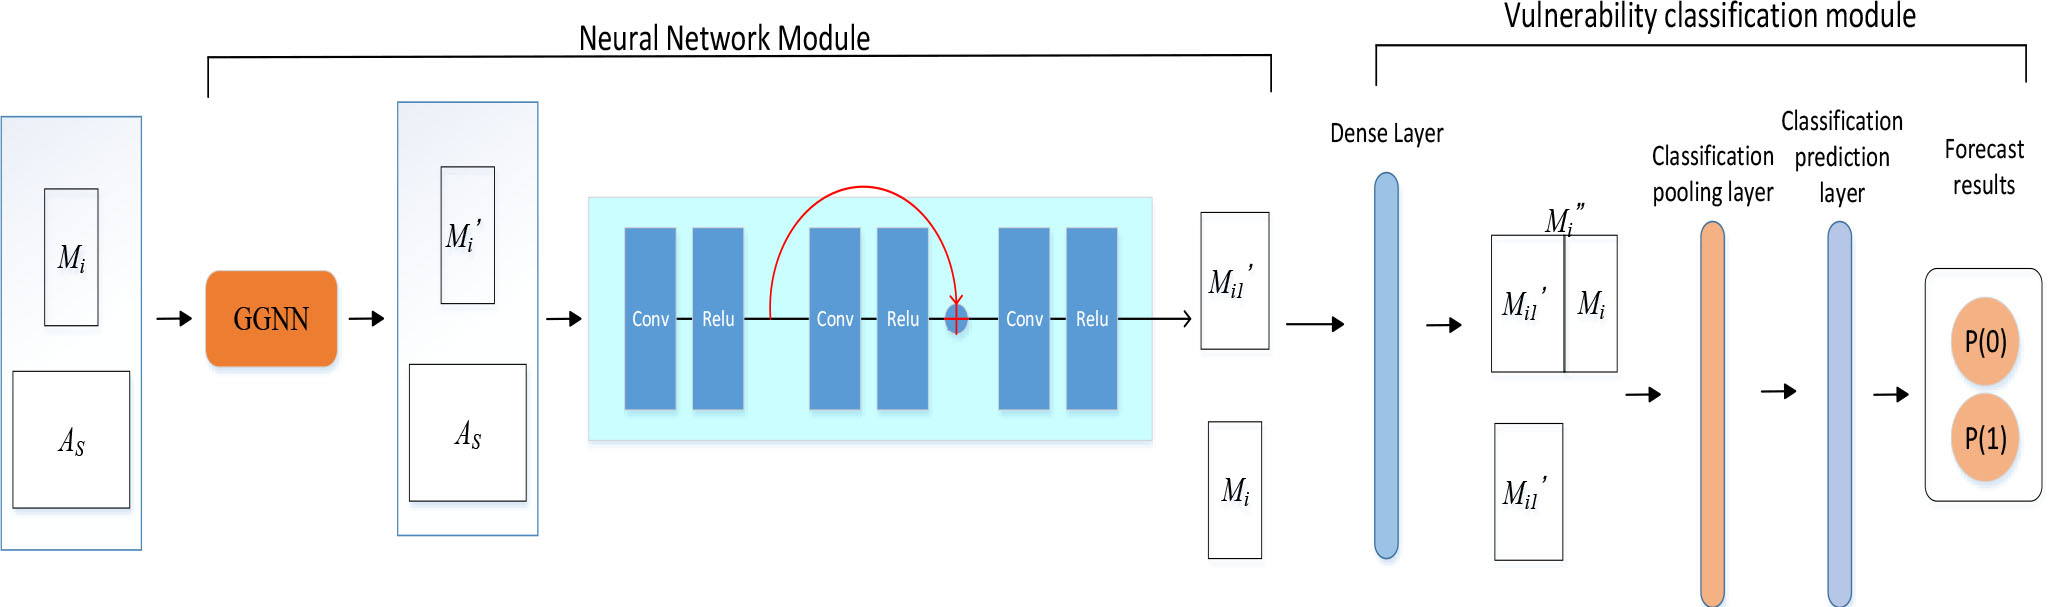
Figure 5.
Vulnerability detection model architecture
TABLE I.
TABLE TYPE STYLES
| Parameter | Value |
|---|---|
| Loss Function | CrossEntropyLoss |
| Optimization Algorithm | Adam |
| Learning Rate | 0.0001 |
| Weight Decay | 0.001 |
| Batch Size | 16 |
| Training Epochs | 500 |
| Max Steps | 10000 |
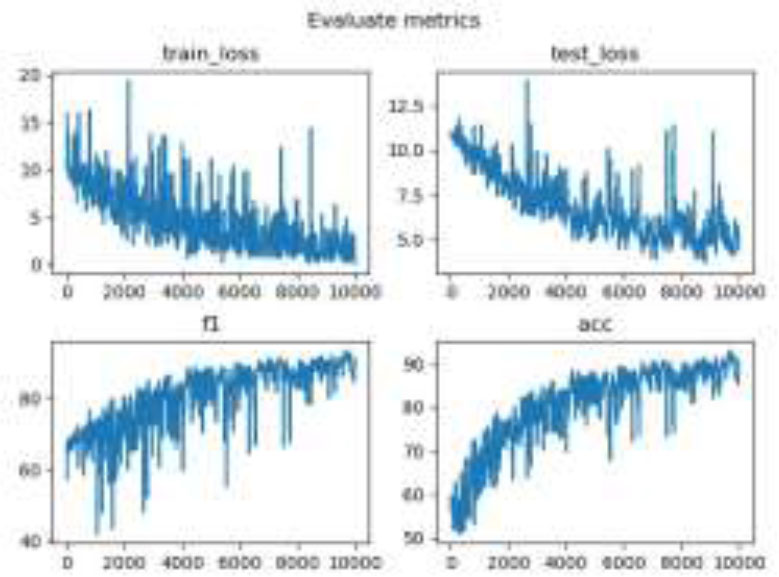
Figure 6.
Results of the Model Training in the Proposed Network
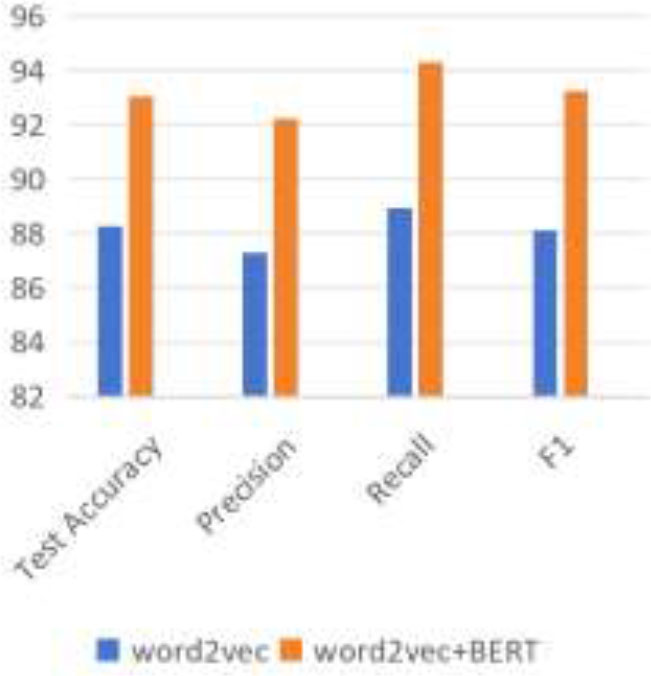
Figure 7.
Ablation experiment
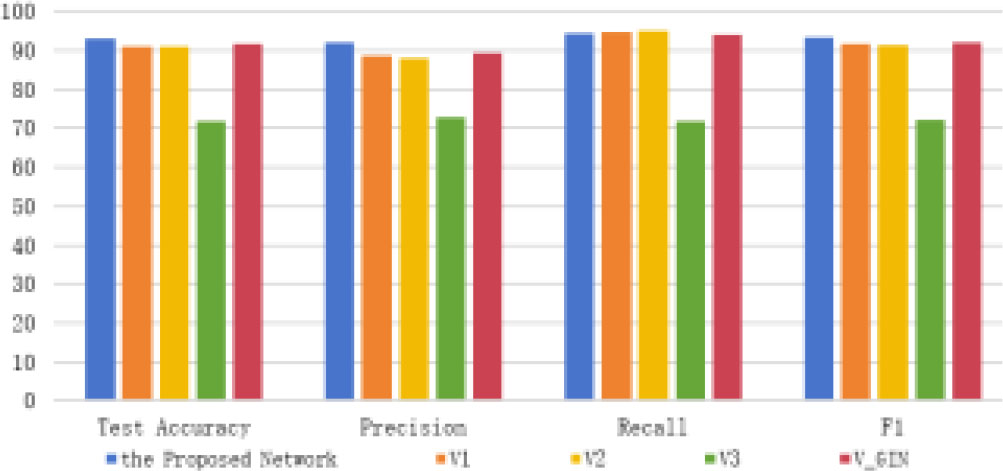
Figure 8.
Ablation experiment
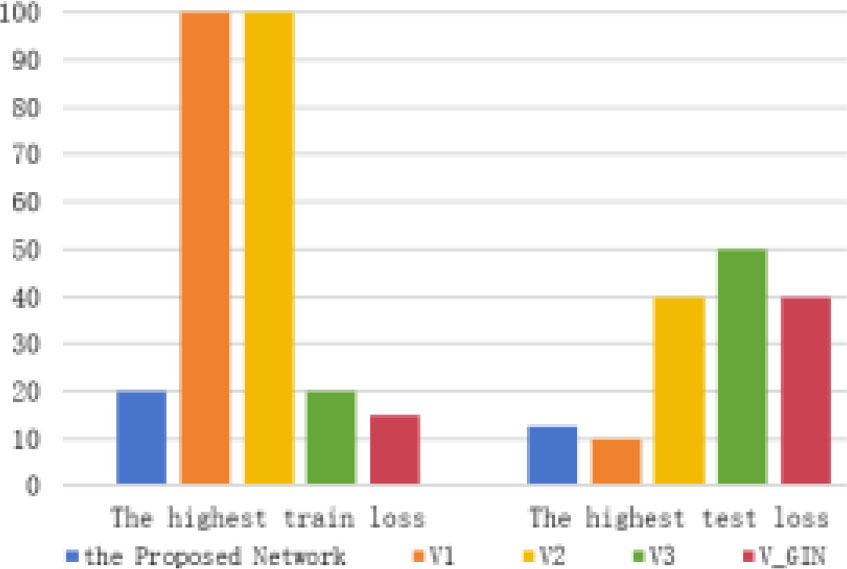
Figure 9.
loss comparison
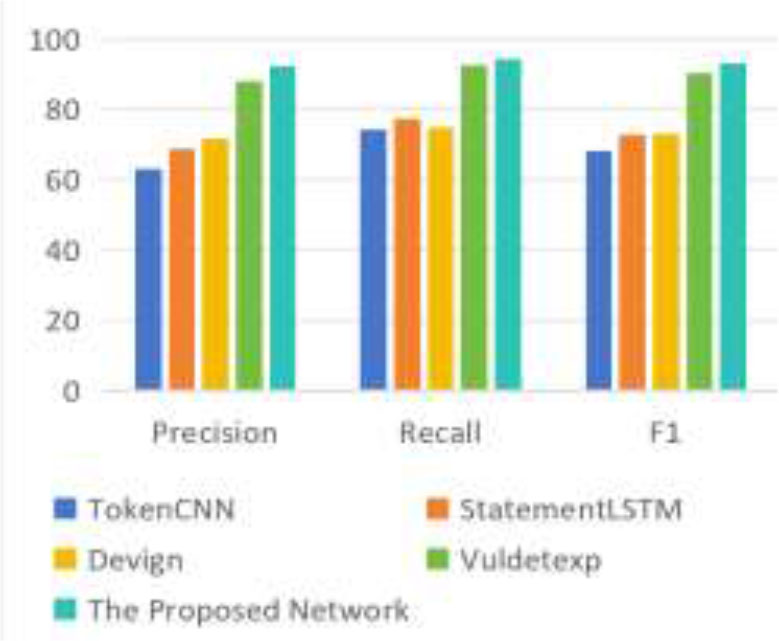
Figure 10.
Performance comparison of different models under evaluation