
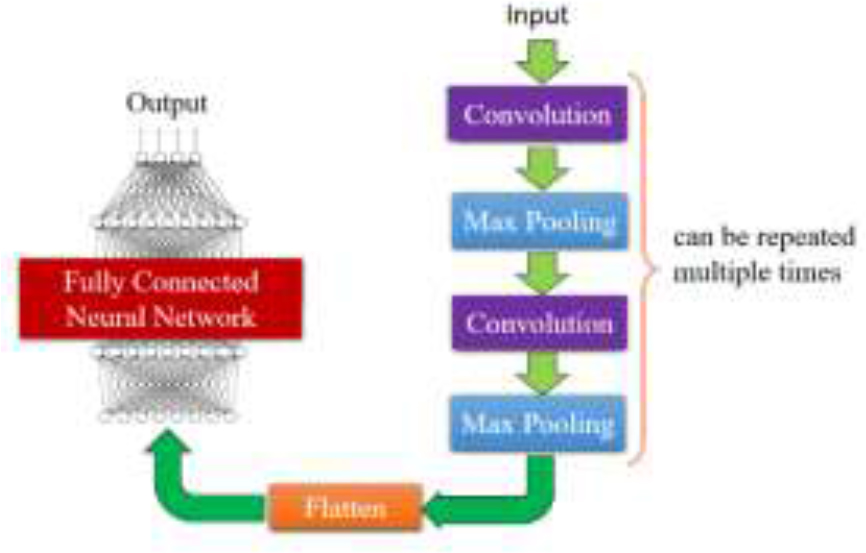
Figure 1.
The basic architecture of a convolutional neural network
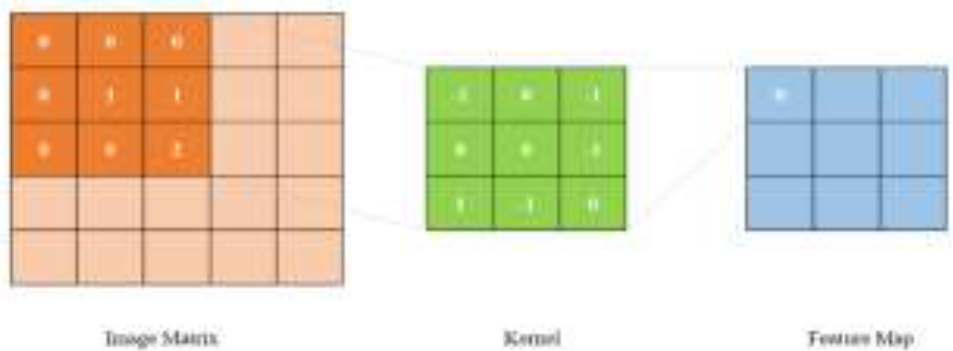
Figure 2.
Convolution Process Diagram
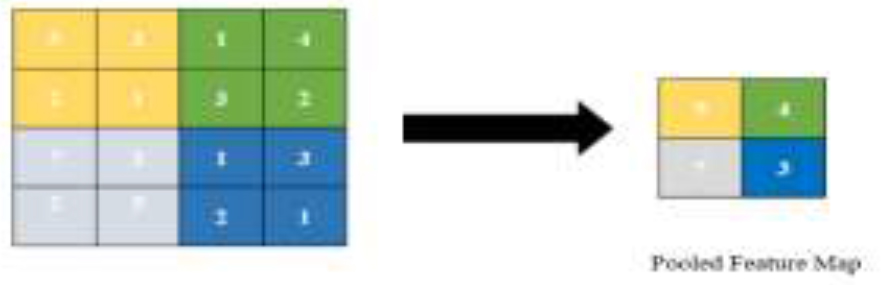
Figure 3.
Pooling Process Diagram
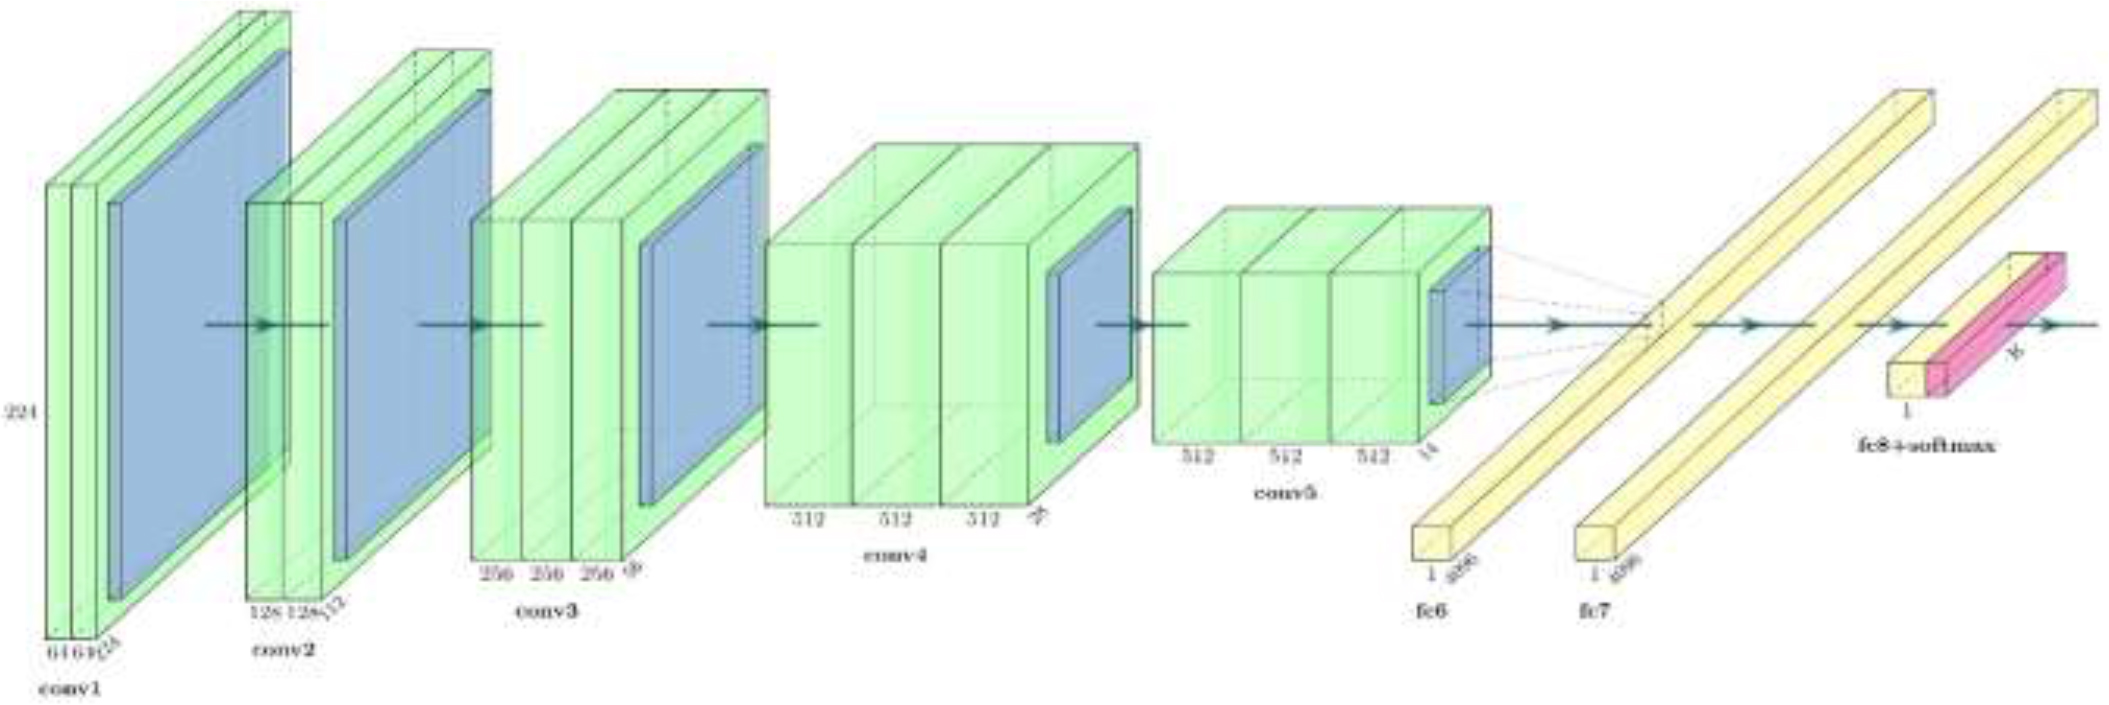
Figure 4.
VGG16 Network Architecture Diagram
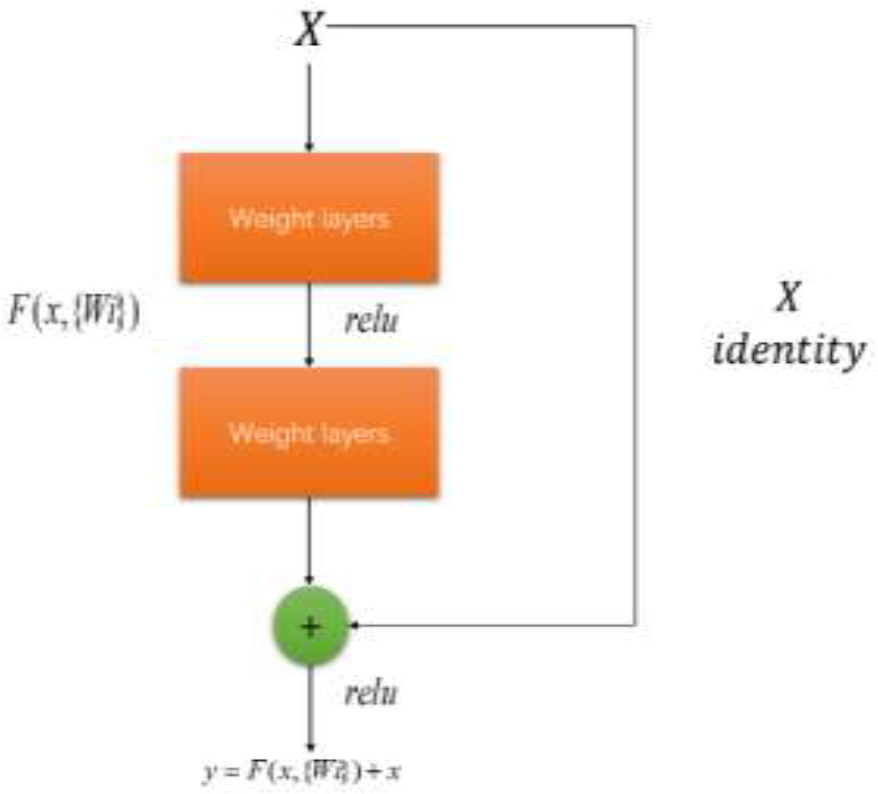
Figure 5.
Residual Connection Structure Diagram
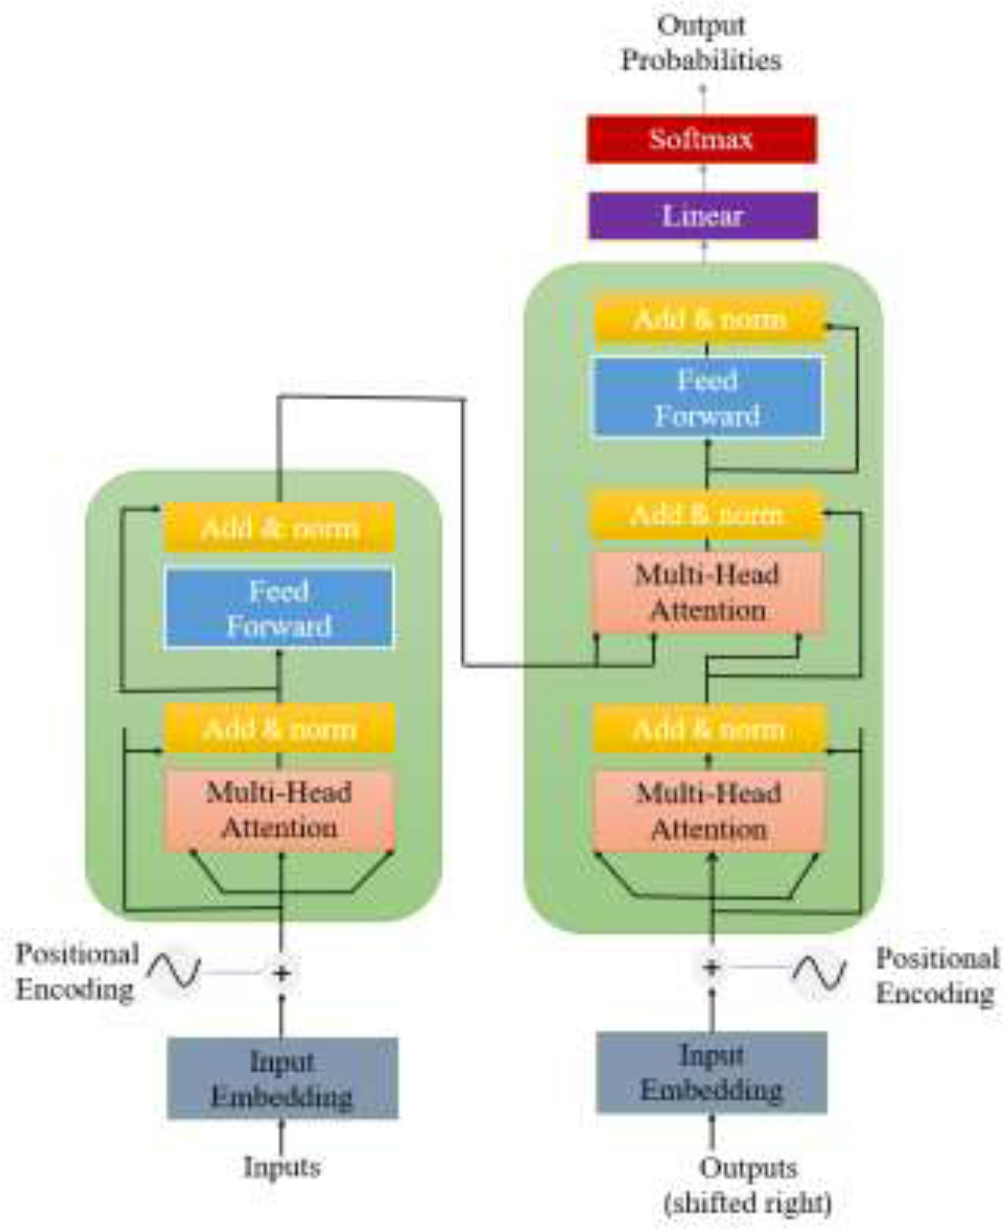
Figure 6.
Transformer Architecture Diagram
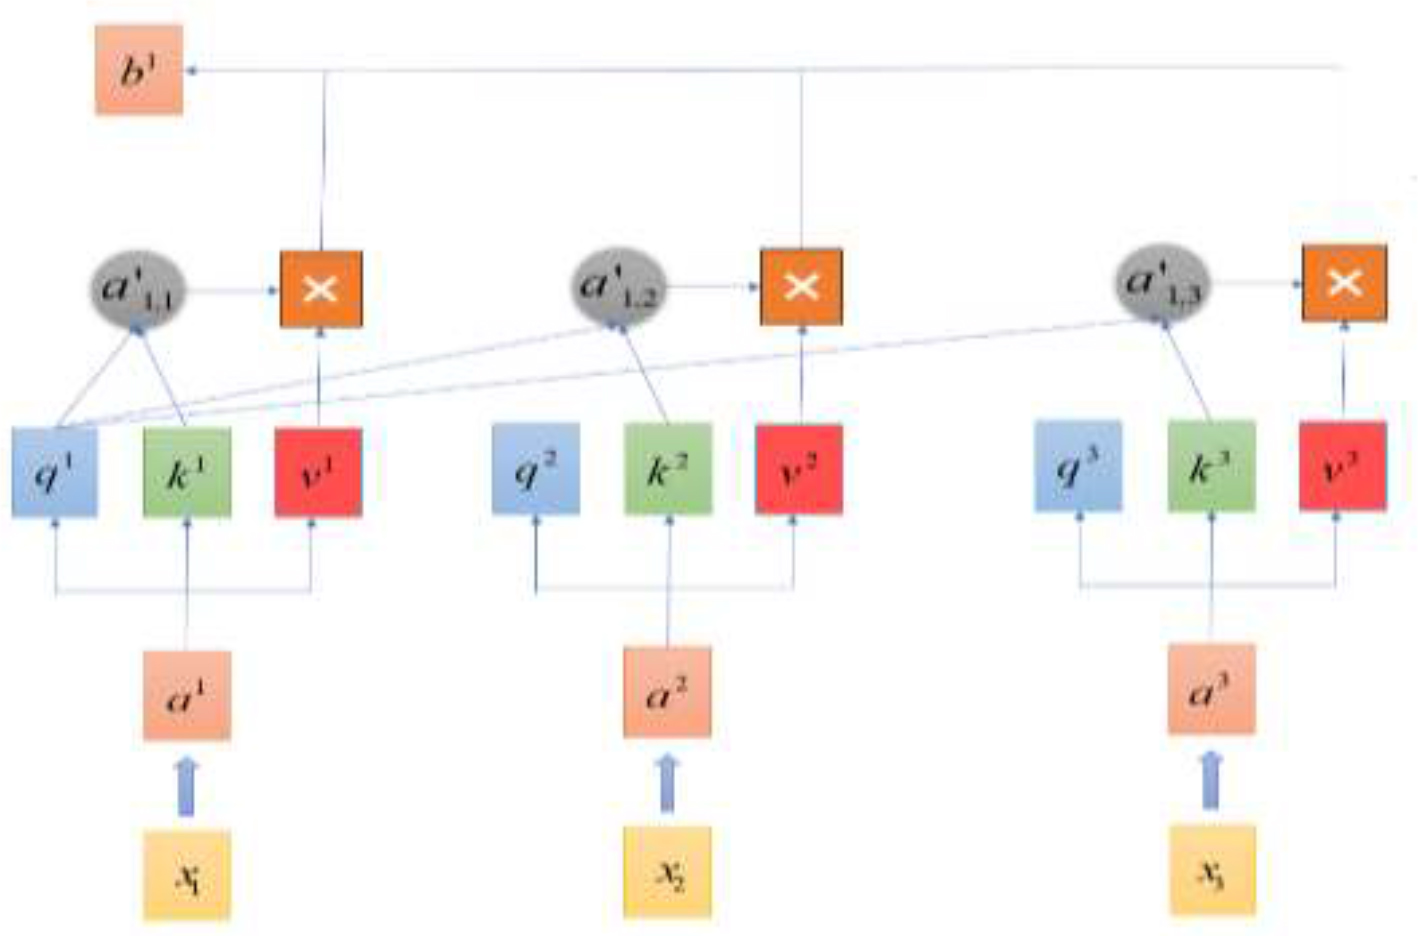
Figure 7.
Self-Attention Mechanism Computation Diagram
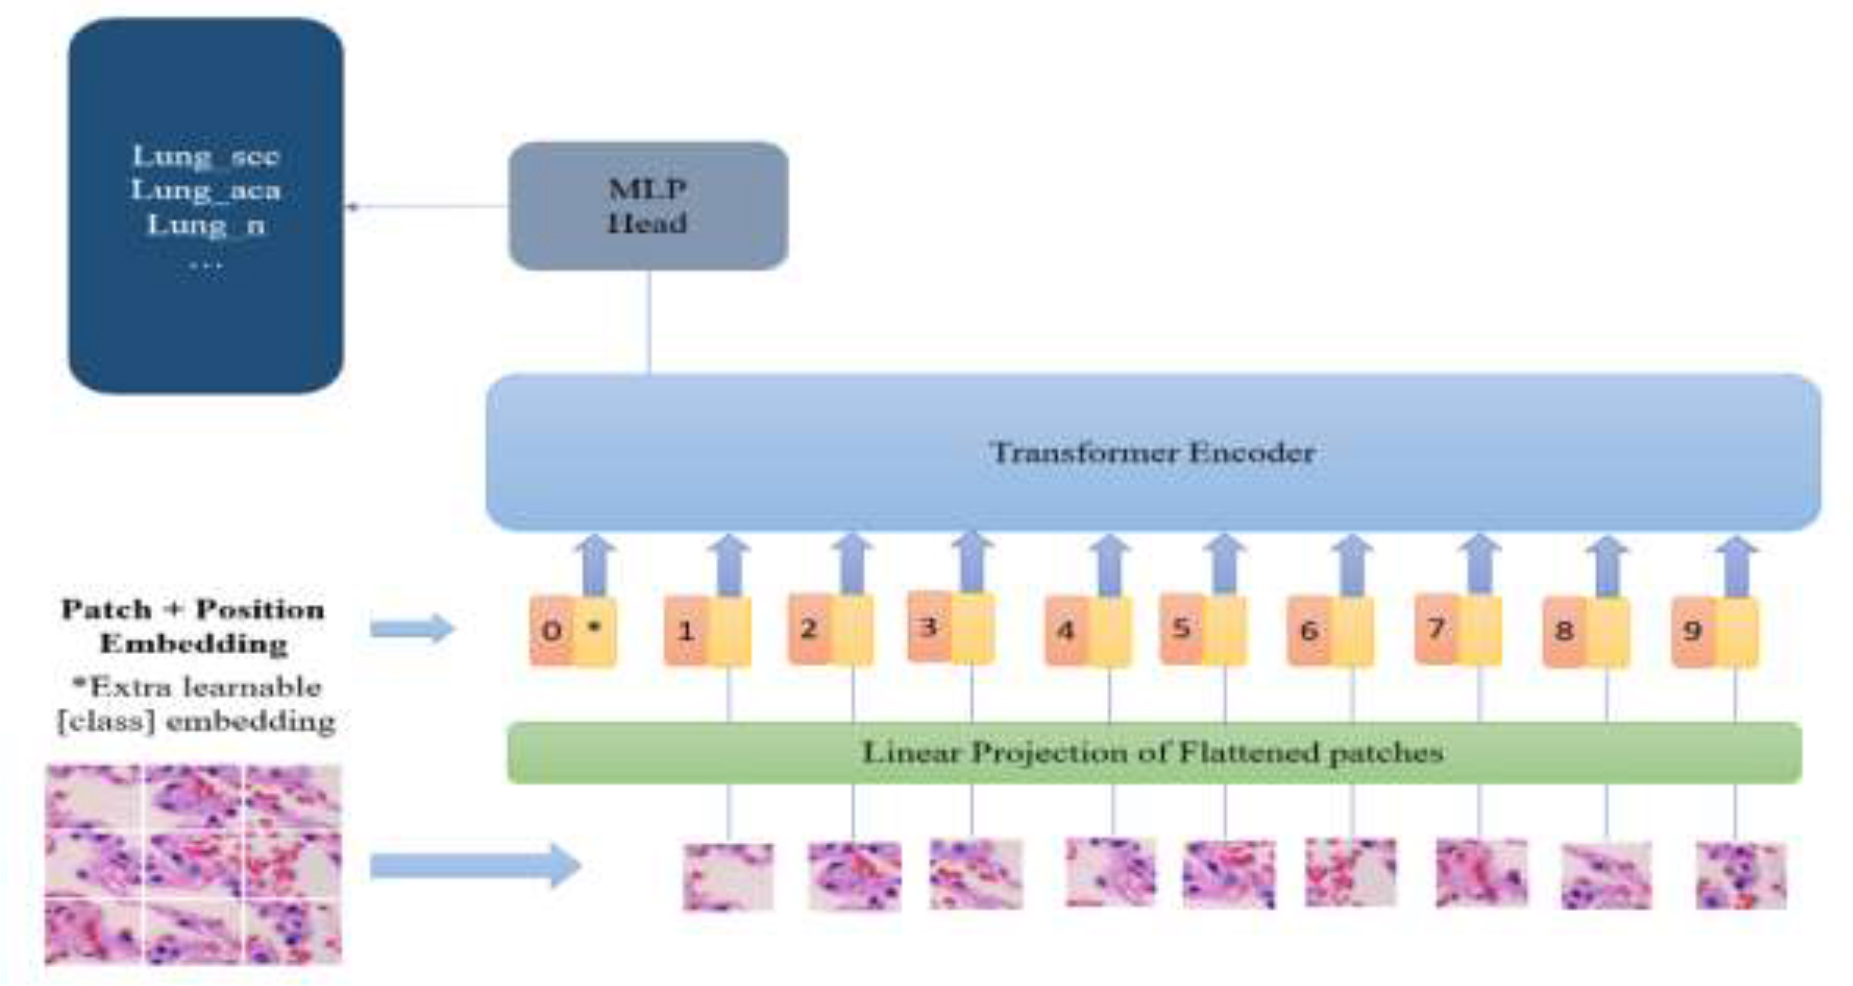
Figure 8.
ViT Architecture Diagram
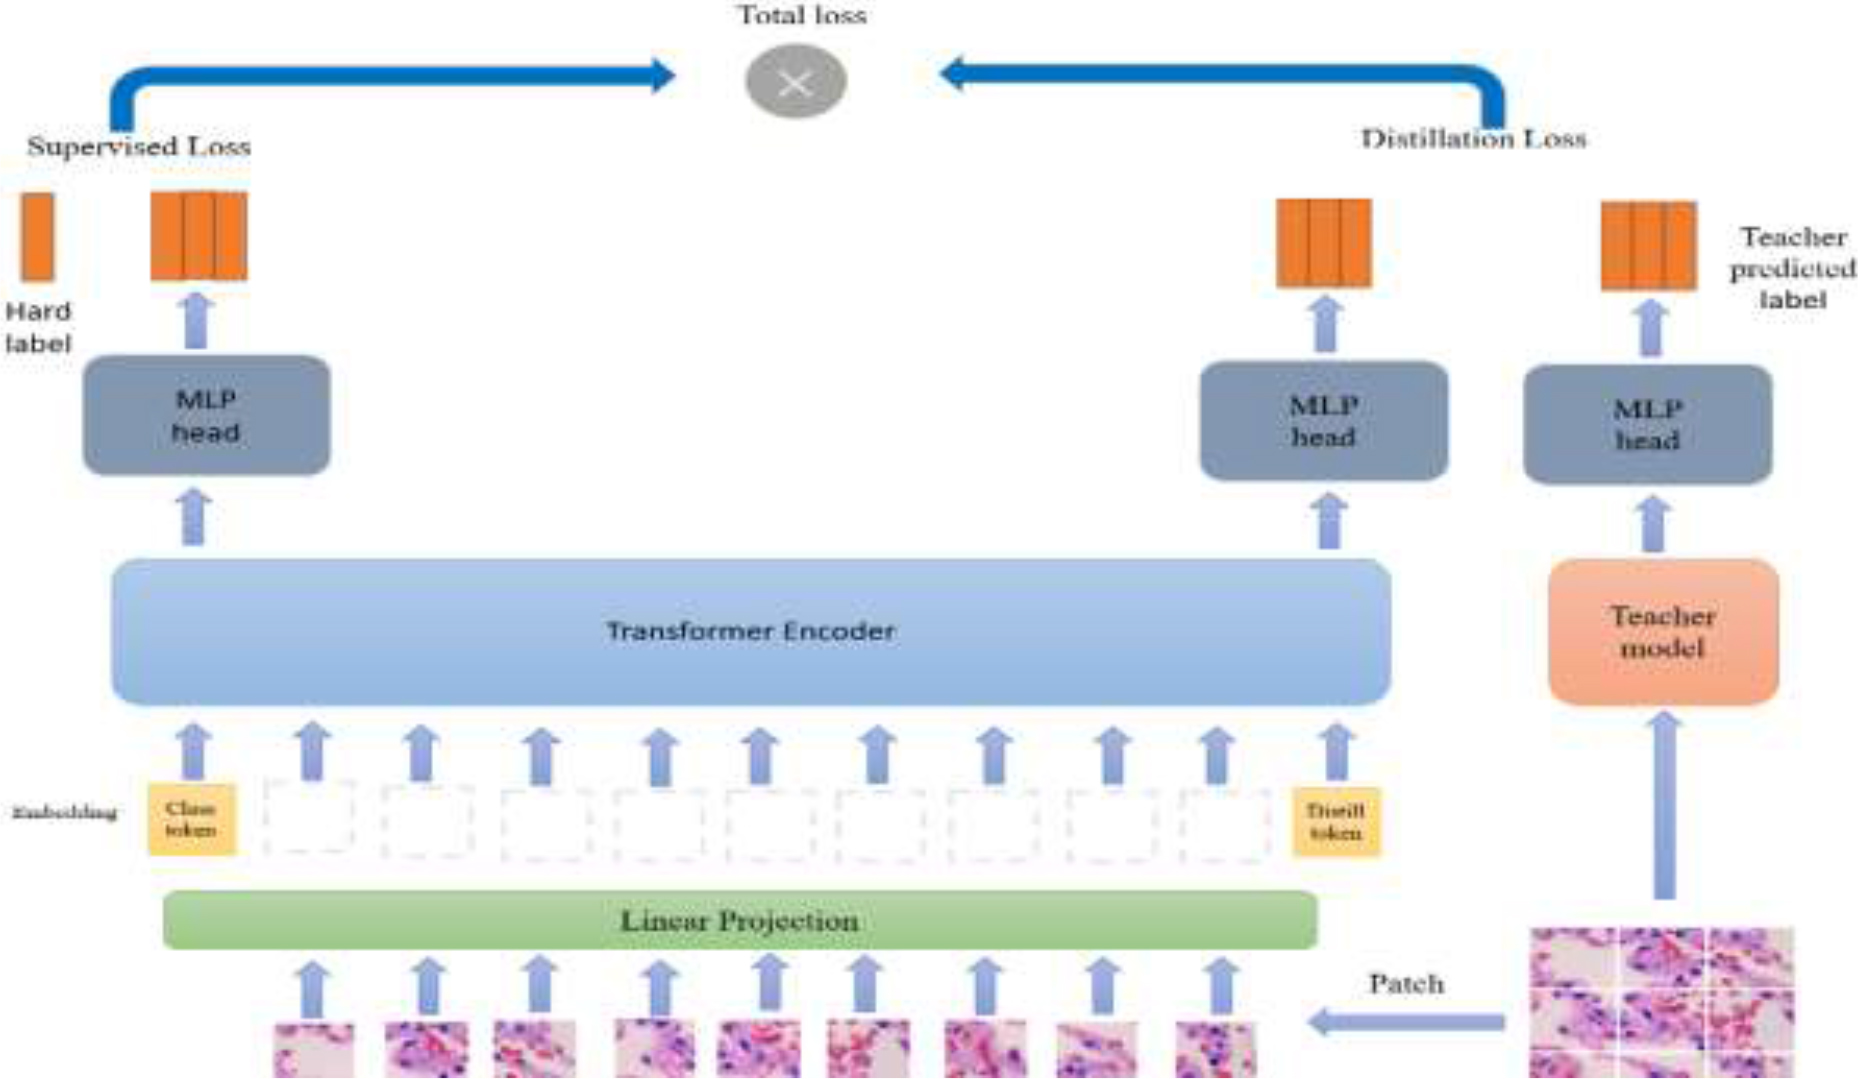
Figure 9.
DeiT Architecture Diagram.
TABLE I.
EXPERIMENTAL DATASET TABLE
| Training Set | Validation Set | Test Set | |
|---|---|---|---|
| lung_aca | 3500 | 750 | 750 |
| lung_scc | 3500 | 750 | 750 |
| lung_n | 3500 | 750 | 750 |
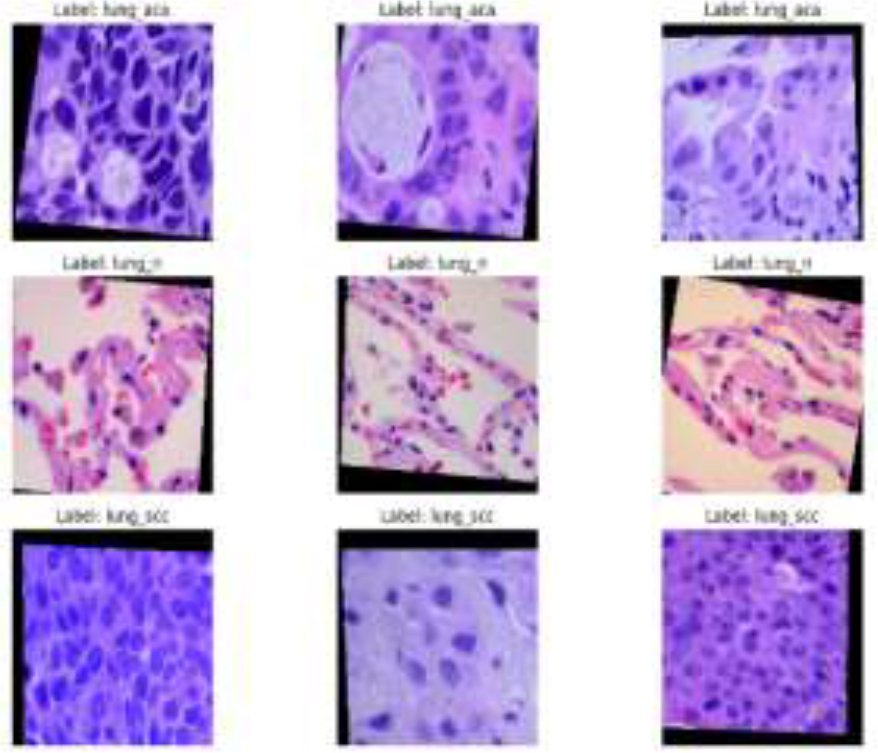
Figure 10.
Randomly selected training sample images
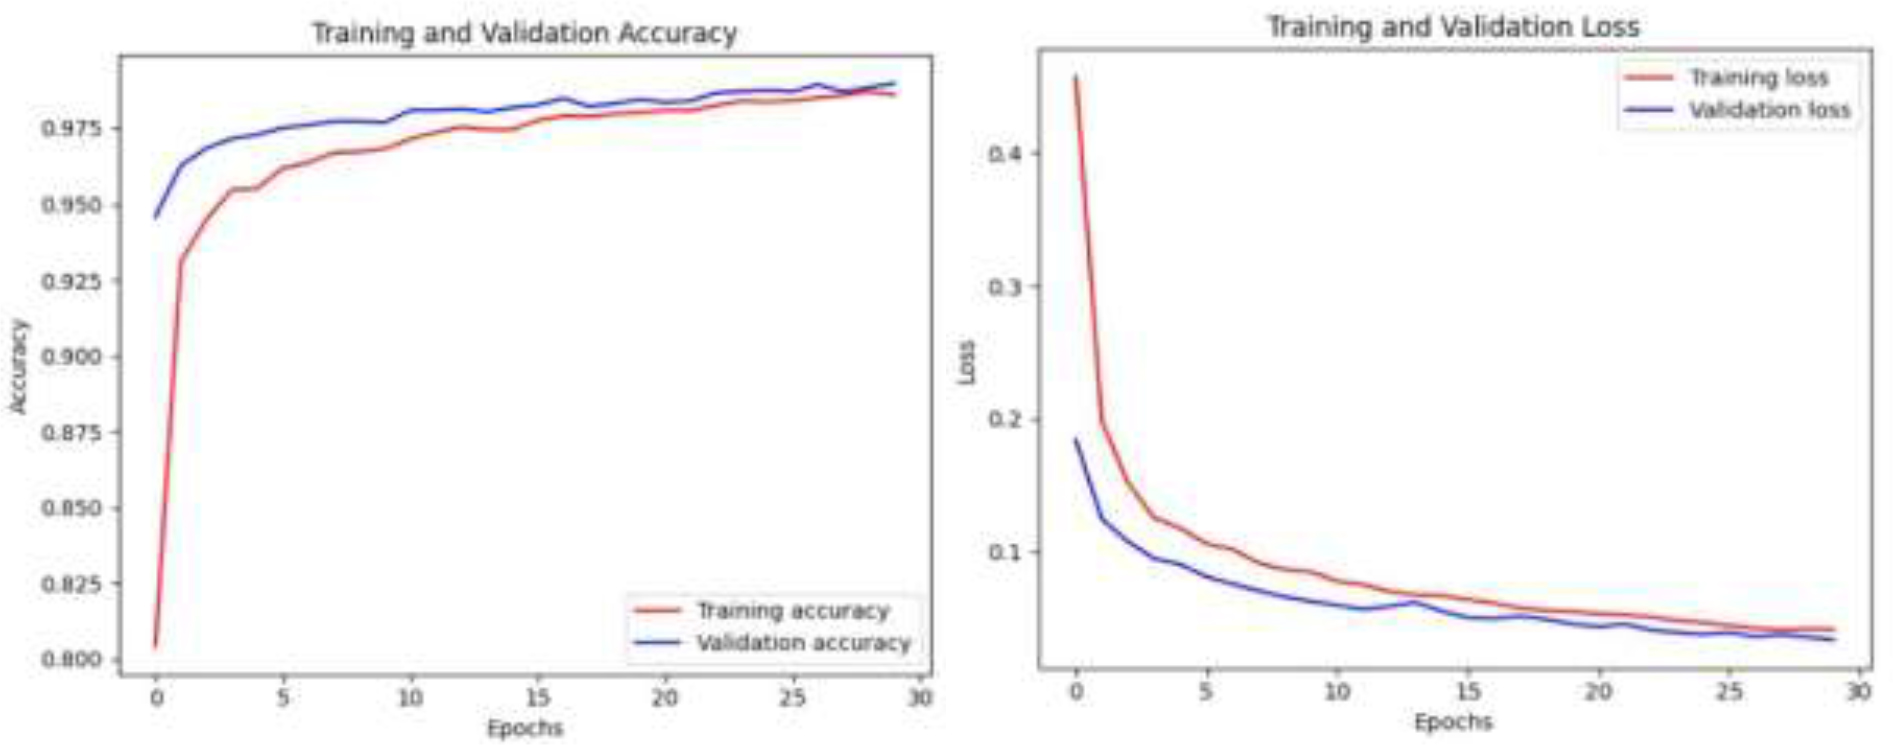
Figure 11.
Accuracy and Loss Curves of theVgg16
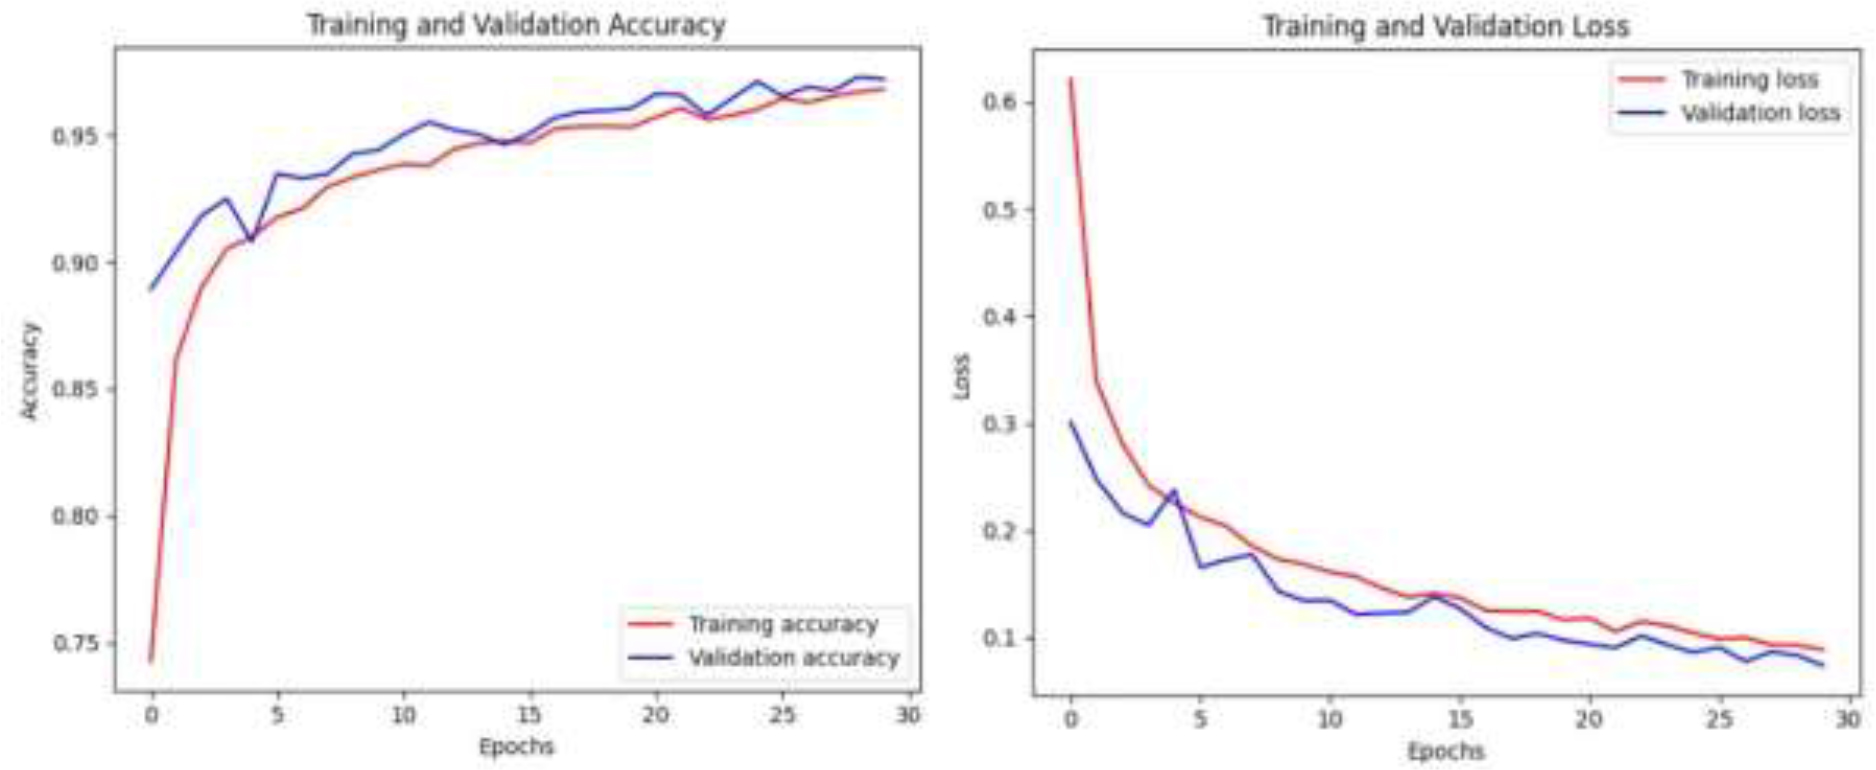
Figure 12.
Accuracy and Loss Curves of the ResNet50
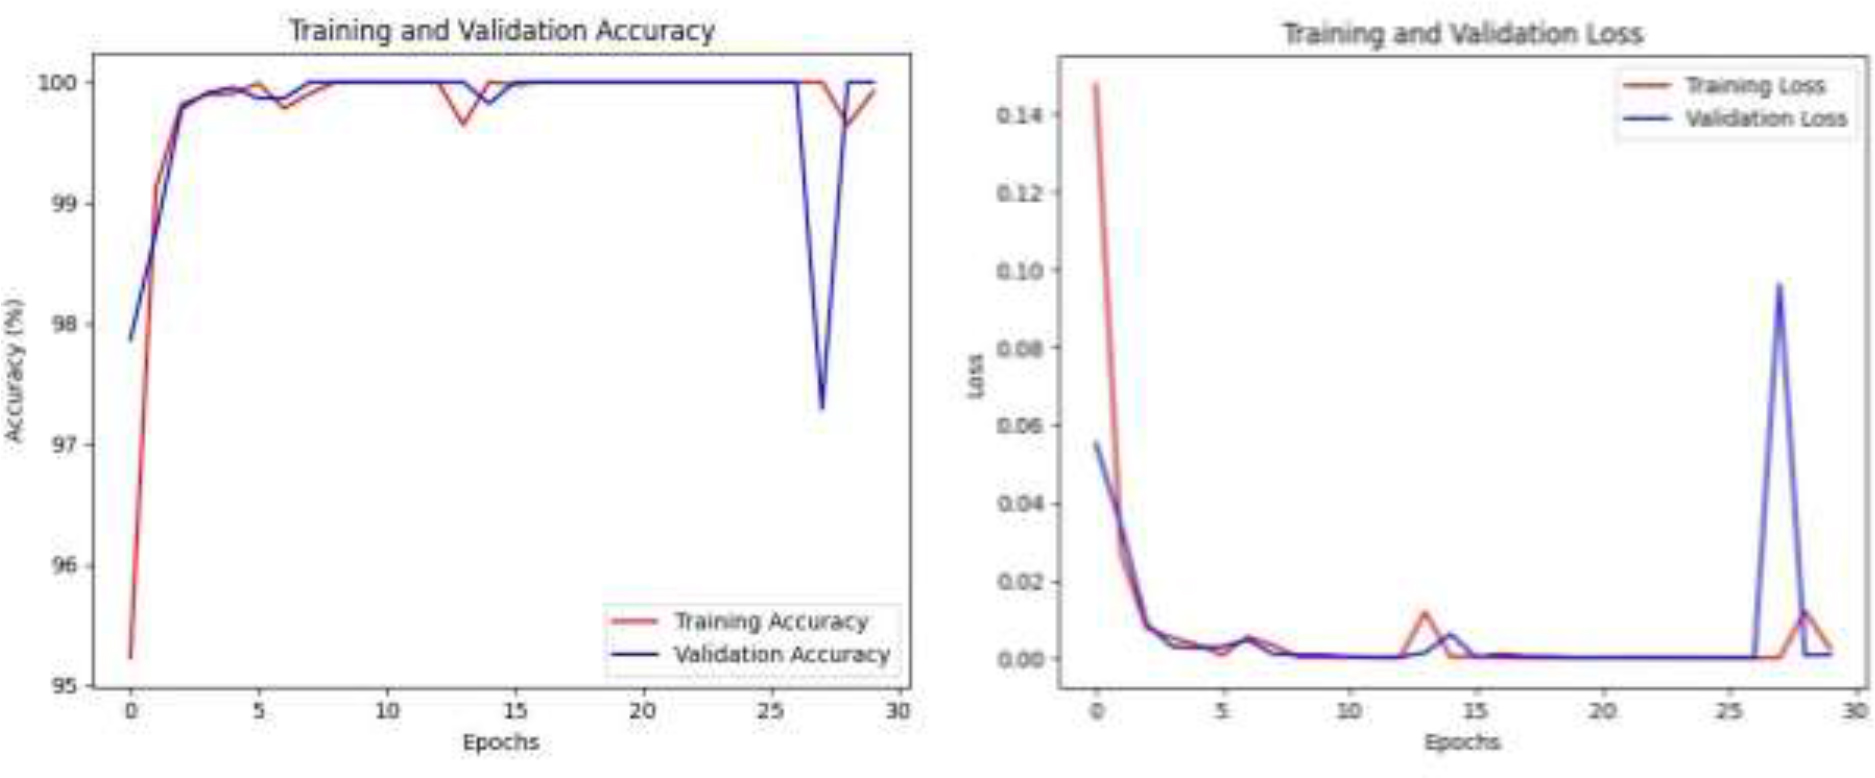
Figure 13.
Accuracy and Loss Curves of the DeiT
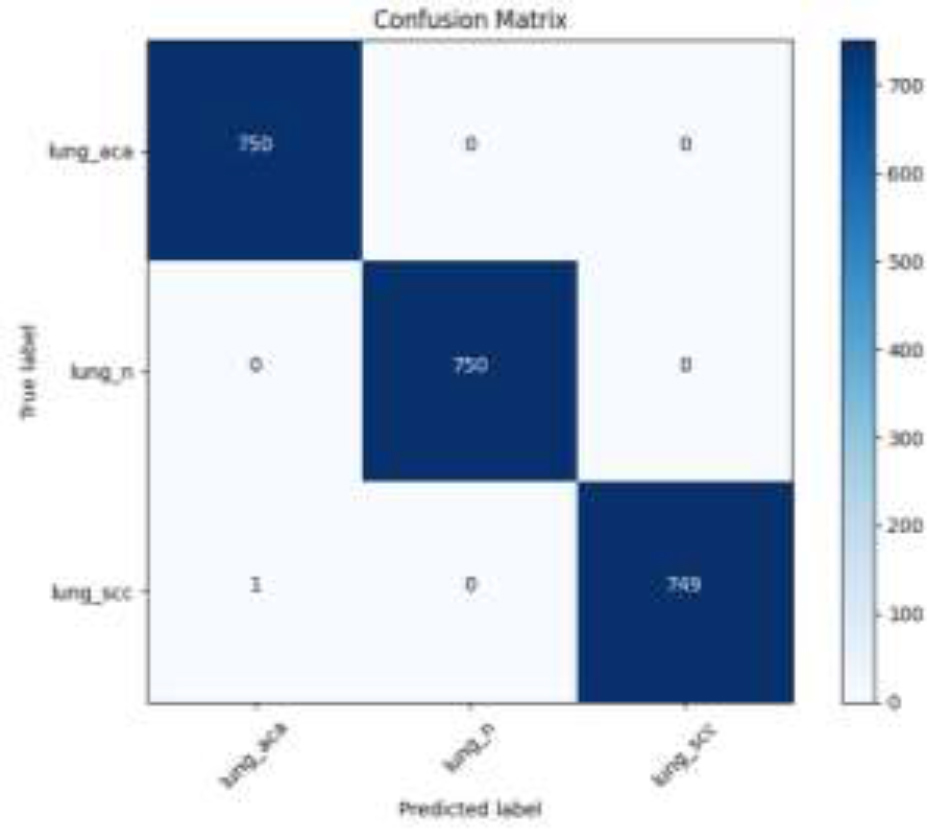
Figure 14.
Confusion Matrix
TABLE II.
Prediction Metrics for Different Models
| Model | Acc(%) | Average Precision(%) | Average Recall(%) | Average F1-Score(%) |
|---|---|---|---|---|
| Vgg16 | 98.49 | 98.49 | 98.49 | 98.49 |
| Resnet50 | 97.51 | 97.51 | 97.51 | 97.51 |
| DeiT | 99.96 | 99.96 | 99.96 | 99.96 |
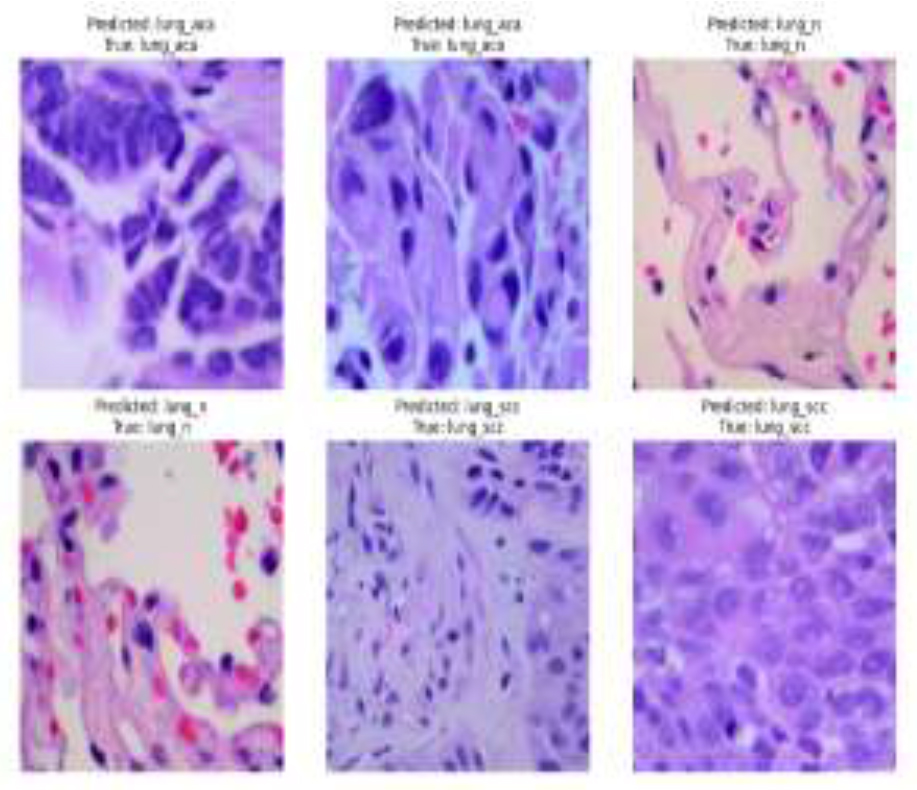
Figure 15.
Random Test Plot